11.1.2 Astrophysical Parameters Inference System (Apsis)
Author(s): Orlagh L. Creevey, Ulrike Heiter, Frédéric Thévenin
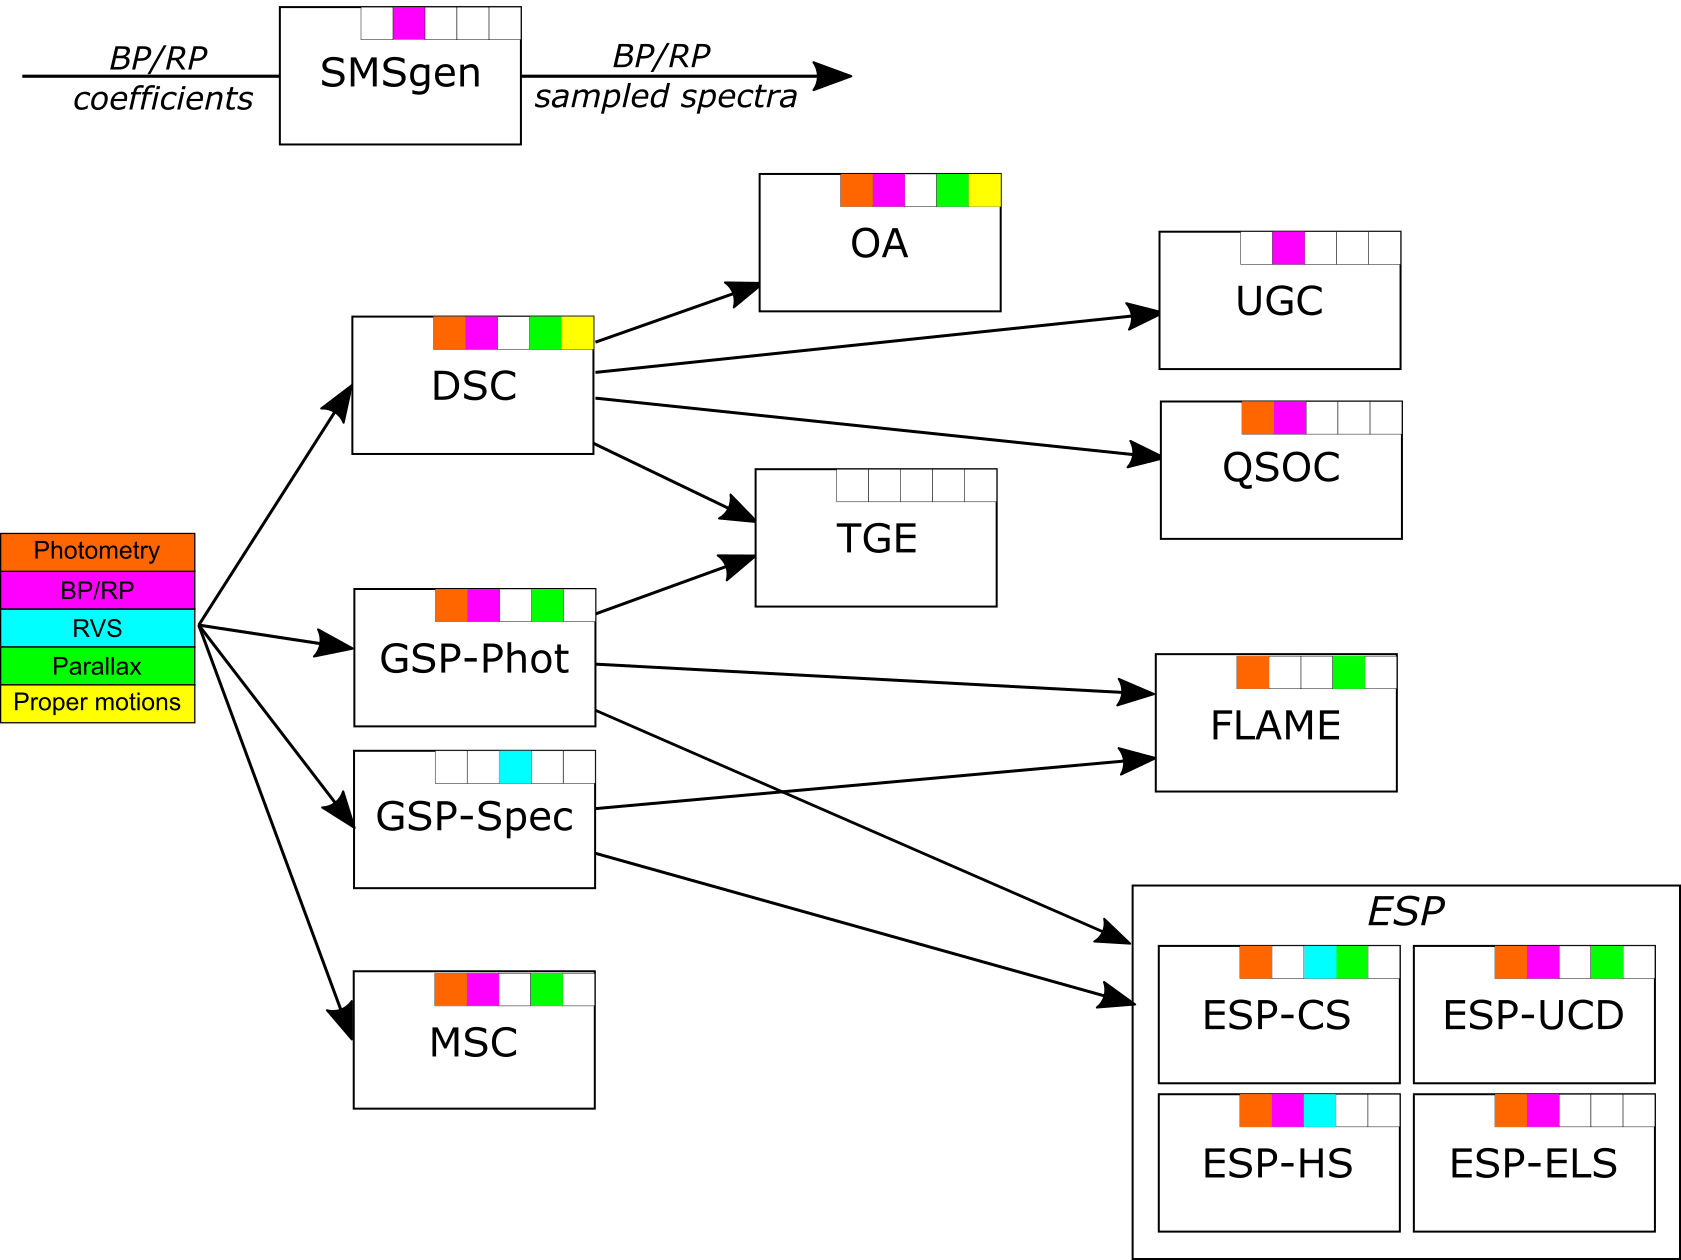
The Astrophysical Parameters Inference System (Apsis) is the name of the processing chain that produces all of the data from CU8 for Gaia DR3, first described in Bailer-Jones et al. (2013). Apsis is composed of 14 modules, 13 of which produce data for the release. An overview of Apsis is shown in Figure 11.1; in this Figure the input data (Section 11.2) for each module and their dependencies on other CU8 modules are highlighted.
In this section we provide a very brief summary of each of the modules in order for the user to understand the data products described in Section 11.1.3, but the user should refer to the data model descriptions and the module-dedicated sections in Section 11.3 for the assumptions, recommendations, caveats, and use cases.
The Sampled Mean Spectra Generator, SMSgen, see Section 11.3.1, processes the mean BP and RP spectra to produce sampled mean spectra. The sampled spectra are used in Apsis processing only. These are not made available in the Gaia archive.
The Discrete Source Classifier, DSC, see Section 11.3.2, provides class probabilities of a source being a quasar, galaxy, single star, binary star, and white dwarf. It produces probabilities based on BP and RP sampled spectra, using the method specmod, or on astrometric and photometric properties, using the method allosmod, and a combined probability of both methods, combmod. All of the DSC products appear in the astrophysical_parameters table for approximately 1.6 billion sources. A subset of these also appear in the qso_candidates, galaxy_candidates, and gaia_source tables.
The General Stellar Parametrizer from Photometry, GSP-Phot, see Section 11.3.3, produces atmospheric properties, extinction and distances based on the BP and RP sampled spectra for all sources with (approximately 500M sources). For every source, GSP-Phot produces four results based on different models (MARCS, PHOENIX, A, OB). These appear in the astrophysical_parameters_supp table. The result with the best goodness-of-fit for each source is provided in the astrophysical_parameters table. A subset of the ’best’ parameters also appears in the gaia_source table for simplification of basic archive queries. A sample of the MCMC for each source is also provided in the mcmc_samples_gsp_phot table.
The General Stellar Parametrizer from Spectroscopy, GSP-Spec, see Section 11.3.4, produces atmospheric properties for approximately 6M sources, chemical abundances (for between 50K-5M sources), and diffuse interstellar bands characterisation (for approximately 1M sources) based on the RVS spectra for sources with . GSP-Spec products appear in the astrophysical_parameters and astrophysical_parameters_supp tables for two different methods.
The Multiple Star Classifier, MSC, see Section 11.3.5, produces binary star parameters, extinction and distances based on the BP and RP sampled spectra for all sources with , by assuming that the BP and RP spectra are combinations of two unresolved stars with a flux ratio between 1 and 5. MSC products appear in the astrophysical_parameters table for approximately 380M sources. A sample of the MCMC for each source is also provided in the mcmc_samples_msc table.
The Final Luminosity Age Mass Estimator, FLAME, see Section 11.3.6, produces evolutionary parameters for sources processed by GSP-Phot and GSP-Spec. FLAME products based on GSP-Phot APs appear in the astrophysical_parameters table for approximately 300M sources with and those based on GSP-Spec APs appear in the astrophysical_parameters_supp tables for approximately 5M sources with .
The Extended Stellar Parametrizer for Emission Line Stars, ESP-ELS, see Section 11.3.7, provides the following emission line class probabilities and labels: Be, Dme, Herbig, Pne, Ttauri, WC and WN stars, along with H equivalent widths using BP and RP sampled spectra. It also provides spectral types (O, B, A, F, G, K, M, CSTAR). ESP-ELS products appear in the astrophysical_parameters table for approximately 5M sources with .
The Extended Stellar Parametrizer for Hot Stars, ESP-HS, see Section 11.3.8, produces atmospheric properties for, and extinction towards, hot stars (8 000 - 50 000 K) from BP, RP and RVS spectra (approximately 2M sources). It also produces a spectral type for all processed sources (200M sources). ESP-HS products appear in the astrophysical_parameters table.
The Extended Stellar Parametrizer for Cool Stars, ESP-CS, see Section 11.3.9, produces a chromospheric activity index based on the Ca II IRT in the RVS spectra. ESP-CS products appear in the astrophysical_parameters table for approximately 2M sources with 14. The Extended Stellar Parametrizer for Ultra Cool Dwarfs, ESP-UCD, see Section 11.3.10, produces for ultra-cool dwarfs based on RP sampled spectra. ESP-UCD products appear in the astrophysical_parameters table for about 100 000 sources.
The Total Galactic Extinction module, TGE, see Section 11.3.11, analyses the extinction from GSP-Phot to produce a two-dimensional total_galactic_extinction_map at HEALPix levels 6, 7, 8, and 9, and at the optimal HEALPix level in the total_galactic_extinction_map_opt table.
The Outlier Analysis module, OA, see Section 11.3.12, produces object clustering of outlier objects, i.e. those objects having no DSC class probability larger than 0.999. OA products appear in the astrophysical_parameters table for approximately 56M sources, and produce a 30x30 self-organising map found in the oa_neuron_information table and prototype spectra for each neuron are given in the oa_neuron_xp_spectra table.
The Unresolved Galaxy Classifier, UGC, see Section 11.3.13, produces approximately 1.4M redshifts of sources which are classified by DSC as galaxy using the BP and RP sampled spectra. UGC products appear in the galaxy_candidates table.
The QSO Classifier, QSOC, see Section 11.3.14, produces approximately 6.4M redshifts of sources which are classified by DSC as quasar using the BP and RP sampled spectra. QSOC products appear in the qso_candidates table.