11.3.7 Extended Stellar Parametrizer for Emission-Line Stars (ESP-ELS)
Author(s): Yves Frémat
Goal
ESP-ELS is aiming to identify the XP spectra of seven classes of emissions-line stars (ELS): Be stars, Herbig Ae/Be stars, T Tauri stars, active M dwarf stars, Wolf Rayet WC stars & WN stars, and planetary nebula. The selection and classification is based on the integrated information (i.e. pseudo-Equivalent Width or pEW) measured in a wavelength range centred on the H line and/or on the use of two random forest classifiers trained on libraries of synthetic spectra as well as on observed BP/RP data obtained for a sample of reference ELS. The module also provides a spectral type tag (i.e. O, B, A, F, G, K, M, CSTAR) which is used during the selection of the targets to be processed by the ESP-ELS and ESP-HS software packages.
Inputs
ESP-ELS processes targets brighter than magnitude . The module’s input is made of the BP and RP spectra sampled over 120 samples per passband prepared by SMSgen (Section 11.3.1). The data are only considered when it results from the co-addition of more than 10 transits in both passbands, and that the SNR integrated over the 2 passbands is sufficiently high.
The astrophysical parameters (, , , and ) derived by GSP-Phot are provided to the module with no filtering nor post-processing applied. The APs are adopted to classify and to correct the H pEW for spectral line and molecular band blends. Therefore, the module also requires a grid of pre-calculated H pEWs measured on simulations of non-ELS stars (i.e. synthetic spectra, Section 11.2.3) and tabulated as a function of , , , and .
Outputs
All the results of the module are stored in the table astrophysical_parameters. In a first instance the ESP-ELS measures the H pEW (ew_espels_halpha) and its uncertainty (ew_espels_halpha_uncertainty). The definition adopted is such that the pEW should be negative when emission is present in the H domain. The value expected for a non-ELS equivalent of the star with same APs and derived on the simulated data is stored in the field (ew_espels_halpha_model). A quality flag (ew_espels_halpha_flag) indicates if the H pEW is corrected (value 1) or not (value 0) for spectral line and molecular band blending.
A first classifier determines the spectral type of the target (spectraltype_esphs, note that initially the field was produced by ESP-HS, but its determination was finally moved to the upstream ESP-ELS module without the name being adapted). This classification is based on a random forest algorithm which provides, per spectral type tag, a probability which is used to perform a quality assessment whose result is stored as the second digit (the first digit providing information about the astrophysical parameters derived by the ESP-HS module) of the field (flags_esphs). Usually its value ranges from 1 to 5 and is based on the first (p1) and second (p2) highest probability as follows:
-
p1 and p2 : second digit of flags_esphs = 1
-
p1 and p2 : second digit of flags_esphs = 2
-
p1 and p2 : second digit of flags_esphs = 3
-
p1 and p2 : second digit of flags_esphs = 4
-
p1 : second digit of flags_esphs = 5
-
target brighter than G=17.65, but no spectral type tag was derived: flags_esphs = 999
-
similarly when no parameters were derived by ESP-HS (e.g. in the case of stars cooler than spectral type A) the value ’9’ is to be expected in the first digit, while the second digit may still have values ranging from 1 to 5 if a spectral type is provided.
During the validation of the CSTAR spectral type tag used to identify candidate carbon stars (Gaia Collaboration et al. 2023c), it has been noticed that only a fraction of these had significantly stronger than normal C2 and CN molecular bands. We flagged these targets with the strongest CN features by setting the quality flag to 0 (zero). The criteria that we adopted to make the offline selection are described in Gaia Collaboration et al. (2023c).
Where pertinent, the classifier estimates the probability of an ELS to be member of one of the following classes:
Be stars (classprob_espels_bestar), Herbig Ae/Be stars (classprob_espels_herbigstar), T Tauri stars
(classprob_espels_ttauristar), active M dwarf stars (classprob_espels_dmestar), Wolf Rayet WC stars
(classprob_espels_wcstar), Wolf Rayet WN stars (classprob_espels_wnstar), planetary nebula (classprob_espels_pne). The ELS class label having received the highest probability is saved in classlabel_espels. A quality assessment based on the difference () between the 2 highest probability values is provided by the flag classlabel_espels_flag and takes the following values:
-
: classlabel_espels_flag=0
-
: classlabel_espels_flag=1
-
: classlabel_espels_flag=2
-
: classlabel_espels_flag=3
-
: classlabel_espels_flag=4
Note that the identification of Be stars, Herbig Ae/Be stars, T Tauri stars, and active M dwarf stars relies on the astrophysical parameters derived by GSP-Phot. After validation and during the post-processing, a significant fraction of APs that were suspected of being wrong have been removed. On the other hand part of the APs that survived the post-processing disagree completely with the spectral type tag provided by the ESP-ELS and may point towards issues with the APs, the spectral type tag, or/and with the input data. To identify both cases, the quality flag was updated as follows:
-
classlabel_espels_flag+10: APs and spectral type tag are not consistent.
-
classlabel_espels_flag+20: APs removed during the post-processing
Method
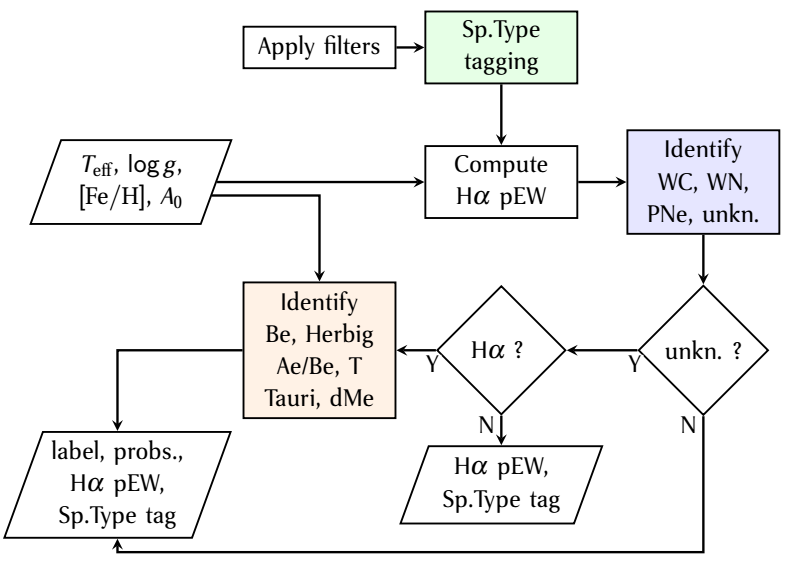
The algorithm is based on the use of three main classifiers that follow the order shown in Figure 11.37. After filtering the data in order to meet the requirements of all the components, the first classifier is applied to provide a spectral type tag (this tag is used during the validation, and during the target selection made by ESP-HS). The H pseudo-equivalent width is computed and, depending on the value provided by GSP-Phot, is corrected for molecular band and line blends (more details on the nature of the correction is provided in Section 11.3.7). If the star is not a candidate carbon star (spectral type tag equal to “CSTAR”), the second classifier is applied to identify the spectra belonging to Wolf-Rayet stars and planetary nebula. All other spectra are labelled “unknown”. Spectra of “unknown” nature are then checked for H emission. If significant emission is present (Section 11.3.7), a last classifier is applied to identify Be, Herbig Ae/Be, T Tauri and dwarf active stars.
H pseudo-equivalent width:
Because the resolving power is rapidly decreasing with wavelength, we only consider the H wavelength domain located at the very blue edge of the RP passband, where the spectral resolution of the BP/RP at 656.5 nm is about 8 nm, and the typical width of a wavelength sample is of 2.5 nm. In stars with strong emission (T-Tauri, Herbig Ae Be, Be stars), the blue wing of the emission-line is therefore expected to be affected by the steep decrease of the transmittance of the RP passband and by the wavelength cuts applied.
On the other hand, while in A-, B-, and O-type stars the domain occupied by H is relatively preserved from any contamination by other spectral features, in cooler stars the photospheric component (in absorption) of the H tends to disappear and numerous other spectral lines or molecular bands show up.
As a consequence of all these issues, equivalent widths can only be computed relative to a local pseudo-continuum, while the H domain may contain features from species other than hydrogen. To make the measurement as robust as possible, we converged to a simplified definition of the H equivalent width: The flux at 646 and 670 nm (i.e. at both sides of 656.5 nm) is chosen to draw a linear pseudo-continuum, then the (1. normalized flux) of the samples that fall in between is summed up. Because the resulting measurement may contain information from other spectroscopic features and that the 2 samples used to draw the continuum could fall in the H line or in any other absorption/emission dip or peak, the measurement of the equivalent width provided by the ESP-ELS has to be considered as a pseudo-equivalent width (pEW, ie. ew_espels_halpha) that needs a careful interpretation.
To try to compensate for the existence of blends with species other than hydrogen in the cooler stars, we subtracted the equivalent width measured on the nearest (in terms of GSP-Phot APs) synthetic spectrum below 5000 K (ie. ew_espels_halpha_model). The decision on whether significant H emission can be seen in the spectrum is made by adopting the corrected value:
| (11.28) |
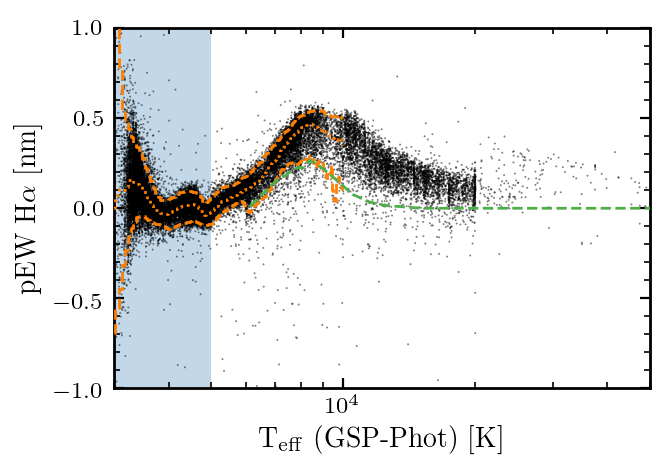
For stars cooler than 6000 K, the H emission threshold is defined by the lower limit of the locus (i.e. orange broken lines in Figure 11.38) of 95% of targets with no expected emission (according to the Simbad database). For the hotter stars, this threshold is given by the lower limit of the measurements made on the synthetic spectra (i.e. green broken line in Figure 11.38). In addition, we further took a 3-sigma significance level into account when confronting the H pEW to the threshold.
Training samples
Three random forest classifiers are used to process the data, and provide information to the ESP-HS upstream module. The three classifiers are trained on data of different nature (i.e. synthetic or/and observed) and prepared differently as described in what follows.
Spectral type tagger:
The spectral type tagging is based on the analysis of XP spectra extending from 340 to 600 nm and from 640 to 850 nm for BP and RP, respectively. All spectra were normalized to the flux integrated in each band, while the colour indices and were added to the training data. The training data we considered were the random and nominal MARCS, OB, A, BTSETTL synthetic spectra (Section 11.2.3), completed by a limited sample of observed BP/RP spectra of Galactic carbon stars (Abia et al. 2020).
WR and PNe classifier:
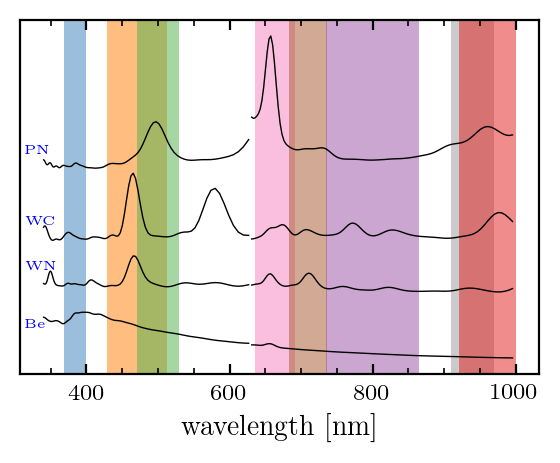
The classification is based on selected BP/RP wavelength domains normalised at the edges, as well as on the astrophysical parameters (i.e. , , and ; provided by GSP-Phot for the observed spectra). The wavelength ranges were selected following the line features generally expected to be in emission in various classes of ELS (Figure 11.39). The data used for the training were the random and nominal MARCS, OB, A, BTSETTL synthetic spectra, observed BP/RP spectra of Be, Herbig Ae/Be, T Tauri, and dMe stars (i.e. as a representation of targets which are not Wolf-Rayet nor planetary nebulae), and observed BP/RP spectra of WC, WN, and PNe. While all synthetic spectra have been used, the observed data of targets with known stellar classification have been carefully inspected to retain those spectra with striking and non dubious emission features only. The number of targets finally considered is given in Table 11.30.
| Class | Nb. | References |
| Be stars | 759 | Simbad (Wenger et al. 2000) |
| Herbig Ae/Be stars | 128 | Vioque et al. (2018) |
| T Tauri stars | 161 | Simbad (Wenger et al. 2000) |
| active M dwarf stars | 67 | Newton et al. (2017) |
| WC stars | 81 | Crowther, 2020 |
| WN stars | 127 | Crowther, 2020 |
| PN | 126 | Simbad (Wenger et al. 2000) |
Be, Herbig Ae/Be, T Tauri, dMe classifier:
The classifier was trained on the same features as in Figure 11.39, but this time only extracted from observed BP/RP spectra of the reference Be, Herbig Ae/Be, T Tauri, and active M dwarf stars (Table 11.30). We further add the astrophysical parameters derived by GSP-Phot during the processing (i.e. with no filter nor correction applied) to the spectroscopic information.
Scope
Results are usually provided for stars brighter than magnitude G=17.65, with BP and RP spectra obtained over more than 10 transits, and of sufficient quality. No ELS class label is stored when no significant emission features were found.
Results
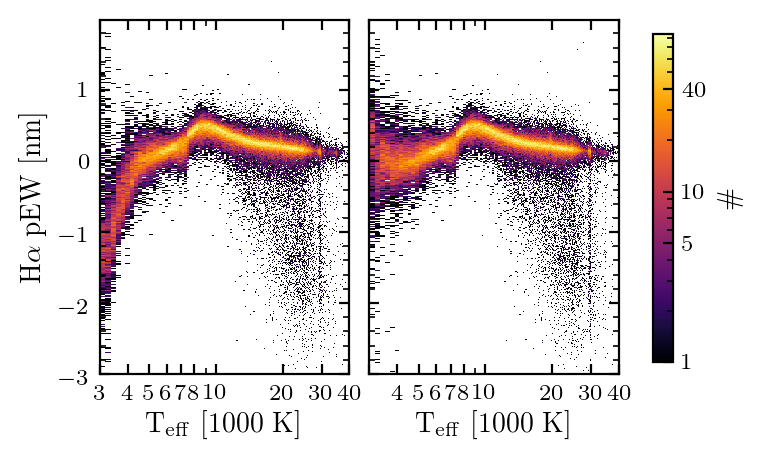
As described in Section 11.3.7, in an attempt to correct for the multiple line and molecular band blends in the H wavelength domain, an estimate of the H pEW was computed on the BP/RP spectrum simulator (Section 11.2.3) and subtracted from the observed value at 5000 K. The effect of the correction is shown in Figure 11.40. In the left panel, the presence of line and molecular band blends in cooler stars leads to significantly negative estimates even in the absence of H emission. Globally, the correction introduced below 5000 K allows to move their non-ELS stars to the expected location in the diagram (right panel).
As expected from the various constraints, the comparison of the H pEW derived by ESP-ELS with the estimates found in the literature usually implies that the pseudo-equivalent width is smaller than the true equivalent width of H (see corresponding figure in Fouesneau et al. 2023, which shows a comparison with estimates from the literature, as well an estimate of the underestimation). It also shows that the difficulty in interpretring the H pEW measured on BP/RP remains for the coolest stars (see the dwarf M stars in the upper left panel of same figure in Fouesneau et al., 2023).
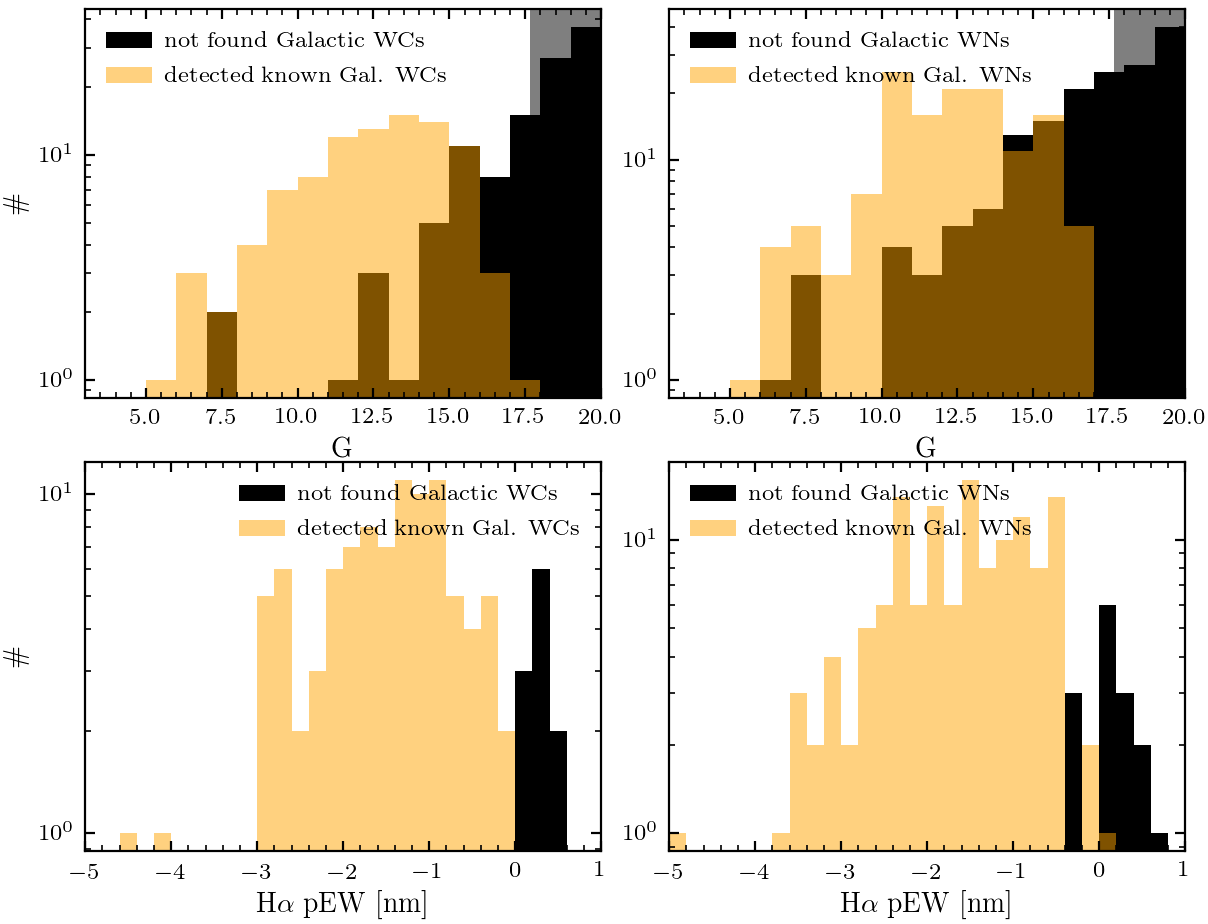
In the ESP-ELS workflow, candidate Wolf-Rayet (WC & WN) stars and planetary nebula are first identified. Amongst the 136 WC stars detected, 127 have a classlabel_espels_flag 2 (i.e. probability 0.5). By visually inspecting the BP/RP data, all but 5 candidates have spectra which are typical of WC stars. From the WC stars with unambiguous classification in the catalogue of Crowther, 181 were not identified. Their magnitude distribution is shown in Figure 11.41 (upper left). Only 39 have magnitudes lower than 17.65 and could have been processed by the module. Among these, 27 have no finite pEW H value, which usually implies issues with the data. The H pEW distribution of the remaining targets is shown in Figure 11.41 (lower left) and compared to the one of the detected WCs. Targets that were not classified WC usually have weaker emission and have spectral types WC8 or WC9.
The number of WN stars indentified is 431, 200 of them (after visual inspection) do not show significant features seen in WN stars. On the other hand, 240 known Galactic WN stars with unambiguous classification from the catalogue of Crowther are not part of the ESP-ELS sample. Their magnitude distribution is shown in Figure 11.41 (upper right): 90 have magnitudes brighter than 17.65 and could have been processed by the module; 75 do not have any finite pEW H measurement which usually implies issues with the input data. The H pEW distribution of the remaining targets is shown in Figure 11.41 (lower right) and compared to the one of the detected WNs. Targets that were not classified WN and that have an H measurement usually have weaker emission.
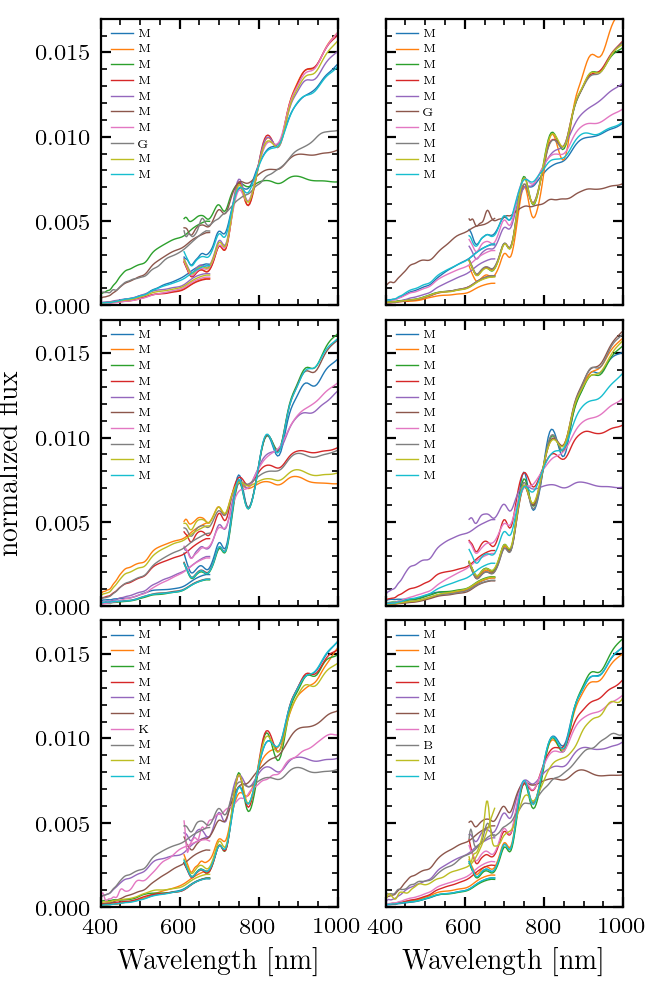
The next step in the module workflow is to identify the ELS classes for which H is the main emission feature in BP/RP. A conservative H emission detection threshold was adopted in the modules. We estimate that the fraction of detected Be, Herbig Ae/Be, T Tauri, and active dwarf M stars is 0.5, 0.3, 0.05, and 0.001 , respectively. On the other hand, the module uses the astrophysical parameters provided by GSP-Phot before post-processing to (1) correct the H pEW of cooler stars, (2) classify the ELS. In a fraction of extreme cases, these APs might be inaccurate and may have produced an incorrect H pEW. Therefore a fraction of the candidate T Tauri (especially among the cooler targets) or dwarf M stars may have been wrongly classified ELS, but, as a general rule, we decided to keep all the results obtained by the module. A cross-match between the ESP-ELS class label and GSP-Phot’s parameters may help the user to identify the most dubious cases. For example, for 26 389 of the 33 946 candidate T Tauri stars the GSP-Phot parameters where filtered out during post-processing and therefore these are not available in Gaia DR3. Furthermore, after random visual inspection, we find 1123 targets with APs not filtered out during post-processing and estimates larger than 7500 K, but whose BP/RP spectrum shows molecular bands, typical of cooler stars (Figure 11.42). This issue may have to be related with the “extreme” nature of those objects or to AP degeneracy issues, and future ELS classification attempts (e.g. Gaia DR4) should take it into account.
Uses and limitations
The H pEW can be used to detect new ELS by adopting different threshold values, while the correction stored in ew_espels_halpha_model can be used to remove the correction applied to the measurement or to apply it also to the hotter stars.