11.3.9 Extended Stellar Parametrizer - Cool Stars (ESP-CS)
Author(s): Alessandro Lanzafame, Elisa Brugaletta
Goals
In Gaia DR3, the Extended Stellar Parametrizer - Cool Stars, ESP-CS, infers a chromospheric activity index from the analysis of the Ca II IRT (calcium infrared triplet) in the RVS spectra.
Inputs
ESP-CS takes the RVS average continuum normalised spectra in the stellar rest-frame as input (see Section 11.2.4). Knowledge of the atmospheric parameters (, , ) is required, which are taken from the output of either GSP-Spec or GSP-Phot. In Gaia DR3, (, , ) computed by GSP-Spec are used if the complete triad is available, otherwise the full triad computed by GSP-Phot is used if available. The projected rotational velocity, vbroad, provided by CU6 is also used (see Section 11.3.9).
Method
The activity index is derived by comparing the observed RVS spectrum with a radiative equilibrium model spectrum. An excess equivalent width factor in the core of the Ca II IRT lines, computed on the observed-to-template ratio spectrum, is taken as an index of the stellar chromospheric activity or, in more extreme cases, of the mass accretion rate in pre-main sequence stars (see Section 11.3.9).
The radiative equilibrium model spectrum is obtained by interpolating over a grid of MARCS synthetic spectra, assuming that the main stellar parameters (, , ) are known. In Gaia DR3 these are input parameters from either GSP-Spec or GSP-Phot. Rotational broadening is taken into account whenever vbroad is available from the CU6 analysis. The interpolated rotationally broadened synthetic spectrum is taken as template spectrum.
Given the template spectrum, the observed spectrum is first re-normalised by multiplying it by a second order Chebyshev polynomial, whose coefficients are determined by minimising the pixel-to-pixel average deviation. Then the observed-to-template ratio spectrum is calculated on a common wavelength grid at the stellar rest frame. The ratio spectrum is integrated on a interval around the core of each of the triplet lines and the mean of the 3 values obtained is taken as activity index. Formally, the activity index () is defined as
| (11.30) |
where and are the observed and the template spectrum, respectively. Uncertainties are evaluated by propagating the pixel standard error, ignoring theoretical uncertainties.
Outputs
In Gaia DR3, ESP-CS provides the activityindex_espcs as defined by Equation 11.30 and its uncertainty (i.e. activityindex_espcs_uncertainty), both in nm units. A flag indicating the input source of the astrophysical parameters used is also provided, activityindex_espcs_input. This is either ”M1” for GSP-Spec, or ”M2” for GSP-Phot. The ESP-CS results are available in the astrophysical_parameters table.
Scope
ESP-CS has processed stars with , in the range (3000 K, 7000 K), in the (3.0, 5.0) range, and in the (-0.5, 1.0) range. The activity index has been estimated on a total of approximately 2M stars.
Results
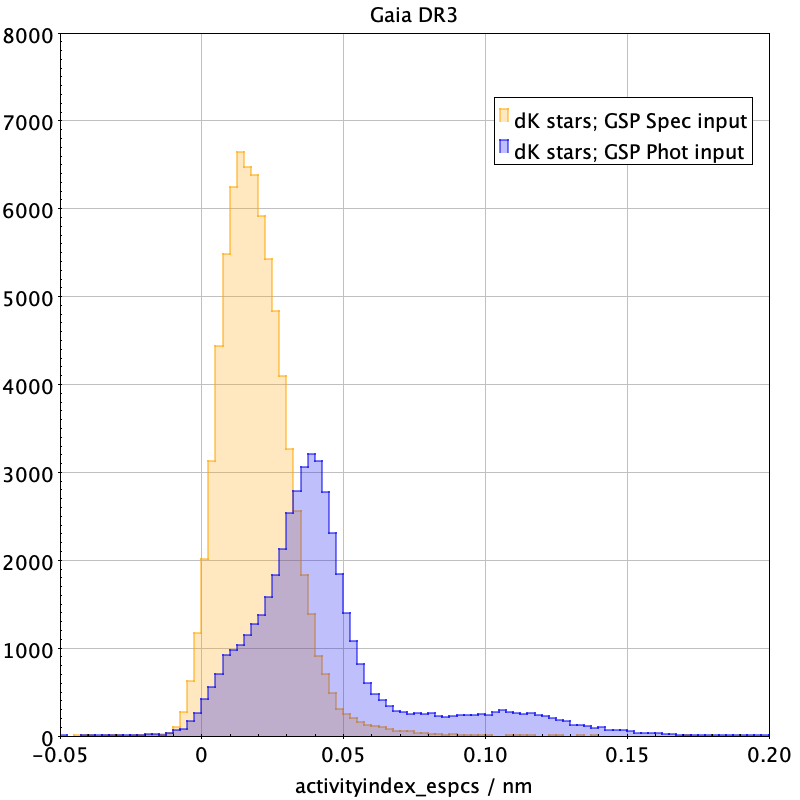
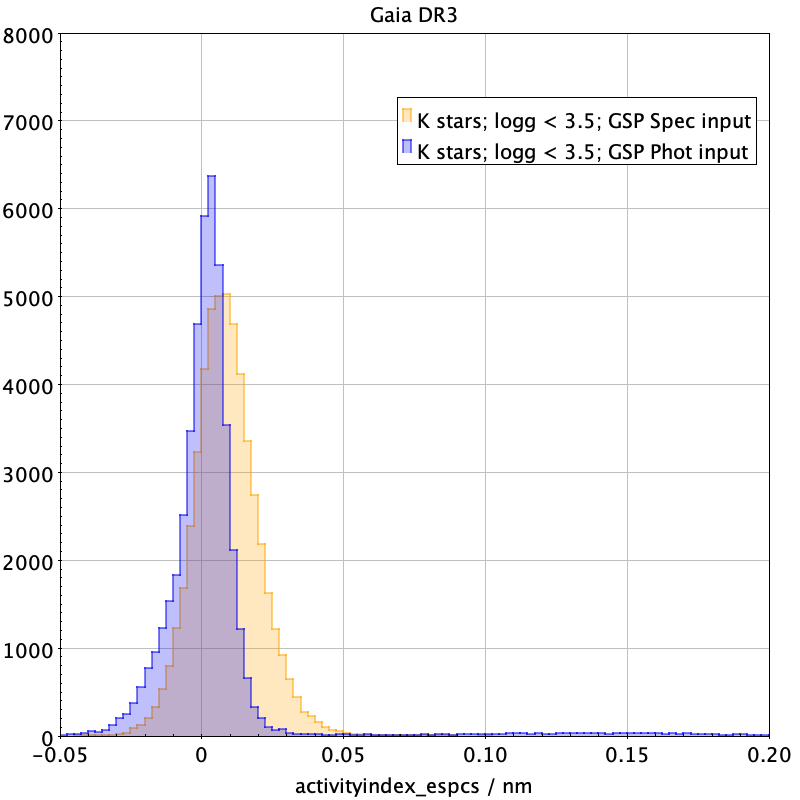
The activity index evaluated in Gaia DR3 has a range (-0.1, 1.0). As an example, Figure 11.44 reports the activity index distribution for stars with input in the range (4000 K, 5000 K). Negative values are physically expected because in low activity stars the chromosphere causes a deeper line absorption than the radiative equilibrium expectation; uncertainties in the astrophysical parameters can also cause negative values of the activity index. Values above 0.03 – 0.05 nm are likely due to mass accretion luminosity. Nominal uncertainties take the pixel noise into account and are 0.001 nm on average.
The activity index for stars with in the range (4000 K, 5000 K) and the lowest in the sample () has standard deviation of 0.015 and 0.022 nm in the case of GSP-Spec and GSP-Phot input, respectively. Since these stars are expected to be the less active in the sample, such standard deviations can be taken as upper limits of the true dispersion of the sample. The average activity index for this sample is 0.001 and 0.008 nm for the GSP-Phot and GSP-Spec input, respectively, that give upper limits to the true bias.
Astrophysical parameters for rapidly rotating and emission line stars are generally not provided by GSP-Spec, in which case the GSP-Phot parameters are used as input. Since these are also the most active stars, the distribution with GSP-Phot input is peaked and extended to larger values than the distribution of the activity index with GSP-Spec input.


Use
The excess equivalent width factor is related to the excess equivalent width
| (11.31) |
with the flux in the continuum, by the relation:
| (11.32) |
where is the expected line-to-continuum average flux ratio in the core ( nm from central ) of the Ca II IRT lines in radiative equilibrium. Similarly, the activity flux, being either chromospheric activity or accretion flux, can be obtained by the relation:
| (11.33) |
where is the expected average flux in the core of the Ca II IRT lines in radiative equilibrium.
The following inconsistencies are known.
(1) ESP-CS processed the mean value of GSP-Spec output. However, this mean value was updated to the median during the GSP-Spec post-processing.
This inconsistency affects the APs boundaries of the ESP-CS sample, with some star that should have been included in the analysis not being considered and vice-versa.
This could also affect a few outliers, but overall results should not be affected.
(2) After post-processing for some sources the activity index has been filtered out and set to null value, but, due to a mapping issue, for these sources the activityindex_espcs_input is still present. This is essentially an aesthetic issue and it is not going to have any impact on the scientific results or their exploitation at all.