11.3.10 Extended Stellar Parametrizer - UltraCool Dwarfs (ESP-UCD)
Author(s): Luis M. Sarro
Goals
The purpose of ESP-UCD is to identify Ultracool Dwarfs and produce estimates of their effective temperatures based on their RP spectra. Ultracool Dwarfs are defined as sources with spectral type M7 or later (Kirkpatrick et al. 1997). This definition includes the coolest stars and brown dwarfs. Brown dwarfs are characterized by masses below 0.072 (depending on the specific models and the metallicity; see, for instance, Baraffe et al. 2015), and very low temperatures and luminosities, which depend strongly on the age (being significantly brighter and warmer at young ages). As shown further below, the set of UCDs identified by Gaia includes both Main Sequence and pre-Main Sequence sources in star forming regions and clusters of different ages. UCDs represent a bridge between the properties of the coolest stellar object and those of planets and, being brighter than the latter, provide useful clues and insights into the formation mechanisms and the resulting atmospheric chemistry prevailing in the faint end of the Hertzsprung-Russel diagram. Since ESP-UCD predicts effective temperatures and not spectral types, we adopt the alternative definition of Ultracool Dwarfs (hereafter UCDs) as sources with effective temperatures cooler than 2500 K. The equivalence between both definitions depends on the adopted conversion law between spectral types and effective temperatures.
Inputs
The inputs to the ESP-UCD module are fields in the Gaia source table (the field names are links to the data model):
-
•
parallax, parallax
-
•
band magnitude, phot_g_mean_mag
-
•
RP band magnitude, phot_rp_mean_mag
-
•
the continuous representation of internally calibrated BP/RP spectra in terms of coefficients.
Given the faintness of the UCD sources, the ESP-UCD module introduces a coefficient truncation stage in the reconstruction of the sampled mean RP spectrum from the continuous representation coefficients (see Section 11.3.1 for details). The truncation stage reduces the number of basis functions used in the reconstruction of the spectrum by setting to zero coefficients that are not significantly larger than their uncertainties. Details about the truncation procedure can be found in Carrasco et al. (2021). We use =3 where is the threshold coefficient in Equation 27 of Carrasco et al. (2021). After this coefficient truncation step, the reconstruction is carried out in the same way as described in Section 11.3.1 and using the same design matrix . This truncation procedure was introduced after (and based on) tests that showed an improved prediction accuracy on the Gaia UltraCool Dwarf Sample (Smart et al. 2017, 2019, hereafter GUCDS). The resulting RP spectrum contains the fluxes in each of the 120 pixels described in Section 11.3.1.
Finally, since the RP spectrum contains in its pixels integrated fluxes (referred to here as ) and not flux densities, the 120 integrated fluxes can be normalised as via simple summation
| (11.34) |
Outputs
The effective temperature is stored in the field teff_espucd The uncertainty in the prediction is stored in the field teff_espucd_uncertainty.
The module also produces a two-digits field flags_espucd that contains information on the quality of the estimates.
-
1.
The first digit is used to encode the quality of the data in one of three categories based on (i) the Euclidean distance between a given RP spectrum and the closest template in the training set and (ii) the ratio between the uncertainty in the integrated RP flux and the flux itself. Quality 0 in this first digit of the flag is assigned to the best RP spectra defined as those having ; quality 1 is assigned to sources with and relative uncertainties ; finally quality flag 2 is assigned to sources with and .
-
2.
The second digit in flags_espucd is used to identify sources with estimates inconsistent with their absolute magnitudes. Quality 0 sources were used to define median effective temperatures in bins of absolute magnitudes calculated with the reciprocal of the parallax. Sources deviating by more than 400 K from these medians are tagged with 1 in the second digit of flags_espucd. All others are tagged with 0. This inconsistency may be an indication of non-UCD sources affected by significant amounts of extinction and reddening or to noise excursion in the parallax measurements. Visual inspection of the RP spectra shows a mixture of clear UCDs and spectra with the same flux distribution on large wavelength scales as that of UCDs but with very shallow spectral features. The nature of these sources could not be firmly established on the basis of Gaia data alone.
Methods
The ESP-UCD predictions are produced by a Gaussian Process model (Rasmussen and Williams 2006) trained on a set of RP spectra of selected sources. The training set was composed of a set of 41 spectral type standards from the GUCDS and a preliminary list of visually inspected RP spectra down to magnitude =19. The effective temperatures assigned to the training examples outside the GUCDS were defined using a Diffusion Map (Coifman and Lafon 2006) and calibrating the Diffusion Map coordinates in temperature using the 41 spectral type standards and the conversion from spectral types to effective temperatures from Stephens et al. (2009).
The effective temperatures obtained from the Gaussian Process were found to be overestimated in the hotter regime (as compared to predictions from a module trained on BT Settl (Allard et al. 2013) examples and spectral types from SDSS targets). These estimates were corrected according to the following update equation:
| (11.35) |
where K, K, K and
| (11.36) |
The Gaussian Process model provides uncertainties for the effective temperature estimates but these were found to be gross underestimates (of the order of a few Kelvins). The uncertainties stored in teff_espucd_uncertainty were originally calculated by generating ten random samples of the RP spectrum using the flux uncertainties and calculating the standard deviation of the predictions produced by the Gaussian Process model. These uncertainties still were evident underestimates as judged by the comparison with typical prediction errors for GUCDS sources of all signal-to-noise ratios. We explain this systematic underestimation of the uncertainties as due to the absence of off-diagonal terms in the RP spectrum covariance matrix that is the source of the flux uncertainties (see Section 11.3.1). Finally, these latter values were multiplied by a factor of 7 derived from the comparison with predictions for GUCDS sources.
Scope
Unlike other modules in Apsis, the ESP-UCD module is run on sources with unrestricted magnitudes. This is because UCDs occupy the faint end of the Main Sequence and are thus expected to be detectable only in the closest vicinity of the Sun and with dim magnitudes. Without other filters this would imply too demanding processing requirements. The filters that define the set of sources processed by the ESP-UCD module are described below. In the following, , and represent the pixel indices at which the 33.33, 50 and 66.67 percentiles of the total flux in the RP spectrum are attained. With this definition, the filters that define the set of sources processed by ESP-UCD are:
-
•
Parallax mas
-
•
Colour index mag
-
•
-
•
-
•
The parallax cut is based on the properties of the brightest UCD ( = 2500 K; = 3.5) in the BT Settl library (Allard et al. 2013) at =21. The colour index and percentile cuts are based on the properties of the GUCDS. Safety margins are added to allow for UCDs extending beyond the properties of known UCDs in previous Gaia Data Releases.
During postprocessing additional filters were imposed which removed ESP-UCD results for sources that fulfilled the following criteria:
-
•
(sources outside the quality criteria defined above);
-
•
the number of transits used to construct the RP spectrum was less than 15;
-
•
estimates outside the K range;
-
•
the normalized RP spectrum median curvature ;
-
•
the sum of normalized RP spectrum fluxes below the zero flux level is smaller than -0.1;
-
•
the reddest flux corresponding to the 120-th pixel of the (normalized) RP spectrum is greater than or equal to 0.015.
-
•
sources with
where the median curvature is calculated as follows. First, the numeric approximation to the first and second order derivatives of the fluxes are calculated as
| (11.37) |
and
| (11.38) |
with appropriate simplifications at the boundaries. With these definitions, is defined as the median of the 120 second order derivatives.
Results
The ESP-UCD module produced estimates for UCD candidates. Figure 11.45 shows colour-absolute magnitude diagrams (CAMDs) of the three quality classes defined by ESP-UCD. Absolute magnitudes are estimated for illustration purposes using the naive inversion of the parallax and assuming negligible extinction. The colour code reflects the module effective temperature estimate. It shows a relative consistency between the position of each source in this diagram and the effective temperature inferred by the module based solely on the RP spectrum. The consistency and scatter increases as expected from class 0 objects to class 1. However, increasing distance from the nearest template (a key ingredient in the definition of the quality flag) does not imply necessarily a poorer quality of the RP spectrum if the empirical training set is not complete, as is the case.
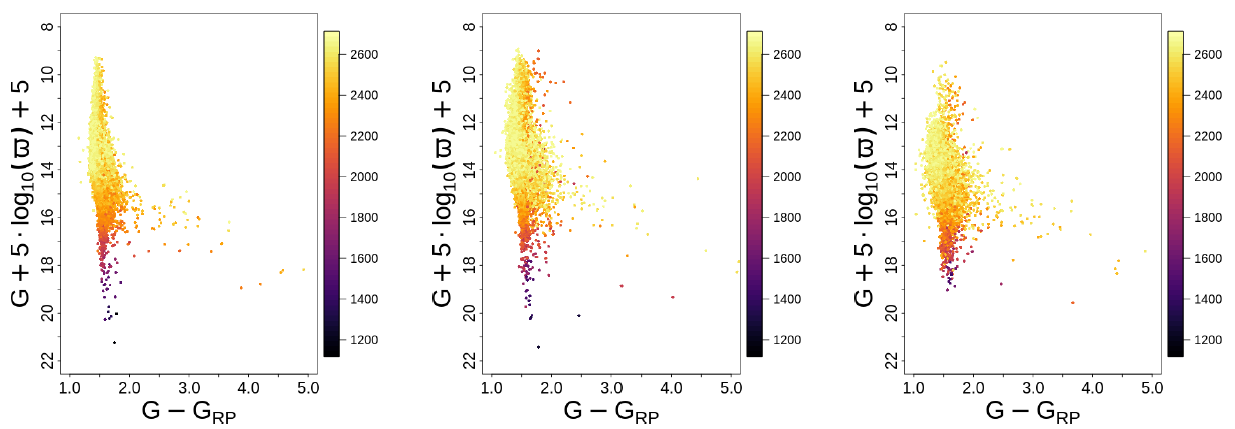
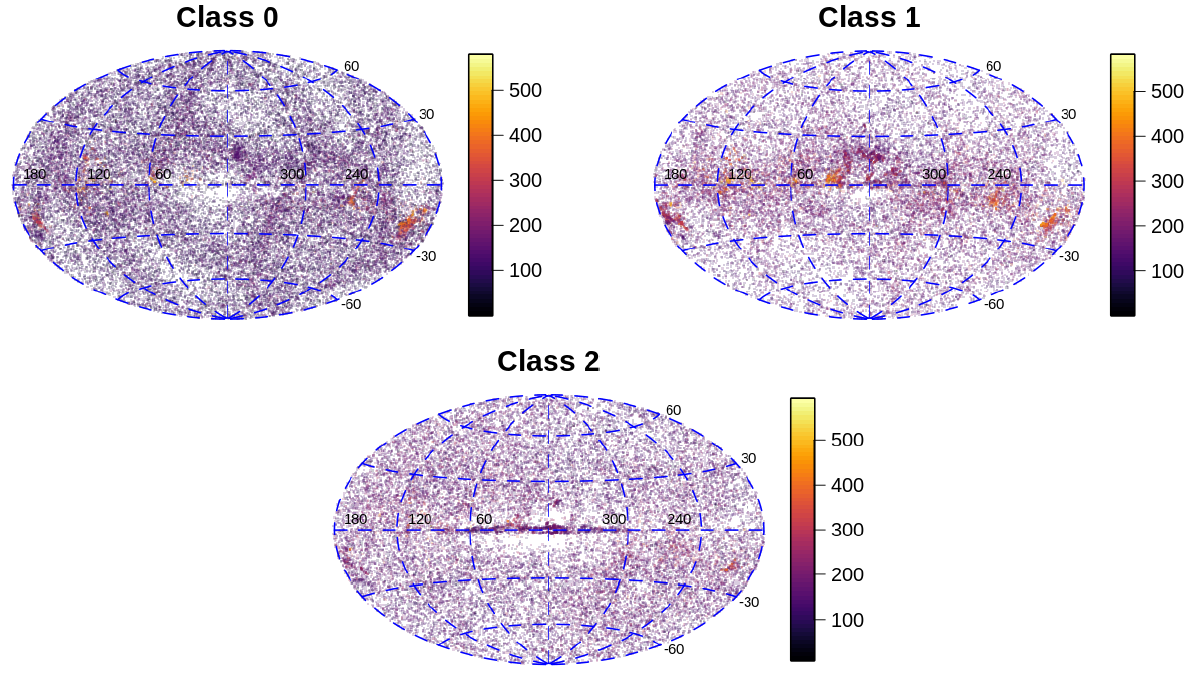
Figure 11.46 shows the distribution of sources in the celestial sphere in Galactic coordinates. The colour code reflects the reciprocal of the parallax in units of arcsec. Each quality class shows a different pattern of overdensities some of which can easily be identified with well known star forming regions and clusters.
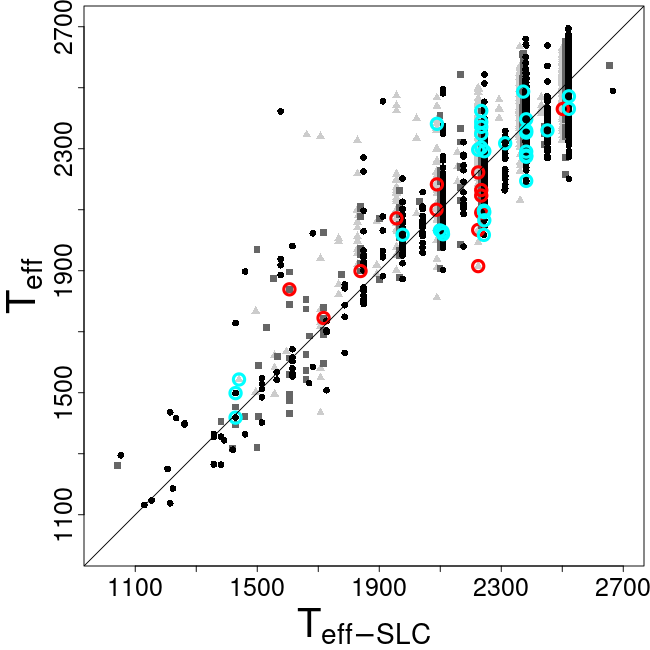
We have checked the overlap between existing samples of UCDs observed by Gaia and the set of UCDs detected by the ESP-UCD module. There are 3491 sources of the last version of the GUCDS with spectral type later than or equal to M8 ( 2512 K according to Stephens et al. 2009) in the Gaia archive, 3004 of them with the Gaia measurements needed for selection (see Section 11.3.10 above) available at the moment of processing. Of these 3004 sources, 2620 are in the ESP-UCD catalog. 24 of the 384 missing sources fail one or several of the selection criteria (again, see Section 11.3.10 above). The remaining 360 GUCDS sources missing from the ESP-UCD catalog failed either the or the astrometric quality criteria. Figure 11.47 shows a comparison between the effective temperatures estimated by the ESP-UCD module and those estimated from the GUCDS spectral types via the calibration by Stephens et al. (2009). The scatter in Figure 11.47 includes the internal spread of temperatures within each spectral types and potential errors in the spectral type assignments. It amounts to a root-mean-square error (RMSE) of 103 K (median absolute deviation MAD of 88 K). For quality class 0 defined above the RMSE/MAD is 92/82 K; for quality class 1, 111/95 K and for quality class 2, 129/90 K. Also, there are 12 656 of the 14 916 UCD candidates in Reylé (2018) that pass all the publication criteria listed above. 14 051 of them fulfilled the selection criteria and were processed by the module. The 1395 sources missing are characterised by and/or have effective temperature predictions above 2700 K.
Use
The definition of any sample that is the product of some sort of classification (in this case the detection of UCDs) involves inevitably finding a trade-off between completeness and contamination. In this case we have preferred to define liberally the selection boundary. This implies that the sample can be further cleaned from contaminants (for example, non-dwarf sources that appear to be so due to reddening and/or parallax measurement errors) using complementing non-Gaia measurements. This is apparent in the overdensity found near the Galactic centre/disk for Class 2 objects. These potentially spurious sources could have been removed with more strict astrometric quality cuts that would have also removed known UCDs from the sample. Again, the quality cuts applied were liberal and the archive user is advised to be critical especially for sources in Class 2. Given a discrepancy between the simulated RP spectra based on BT Settl synthetic spectra and the Gaia observations for some spectral types, we have not been able to construct a training set that covers all possible surface gravities or metallicities. Hence, sources that deviate significantly from the mean metallicities and surface gravities of the training set examples may have erroneous temperature estimates. Since we excluded from the training set known subdwarfs and young sources we can consider it representative of solar metallicities and surface gravities dex (see e.g. Allard et al. 2013).
We have not found a clear relationship between the temperature estimate error found for sources in the GUCDS and the uncertainties estimated by the module. The correction factor described above (a multiplicative factor of 7) is derived from an average of the errors incurred by the module for the GUCDS. Since the GUCDS is not representative in any sense of the sample of astrophysical parameters produced by the ESP-UCD module, their uncertainties cannot be taken as representative of the true errors.