11.4.7 Groups of stars
Author(s): Ulrike Heiter, Antonella Vallenari
Unresolved binaries
Author(s): Ulrike Heiter
In this section we compare products of different Apsis modules derived for unresolved binary stars.
The selection of comparison samples for cross-module validation was based on stars drawn from external catalogues. Below we use these samples to compare some of the products from the modules MSC (Section 11.3.5), GSP-Phot (Section 11.3.3), and GSP-Spec (Section 11.3.4).
Section 11.4.1 presents the main conclusions that can be drawn from the comparisons. The general conclusion is that for known binaries MSC provides reasonable values of and for the individual components, while the (system) metallicities seem to be overestimated compared to GSP-Phot and GSP-Spec, at least for systems with sub-solar metallicity.
Two external catalogues of known binary stars were used to generate the samples for the comparisons:
-
•
A literature compilation mainly consisting of APOGEE dwarfs from El-Badry et al. (2018), hereafter ’APOGEE sample’. The ratio of the -band fluxes was calculated by Jan Rybizki from the atmospheric parameters of the components using PARSEC isochrones. This catalogue contains 2869 entries, of which 2598 have a non-NaN value for the flux ratio, and 1867 have a flux ratio from 1 to 5, which is the validity range of MSC.
-
•
A binary catalogue including parameters for individual components, metallicity, reddening and also the flux ratio based on GALAH and Gaia data (Traven et al. 2020a, hereafter ’GALAH sample’). The flux ratio values were taken from the ratio1-50 parameter published by Traven et al. (2020a). This catalogue consists of 12760 sources, of which 11325 have a flux ratio between 1 and 5.
About 2.4 million sources with parameters from MSC, GSP-Phot, and GSP-Spec were cross-matched with the two catalogues of binaries, resulting in 839 and 2504 unique sources for the APOGEE and GALAH samples, respectively, of which 532 and 2362 had a flux ratio from 1 to 5. In the case of GSP-Phot the parameters based on both the MARCS and PHOENIX libraries were used separately. These are found in the table astrophysical_parameters_supp. In the case of GSP-Spec the parameters are those based on the MatisseGauguin algorithm, found in the table astrophysical_parameters.
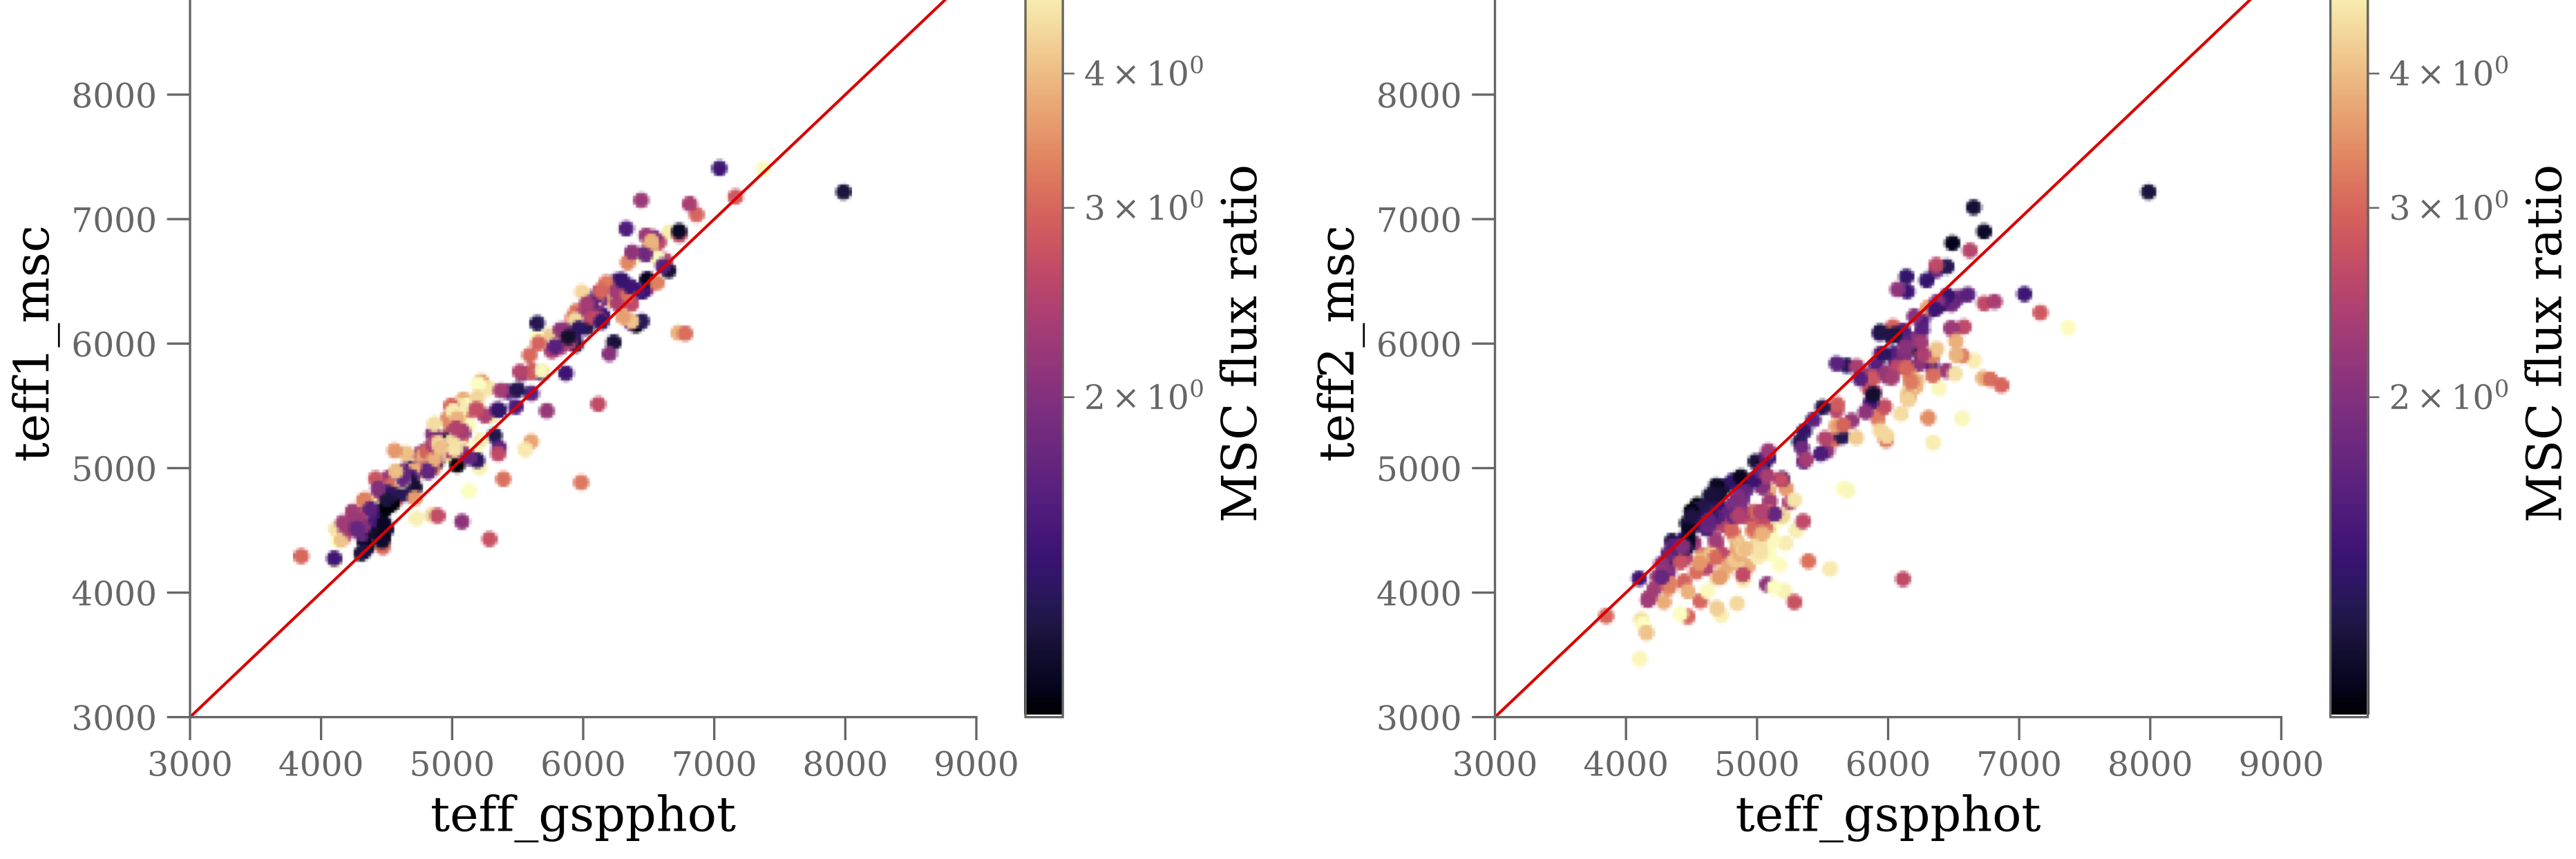
The comparison of from MSC and from GSP-Phot is shown in Figure 11.89 for the APOGEE sub-sample with flux ratio from 1 to 5, which is the valid range of MSC, and using the MARCS results from GSP-Phot. The comparisons for the APOGEE sample with any flux ratio and for the PHOENIX results from GSP-Phot show very similar features, and this is also the case for all other comparison diagrams. Therefore all figures of this section are shown for the sub-samples with flux ratio from 1 to 5 and for the GSP-Phot-MARCS results only. The figures are colour-coded by the flux ratio calculated by MSC for each source and used internally in the data processing. This parameter is not published in the Gaia DR3 archive.
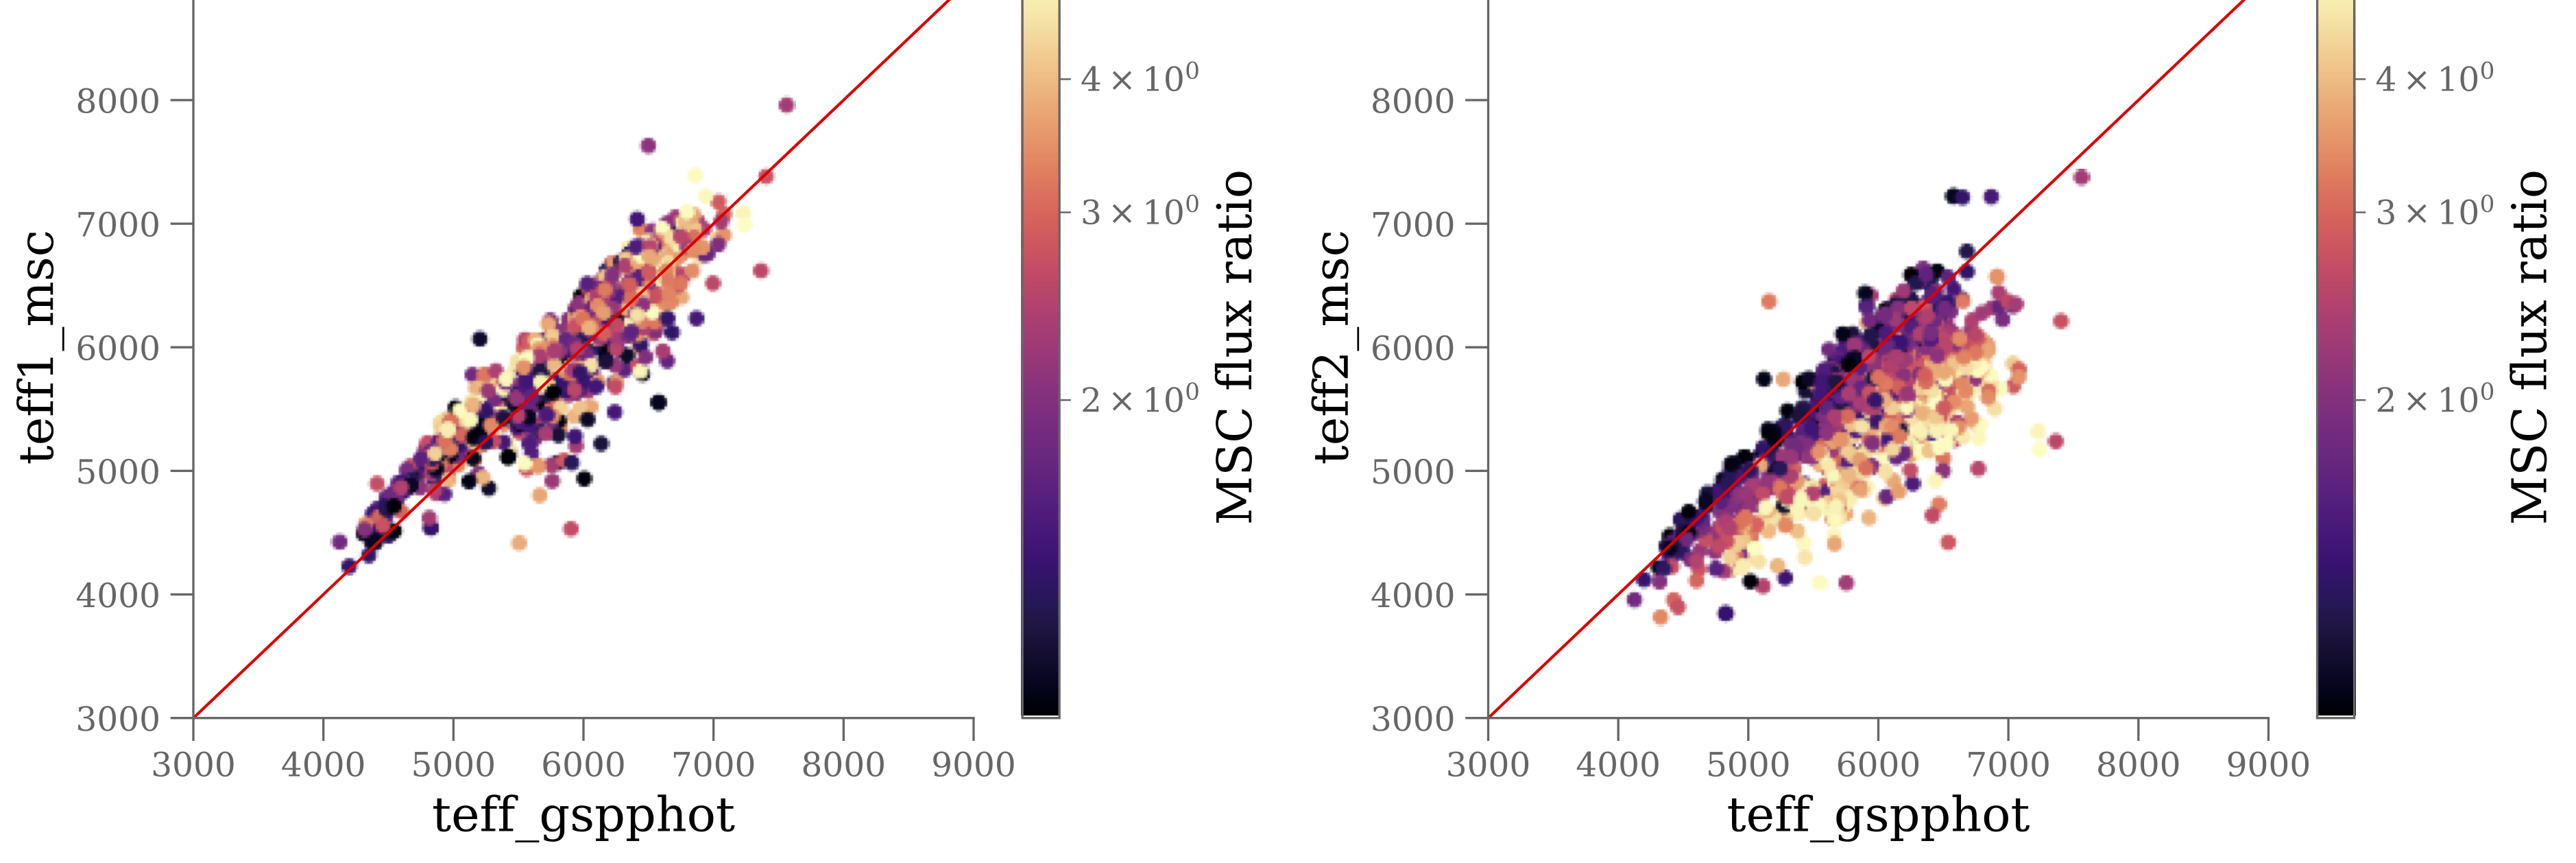
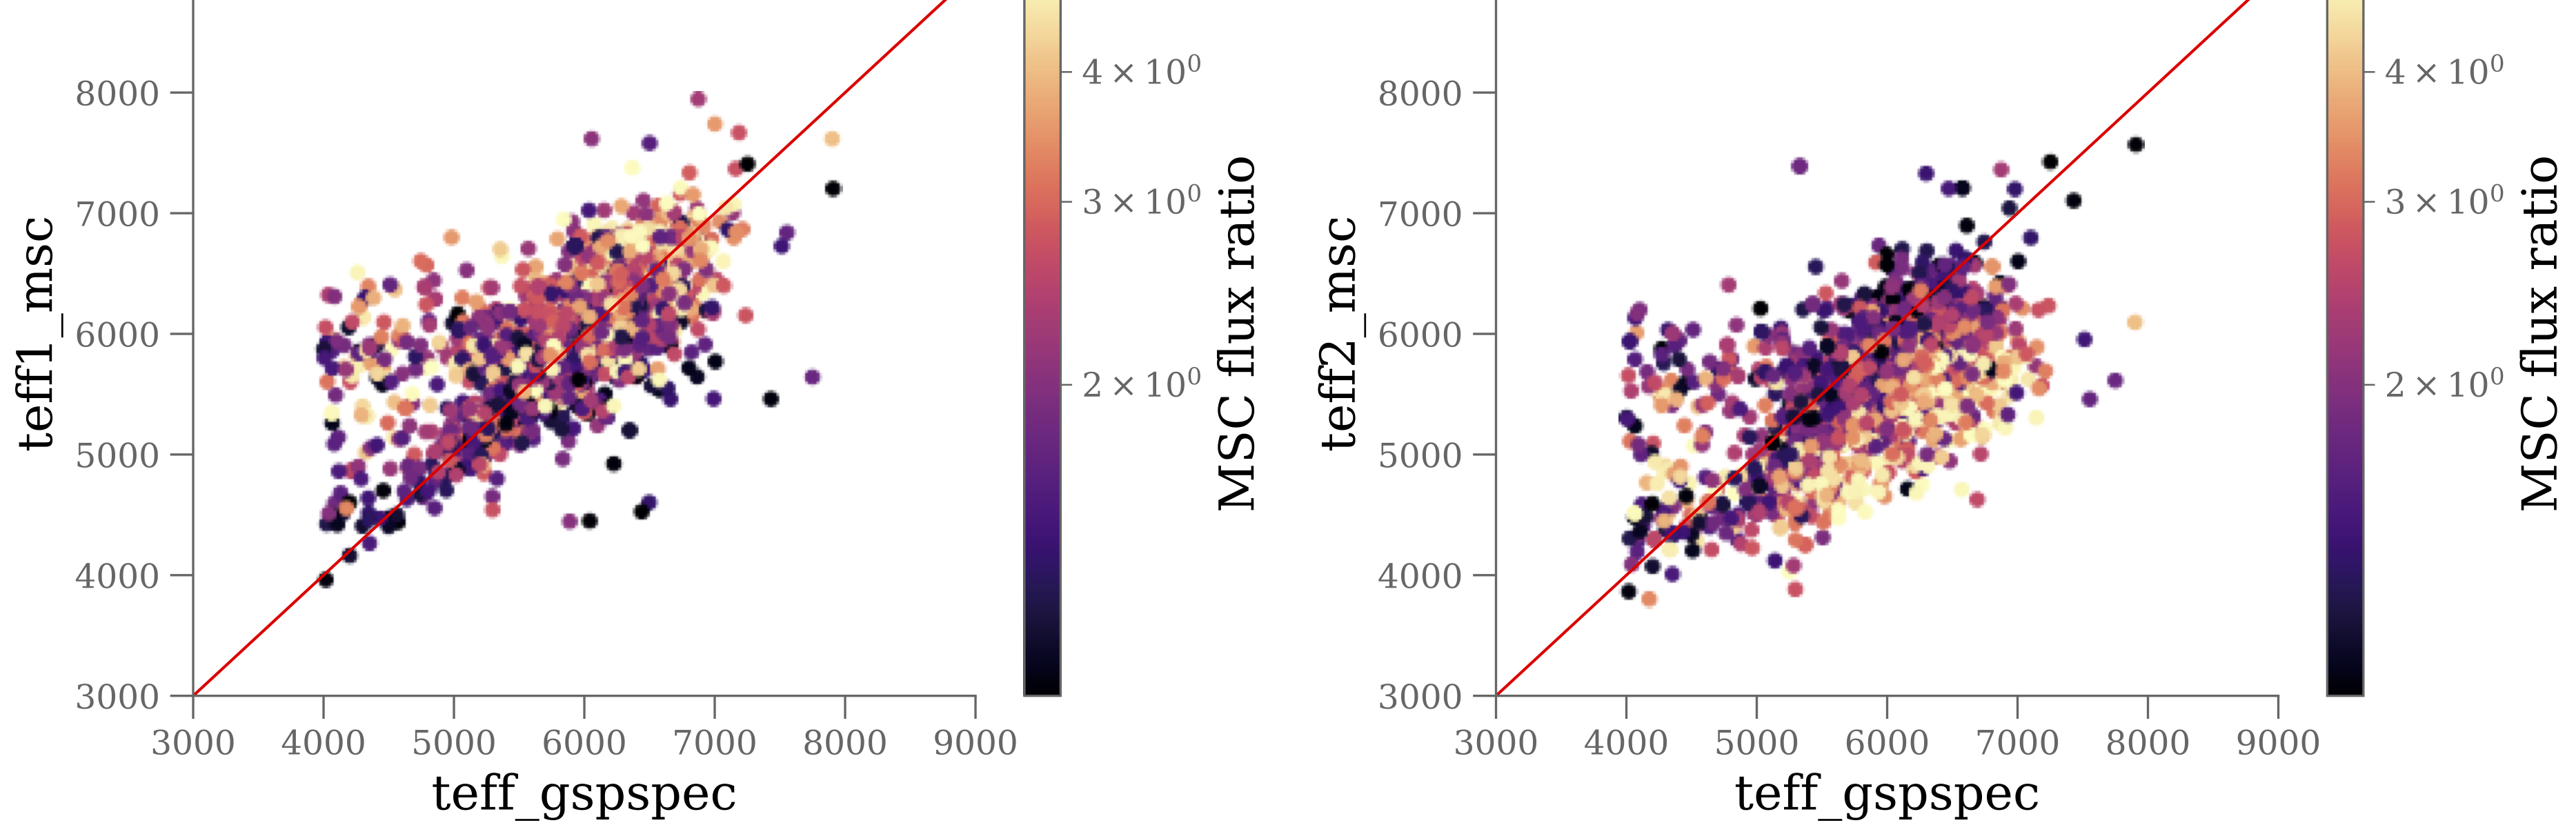
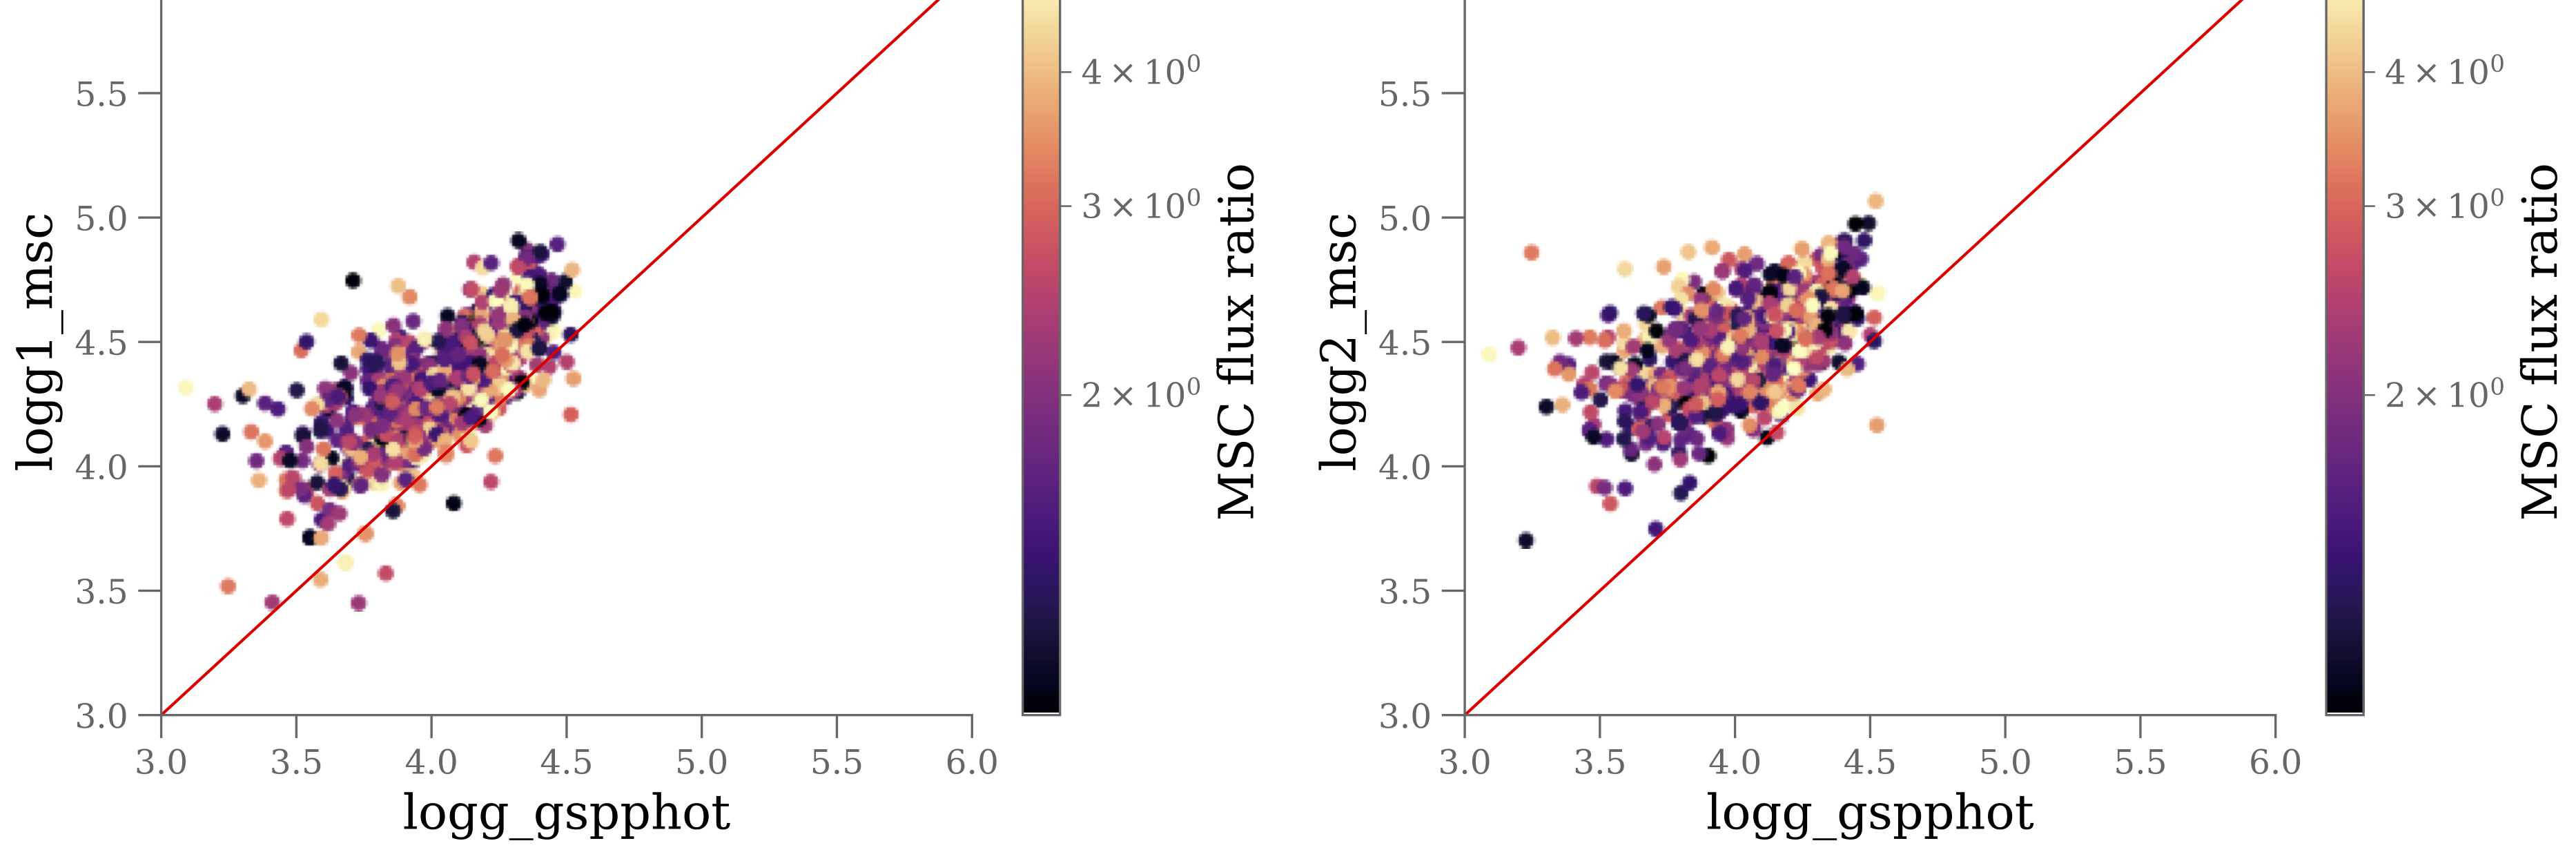
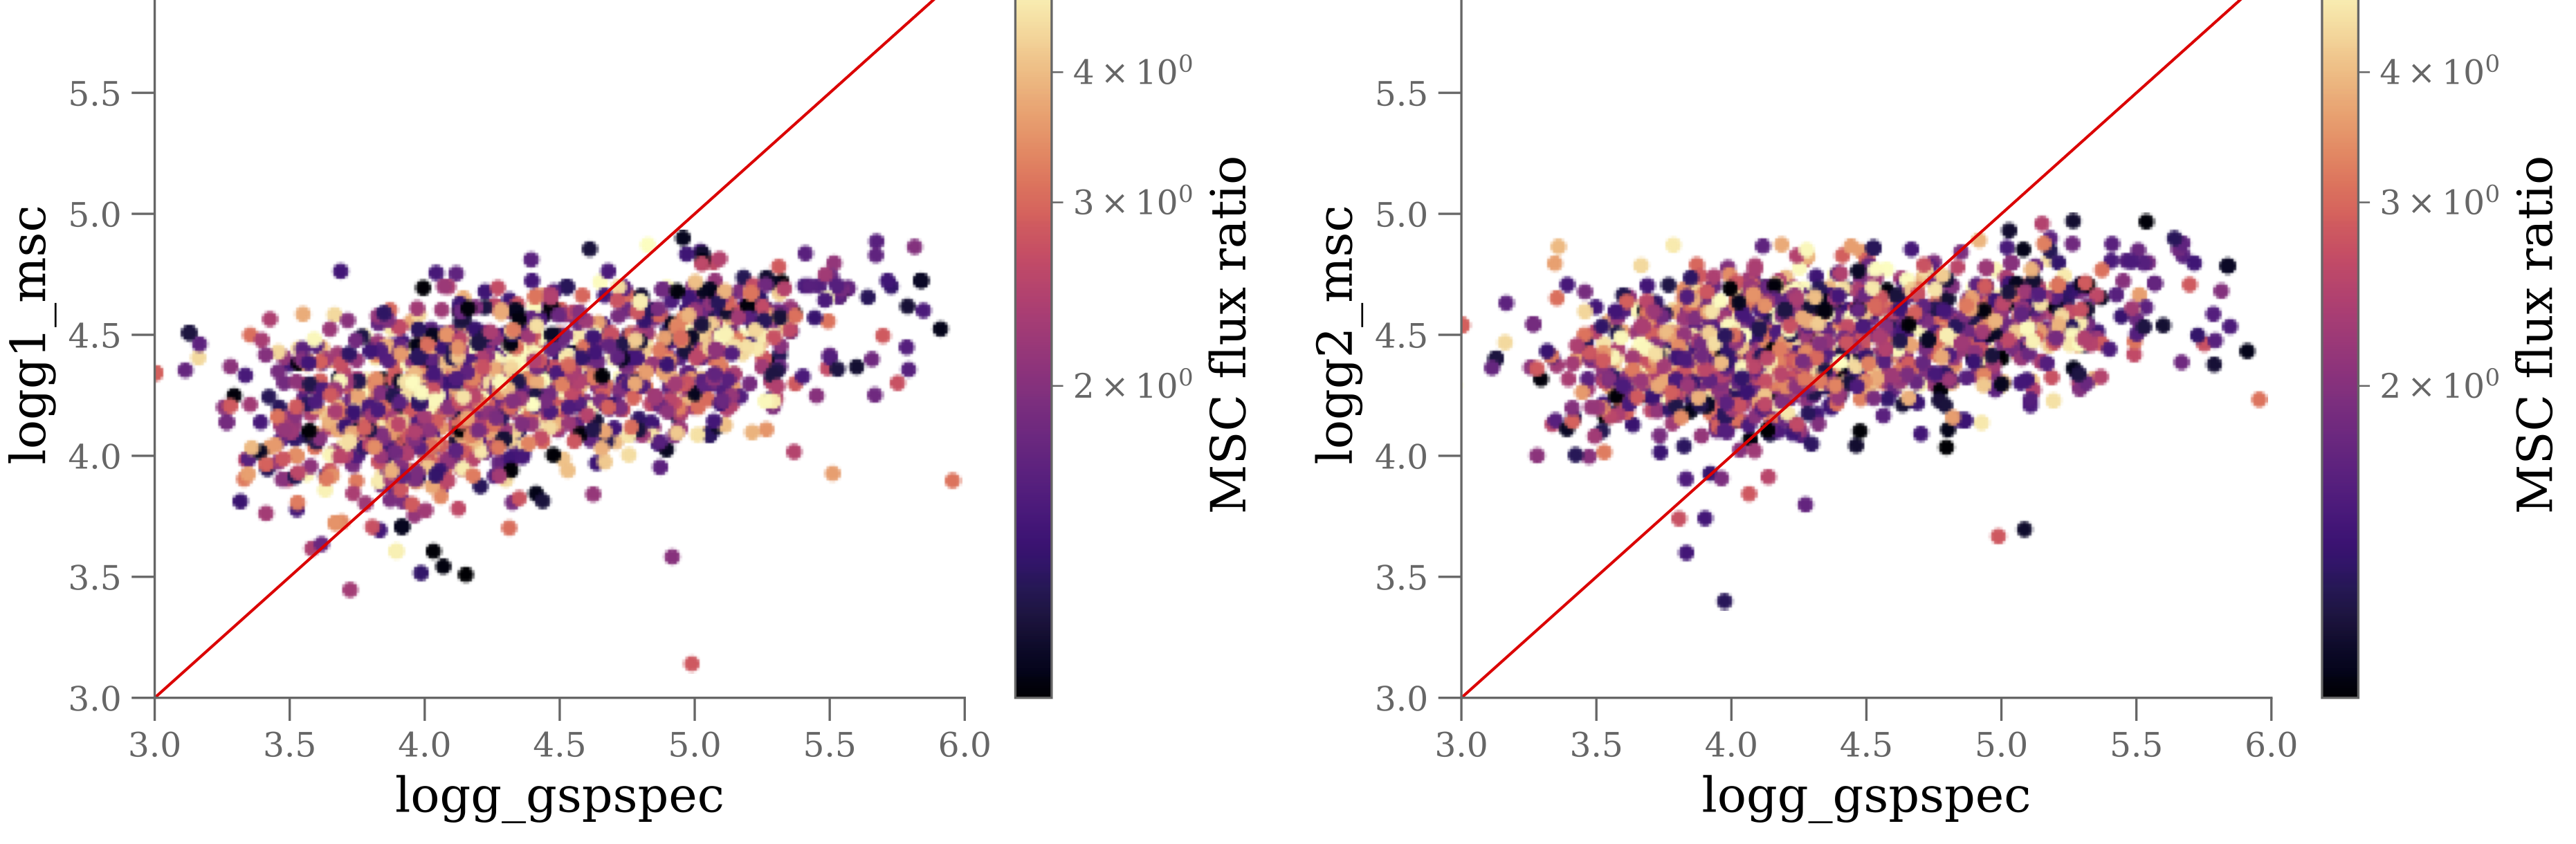
The comparison of from MSC and from GSP-Phot for the GALAH sample is shown in Figure 11.90. Keeping in mind that GSP-Phot is analysing a combined spectrum of two stars as if it were a single star, the GSP-Phot can be seen as parametrizing the “average” spectrum. Thus, we would expect that from MSC for the primary ( 1) should be larger than from GSP-Phot, while for the secondary ( 2) should be smaller, if the two components are different. In the limiting case of two equal components, all three values should be equal to within the typical uncertainties of each algorithm. The comparison of from MSC to those from GSP-Spec for the GALAH sample is shown in Figure 11.91, and the same considerations as for GSP-Phot hold. The figures show the expected trends, but we note that for 1 there are a number of points below the 1-to-1 line.
The comparisons of from MSC to those from GSP-Phot and GSP-Spec are shown in Figure 11.92 and Figure 11.93, respectively. In the case of we notice that MSC often infers higher values of for both components than GSP-Phot. On the one hand that makes sense, because both will then be less luminous so that their combined luminosity comes out as observed. On the other hand we also see in the MSC validation that compared to the literature values the values tend to be too high (see Section 11.3.5). In the comparison to GSP-Spec the values cluster around the 1-to-1 line, although with a spread of roughly 1 dex away from the line in both directions.
 |
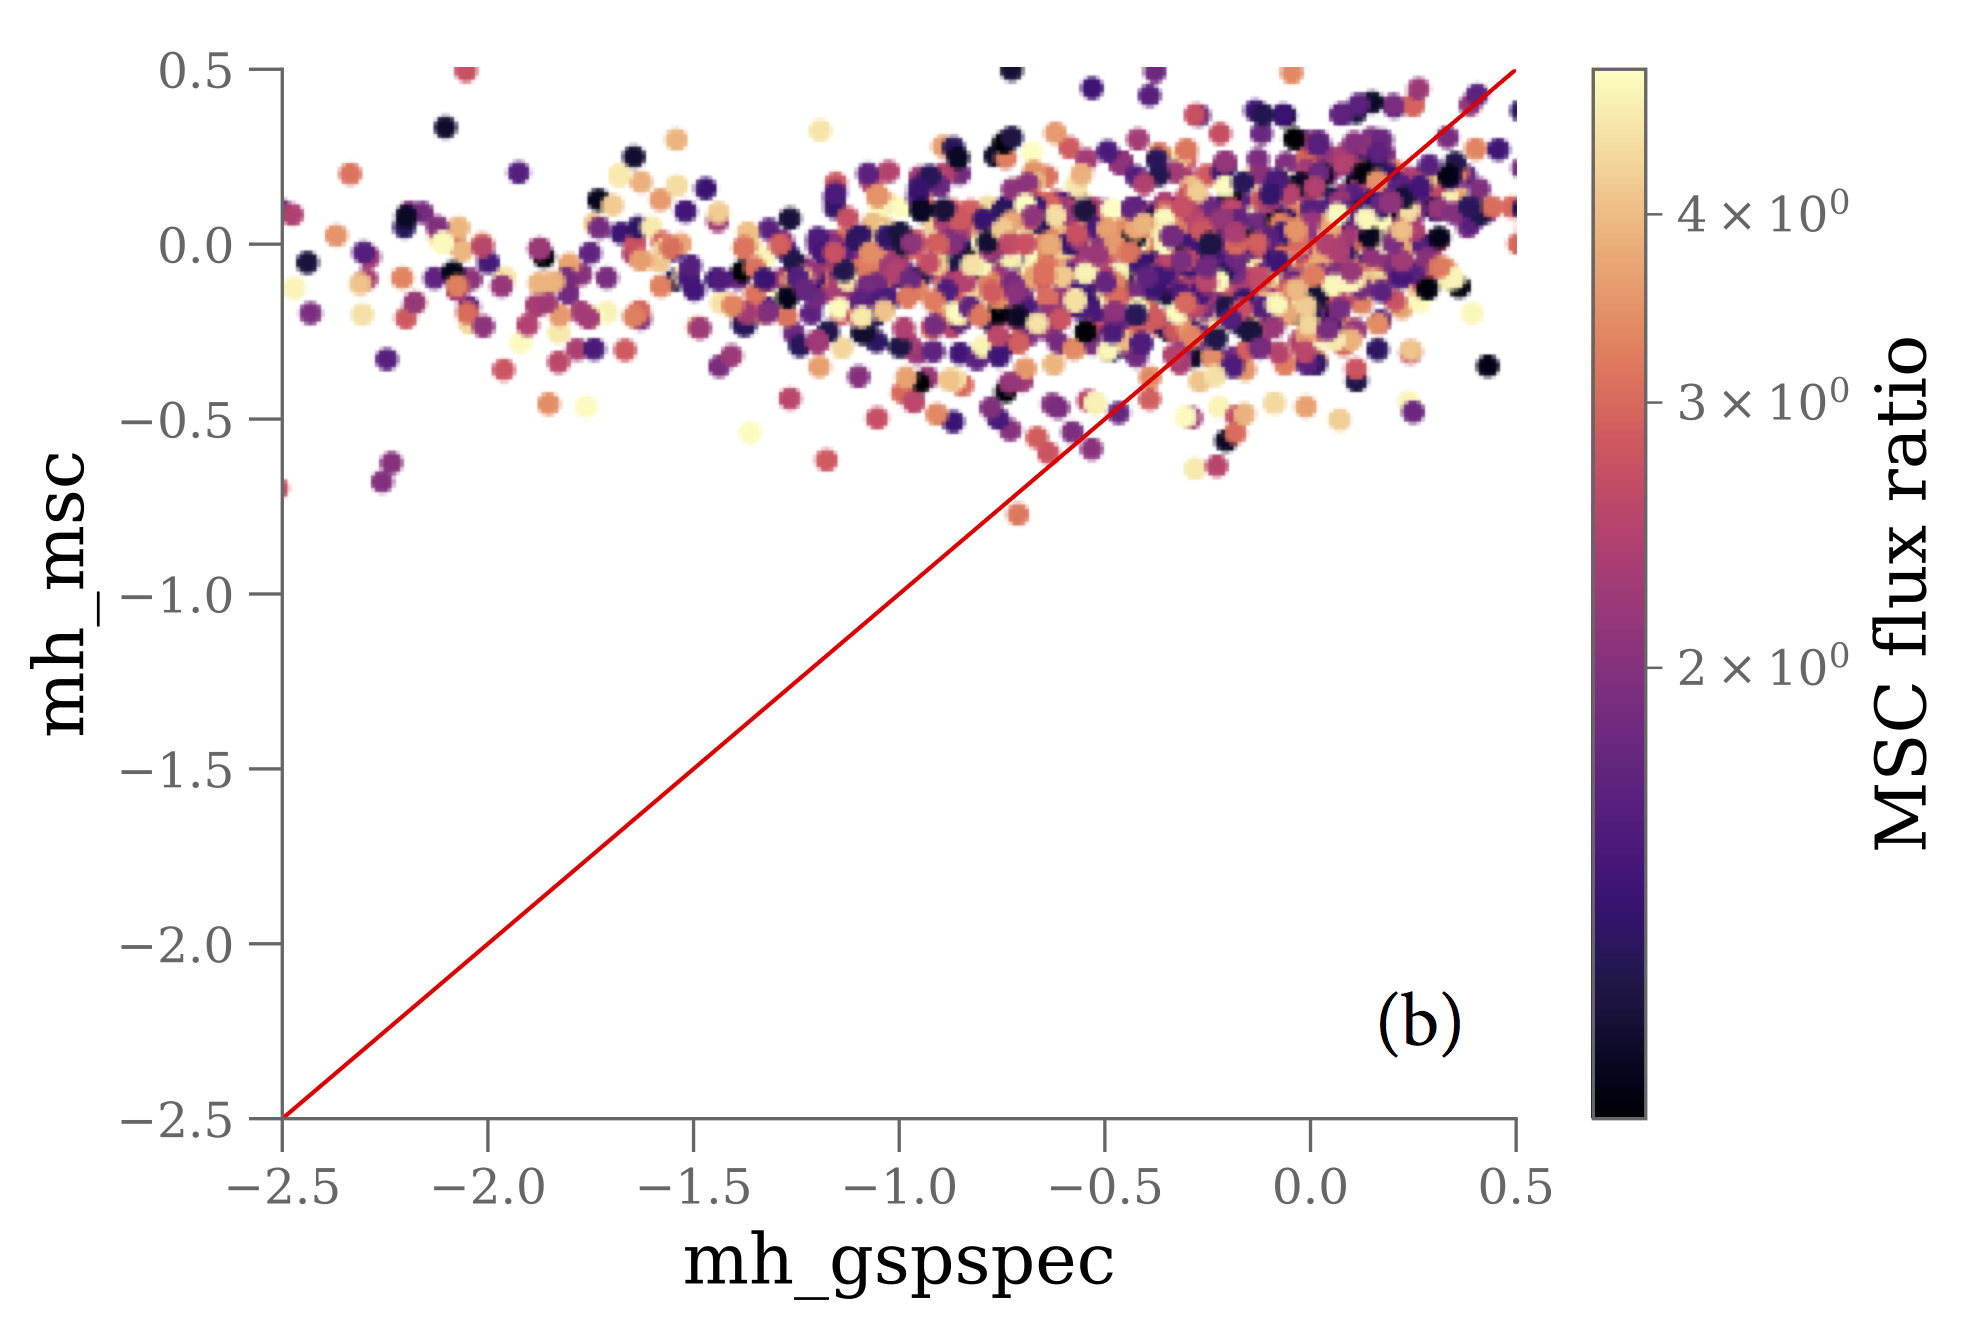 |
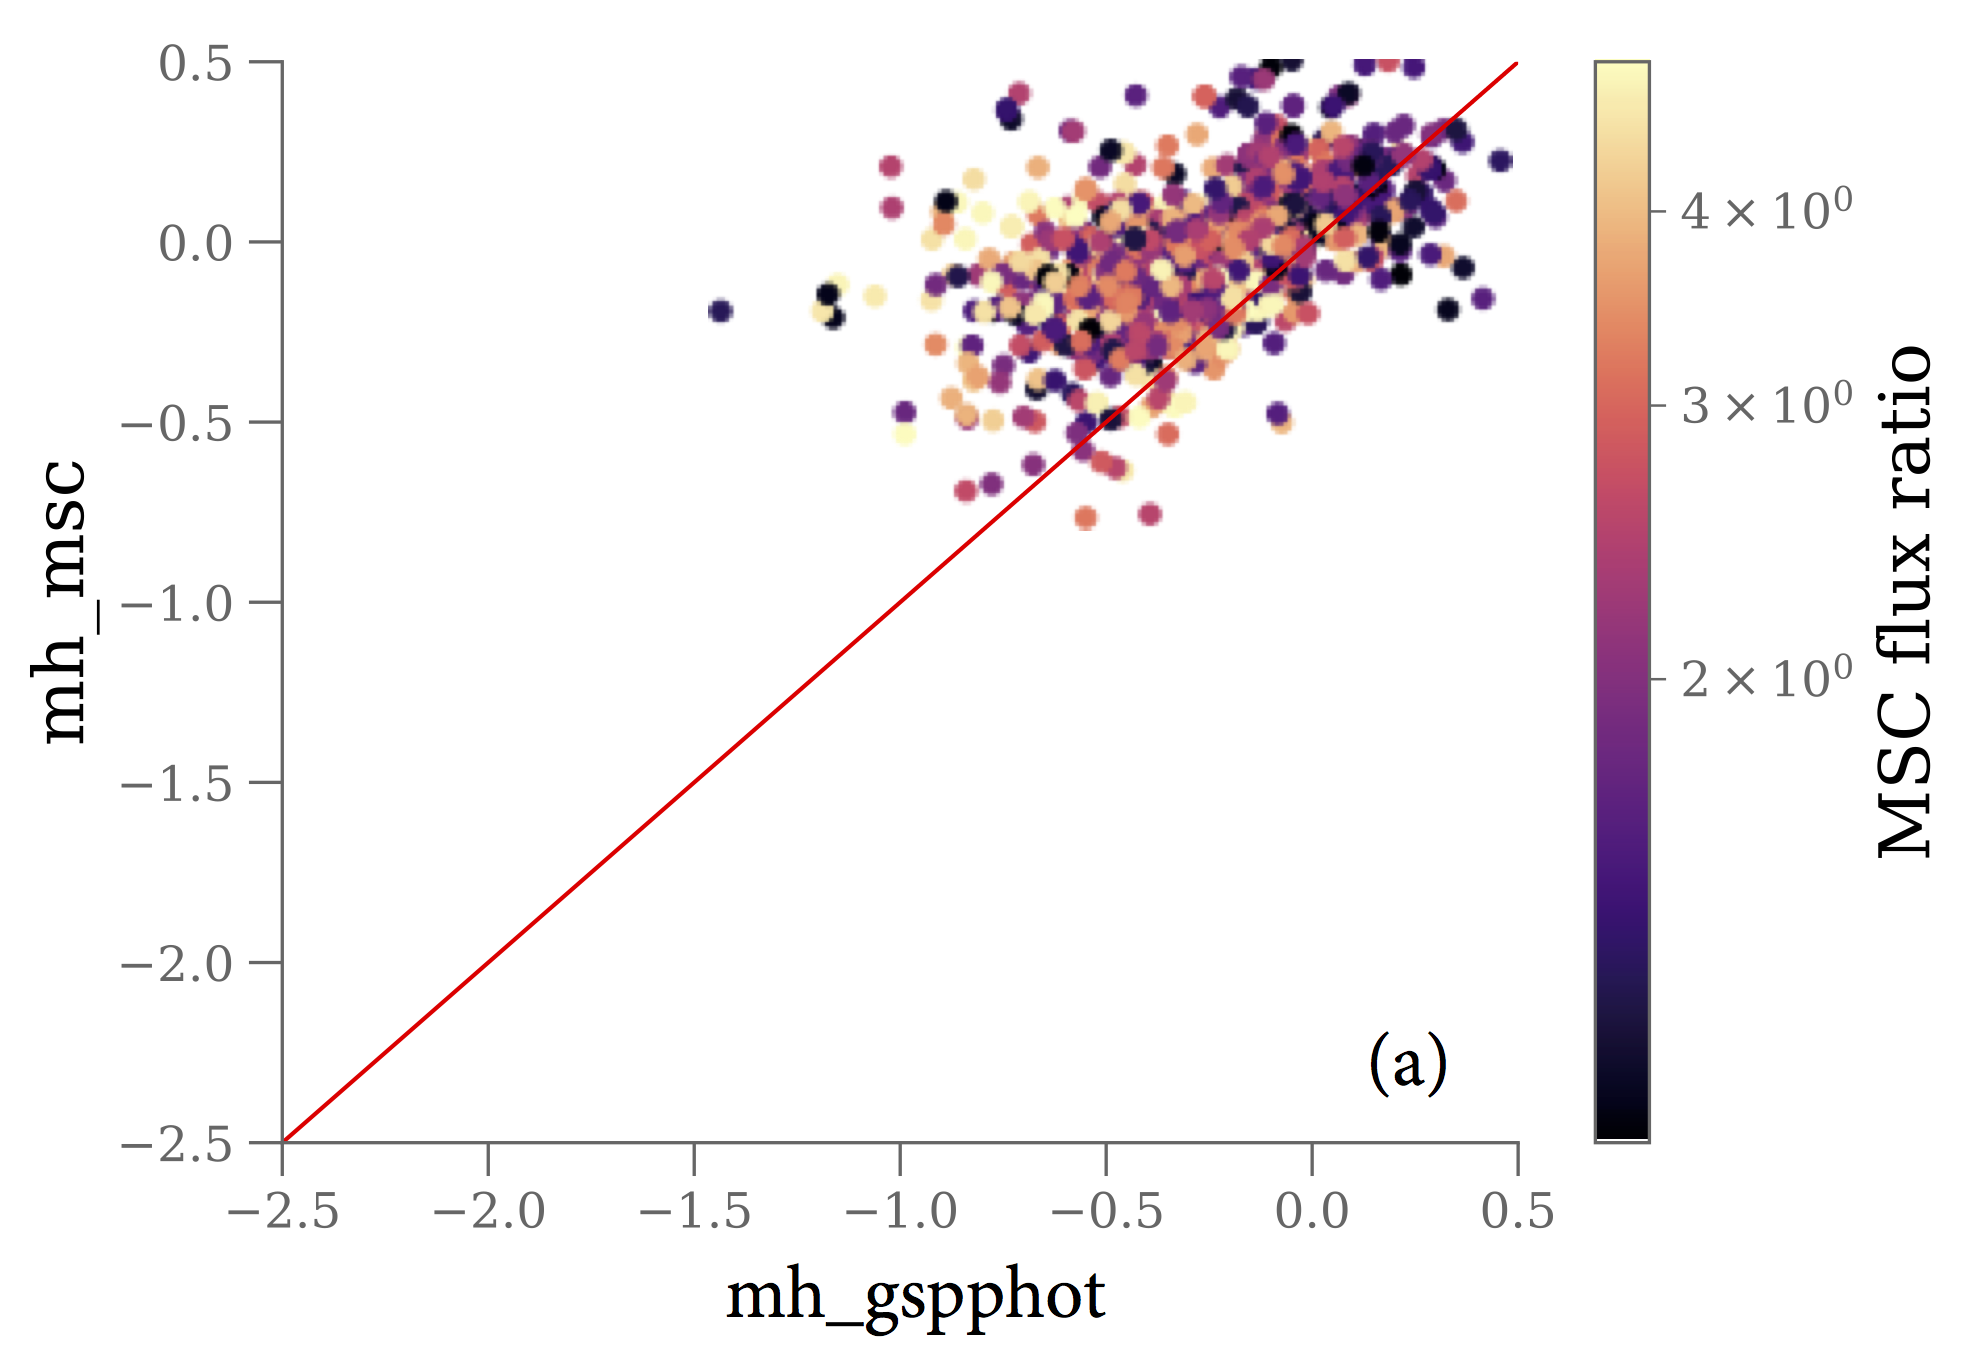
The comparisons of from MSC to those from GSP-Phot and GSP-Spec are shown in Figure 11.94. In the comparison with GSP-Phot we see that the MSC inferred is roughly compatible with the GSP-Phot values, although the MSC values are on average somewhat higher than the ones from GSP-Phot. We note that biases in the single star inferred values in comparison to MSC inferred values cannot be identified yet, due to MSC’s limited performance. The comparison to GSP-Spec also shows compatible values for , at least around solar metallicities. GSP-Spec has a number of very metal poor sources (more of these appear in the GALAH sample than in the APOGEE sample), which are absent in MSC, probably due to the prior used by MSC (a Gaussian with mean 0 dex and standard deviation 0.2 dex).
Some statistics for the comparisons are given in Table 11.45.
| GSP-Phot | GSP-Spec | |||
| Parameter | bias | mad | bias | mad |
| 1269 | 1646 | |||
| 1 | 70 | 180 | 130 | 260 |
| 2 | 420 | 390 | 320 | 450 |
| 1 | 0.3 | 0.3 | 0.0 | 0.3 |
| 2 | 0.4 | 0.4 | 0.1 | 0.4 |
| 0.2 | 0.2 | 0.5 | 0.4 | |
Star clusters
Author(s): Antonella Vallenari
In this section, we focus on a sample of star clusters selected from the Cantat-Gaudin et al. (2020) catalogue. We also include a few globular clusters from Gaia Collaboration et al. (2018b). Our selection corresponds to about 130,000 stars. As we focus on star clusters, we can assume they are co-eval populations (i.e., same age, [M/H], about the same extinction, and distance). This assumption allows us to use isochrones as a reference for comparing our parameters. However, we should also warn the reader that in more crowded regions the raw data products do not have the same quality as in non-crowded regions (Gaia Collaboration et al. 2023c), and one should be aware of this limitation when interpreting this validation analysis.
We compare the atmospheric and evolution APs from GSP-Phot (Section 11.3.3), GSP-Spec (Section 11.3.4), and FLAME (Section 11.3.6) to the PARSEC isochrones available from the INAF Padova Observatory website at http://stev.oapd.inaf.it/cgi-bin/cmd. Note that Apsis processed all the stars independently and did not exploit the co-evolution of the stars. When analyzing the GSP-Spec results, we select the stars having flags_gspspec with f1, f2, f4, f5, f8 = 0, where fN indicates the N character in flags_gspspec.
In this Section, we present some of the key results concerning the global quality of the classification.
Atmospheric parameters: , ,
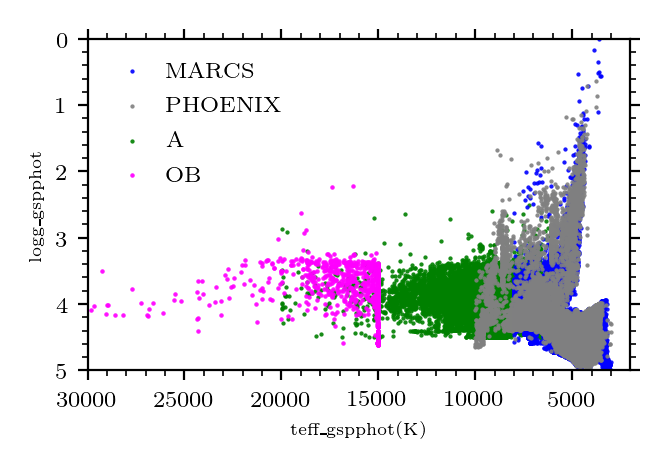
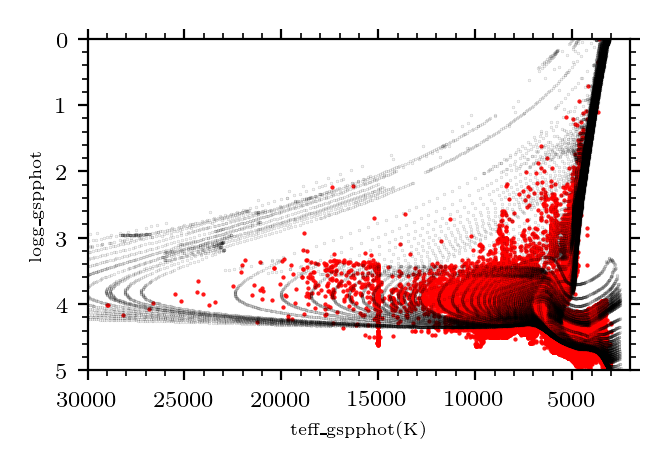
We analyse the ’best’ results for GSP-Phot taken from the astrophysical_parameters table. As a consequence, we observe unphysical clusterings of points on the HRD (see Figure 11.95): in particular we see edge effects at the library borders. This is most evident for the OB library. teff_gspphot and logg_gspphot are, however, in general in agreement with our isochrone expectations. The overall median of the distribution of teff_gspphot residuals (to the isochrones) is K, with a MAD K. Compared to the isochrones we find that teff_gspphot is overestimated for giants and underestimated for supergiants.
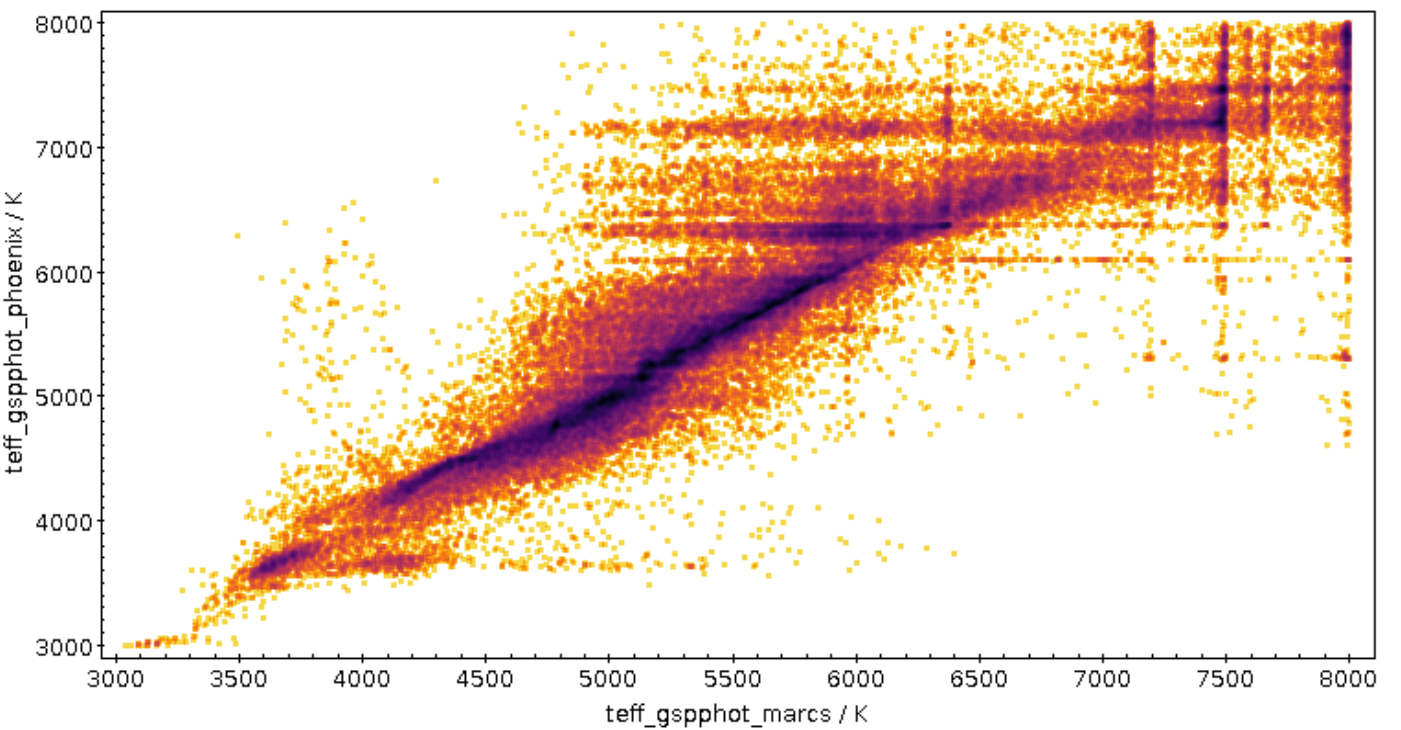
For stars having , we compared teff_gspphot_marcs to teff_gspphot_phoenix values (in the astrophysical_parameters_supp table). The comparison is shown in Figure 11.96. We find their mean difference (MARCS-PHOENIX) K (MAD K), and their median difference K (with the quartiles, K, K). One can also see the non physical clumping of stars in specific nodes of the grids of both libraries.
teff_gspspec shows good agreement overall with the isochrone predictions, with (median) or 30 K (mean) and a MAD K.
Overall the median of the distribution of logg_gspphot residuals (to the isochrones) is dex (MAD=0.22) with a long tail of overestimated mainly on the main sequence (see Figure 11.95). We find that is underestimated for hot stars and giants, and overestimated for intermediate mass stars.
logg_gspspec shows a bias of dex (median; MAD=0.44 dex) when compared to isochrone predictions. values for giant stars in the AGB phase have poorer quality.
Only GSP-Spec provides [/Fe] (alphafe_gspspec) and individual abundance ratios, and most abundances present some correlations with .
Evolution parameters: , , , age
mg_gspphot presents systematics in distant clusters as an effect of the underestimated distances (see Section 11.4.3). In addition presents a deviation from the isochrone references at mag in both distant and nearby clusters (see Figure 11.101)
FLAME provides two sets of age and mass estimates: one based on the GSP-Phot results (appearing in the astrophysical_parameters table) and one based on the GSP-Spec ones (appearing in the astrophysical_parameters_supp table. We obtain a sample of about 1 500 stars when selecting stars with both spectroscopic age and mass from FLAME, i.e, mass_flame_spec and age_flame_spec estimates.
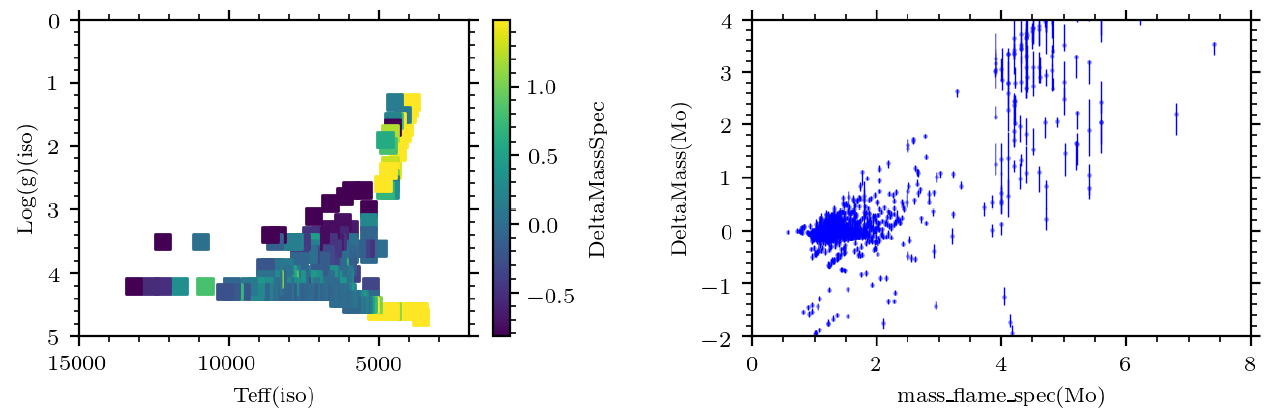
mass_flame_spec presents overestimated values for lower main sequence stars ( K) and for AGB stars cooler than 4500 K. For the latter these have been identified as as stars with mass_flame_spec (see Figure 11.97). These can be understood because they are outside of the grid of mass and age used when inferring these values. The user is therefore warned to ignore giant masses if they have values beyond about 2 – 3 . When comparing these values to isochrone predictions, we find a difference (mean), , (MAD ), and a median of , () With the same comparison, we find that the reported values have underestimated uncertainties. The mean value of /error=1.37, (, MAD=1.5; see Figure 11.97).
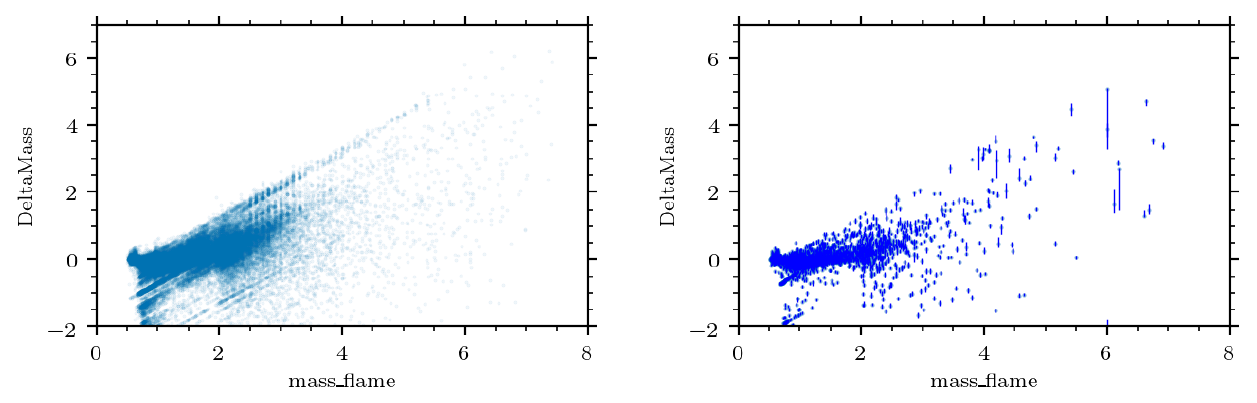
mass_flame shows an overall difference with isochrone masses of 0.38 (mean), 0.78 (), 0.42 (MAD), 0.33 (median). If we restrict ourselves to stars with flags_flame =00, we find a difference of -0.03 (mean), 0.78 (), 0.14 (MAD), -0.11 (median). Although, we note that there are artifacts due to coarse fit to isochrones that we mitigated with a selection on flags_flame = 00 or 01 i.e. main sequence stars with masses (see Figure 11.99).
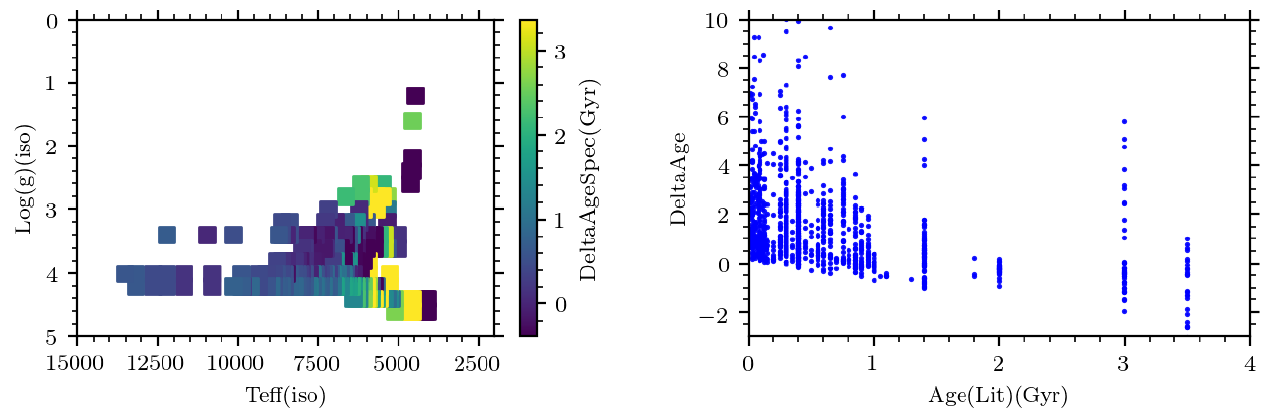
age_flame_spec presents overestimated ages for young stars and underestimated for old stars (see Figure 11.98) We find larger discrepancies for cool main sequence stars w.r.t. literature values (see Figure 11.98) We find an age difference with literature values of age = -0.6 Gyr (mean), -0.4 Gyr (median), = 0.8 Gyr, MAD 0.3 Gyr. We also find that the uncertainties are underestimated. age/error=1.3 (mean), = 2.2, MAD = 0.61 Gyr.
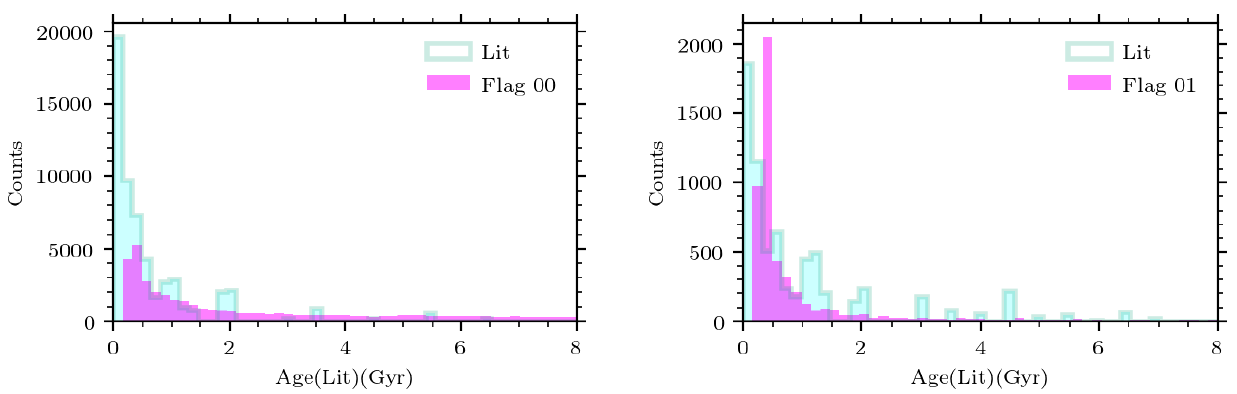
age_flame shows an overall difference to the isochrone based ages of 3.0 (mean), MAD=1.4 Gyr, and with flags_flame = 00 and 01 (main sequence stars with masses), the difference with the isochrones is 0.3 (mean), 0.07 (median), MAD=0.38 (see Figure 11.100).
Extinction parameters: ,
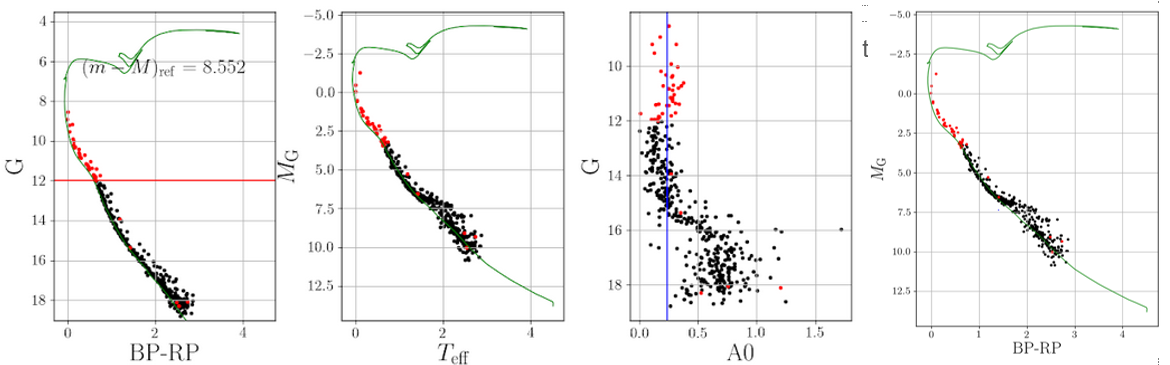
The overall median of the distribution of ag_gspphot residuals compared to the isochrones is mag with a MAD . A - degeneracy is present in parts of the sky. An example of some of the systematics can be observed in the CMD distribution, where ag_gspphot overestimates for giants and underestimates for hot supergiants, when we compare it to clusters.
We find that deviates systematically from the expected values with a strong magnitude dependence, esp. at faint magnitudes (, see third panel of Figure 11.101). This analysis is conducted using clusters. However, we also know that in denser regions of the sky the raw data products may suffer from crowding issues, see (Gaia Collaboration et al. 2023c), and the results presented here are not necessarily applicable to all sources.