11.4.9 Analysis of objects with lower probability classifications
Author(s): Daniel Garabato, Minia Manteiga
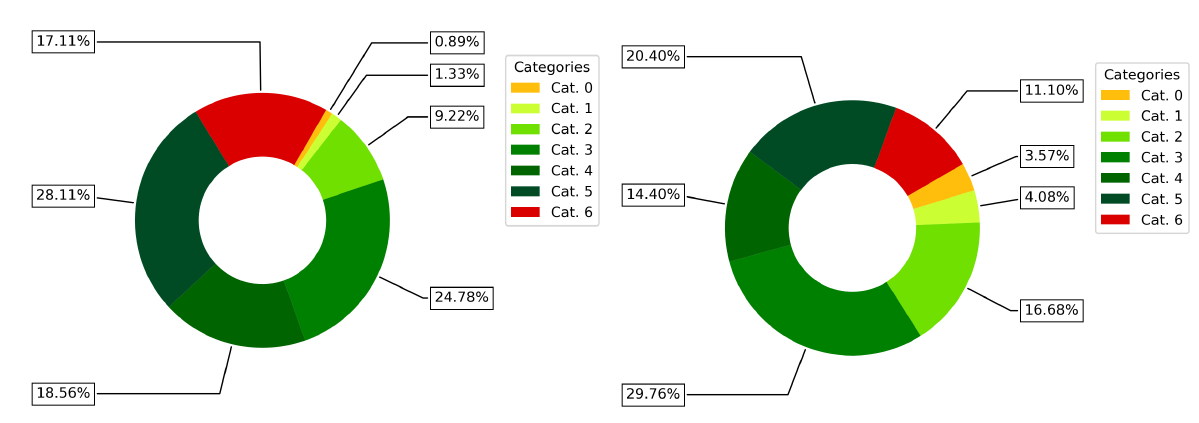
The outlier analysis (OA) module performs a clustering analysis of sources that have lower probability classifications from DSC. It provides a 3030 lattice of neurons that aims to group objects of similar observational characteristics, including different quality measurements in order to assess the quality of the clustering performed. Such indices are derived from the intra-neuron distance distribution, that is the distribution of classification distance within each neuron, measured as the squared Euclidean distance between the XP spectra of a source and the prototype of the neuron where it was assigned. Among these indices, is a categorical index which summarises the other quantities into seven quality categories. Figure 11.102 shows the ratio of neurons and sources that were assigned to each one of the quality categories. As it can be observed, around 36% of the neurons were assigned to a high quality category, which represent approximately 54% of the sources, whereas around 17% of the neurons were assigned to a low quality category, that represent 11% of the sources processed by OA.
Apart from the categorical index, which gives an overall idea of the fitting provided by the neurons, the quantified indices are also available to perform a more precise analysis, so that the width, skewness or kurtosis of the classification distance distributions in each neuron can be studied. Furthermore, the classification distance (as well as its percentile rank within the neuron) is also provided for each one of the sources processed by OA. Therefore, a finer analysis of the clustering could be achieved by just filtering out those sources that do not meet a certain quality criteria imposed by the user. For instance, the user might want to focus just on those sources that belong to a high quality neuron that was labelled, and whose classification distance is within the best percentile rank. Such specifications would lead to a subsample of sources for which the estimated class label can be accurate. On the contrary, the user may want to explore those neurons that were assigned to the poorest quality category, which represent around an 11% of the sources processed by OA (), in order to try to unveil their nature.
Furthermore, for each source processed by OA, a processing flag is also provided, which also includes information about the quality of the sources. In particular, it indicates whether the XP spectra of a certain source was interpolated or not due to negative or zero flux values. For Gaia DR3, around 41 million sources were interpolated in BP, and 30 million in RP. Approximately 28 million out of the 56 million objects processed by OA required an interpolation in both spectra.