11.4.5 Evolutionary Parameters
Author(s): Orlagh L. Creevey, René Andrae, Rosanna Sordo
In this section, we focus on further quality assessment of the evolution parameters: Luminosity (lum), absolute G-band magnitude (mg), stellar radius radius, stellar age (age), and evolution stage (evolstage) that GSP-Phot and FLAME produce (see details in Table 11.42). In Section 11.3.3 and Section 11.3.6, we present some comparisons with external data – see Figure 11.17 for radius_gspphot, and Figure 11.33 – Figure 11.35 for radius_flame, mass_flame, age_flame, and evolstage_flame.
Radius and Luminosity
GSP-Phot derives self-consistently radius, absolute magnitude and distances along with the atmospheric (see Table 11.39) and extinction parameters (see Table 11.44).
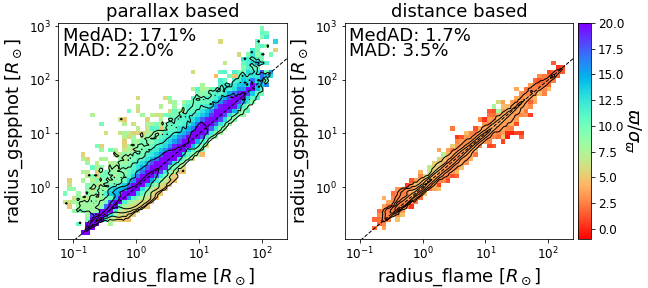
FLAME derives in a less model-dependent manner than GSP-Phot and subsequently obtains radius_flame from lum_flame and teff_gspphot assuming a distance estimate (see Section 11.3.6): FLAME chooses either the parallax or distance_gspphot; and this choice is stored in flags_flame. Therefore, we expect better agreement of and (or M) from both GSP-Phot and FLAME, when FLAME uses distance_gspphot than when it uses parallax as a distance proxy.
In Figure 11.84, we compare for a random sample of 1.5M sources both modules estimates of radius parameters and we further split the sample depending on the distance proxy we used. We find the radius agrees better when FLAME uses the inferred distances (as expected): we find dispersions of the order of 1.5% with a 3.4% scatter, consistent with the reported uncertainties on this parameter. The differences are more significant (%) when using the parallax (left panels), with a strong correlation with the parallax signal-to-noise ratio (SNR). The largest discrepancies are around () as this is the transition between using the parallax and the distance for stars beyond 2 000 pc. This region also coincides with the largest radii uncertainties (see Figure 11.29, which shows uncertainties in radius_flame between 5 - 15% at this SNR).
Section 11.4.3 documents some distance vs. parallax systematics and discrepancies even for high parallax SNR; these could partially explain the differences we find. Further reasons for the discrepancies are the different methods employed in both modules.
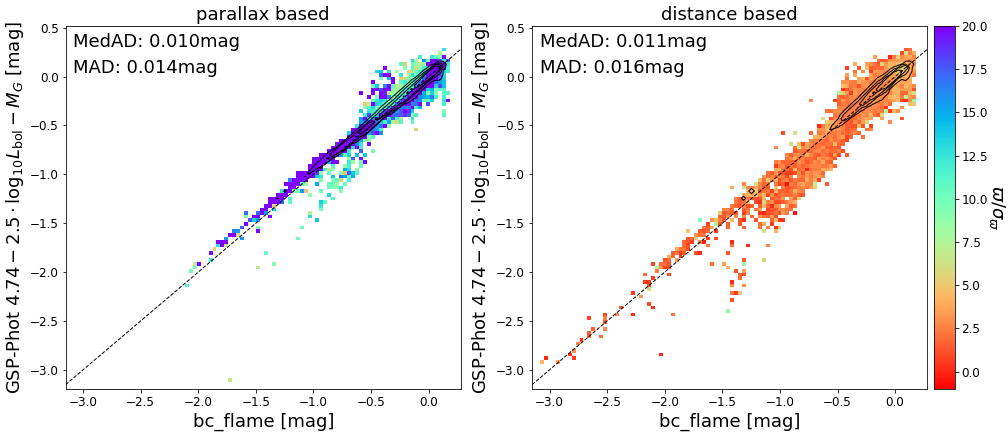
GSP-Phot does not provide us with a luminosity estimate. We thus explore the consistency between the magnitude from GSP-Phot, and the luminosity and bolometric correction from FLAME knowing that
| (11.49) |
In Figure 11.85, we use lum_flame, bc_flame and mg_gspphot to investigate the differences between the absolute magnitudes from both modules. The differences are of the order of mag regardless of the distance estimate. These are consistent with the uncertainties reported on all parameters. Some outliers (esp. right panel) partially relate to the outlier distances at low parallax SNR where the priors become essential.
Mass, Age and Evolution Stage
The validation of FLAME parameters (Section 11.3.6) presents the comparisons of mass, age, and evolution stage with external data. As no other CU8 module produces these data products, the only other method to assess their quality is to determine their consistency within open clusters or wide binaries. We discuss specific quality assessment using clusters in more detail in Section 11.4.7.
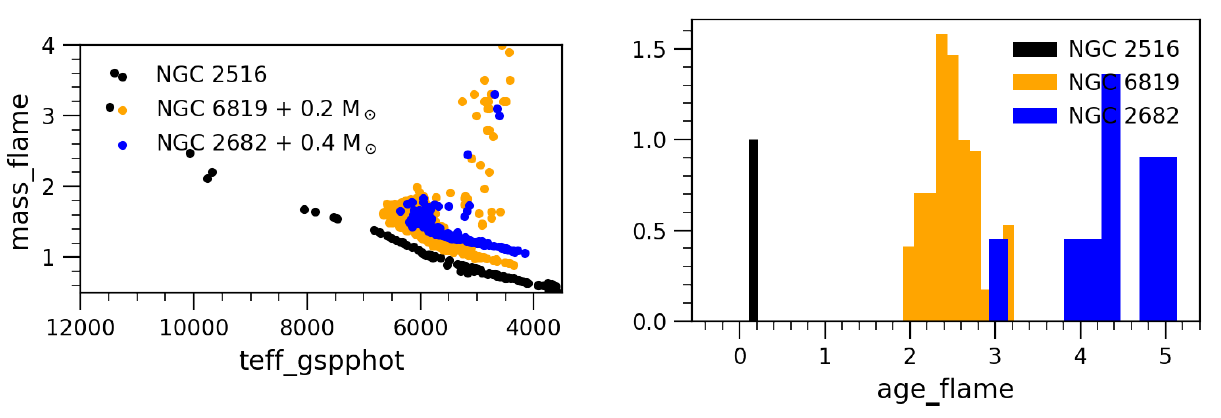
This section aims to validate the FLAME masses and ages when selecting turn-off stars (from their masses) and members of three solar-metallicity open clusters selected in common to both Cantat-Gaudin et al. (2018) and Bossini et al. (2019): NGC 2516, NGC 6819, and NGC 2682. Their literature ages according to Bossini et al. (2019) are given in Table 11.43, which were obtained by fitting stellar isochrones to their colour-magnitude diagrams. We selected the cluster members w.r.t. Cantat-Gaudin et al. (2018) and a membership probability .
In Figure 11.86, we show mass_flame versus teff_gspphot for the selected members of these three clusters. The masses are shifted by +0.2 and +0.4 for visualization purposes, respectively. We determine (by eye, that is, reading the minimum and maximum masses of the y-axis at which the is near its maximum,) the intervals of turn-off masses from these diagrams of [3.0, 3.2 ], [1.4, 1.6 ], and [1.2, 1.3 ] for the three clusters, respectively. Then we select the sources within these intervals while ensuring FLAME estimates they are not evolved stars (evolstage_flame ). The right panel of Figure 11.86 shows the age distribution of these selections. We estimate their ages at Gyr, [2, 3] Gyr and [3, 5] Gyr, respectively, in relatively good agreement with the known literature values (see Table 11.43).
| Cluster | Age | mass_flame TO | age_flame |
| [Gyr] | [ ] | [Gyr] | |
| NGC 2516 | 0.25 | [3.0, 3.2] | 0.2 |
| NGC 6819 | 2.00 | [1.4, 1.6] | [2.0, 3.0] |
| NGC 2682 | 3.60 | [1.2, 1.3] | [3.0, 5.0] |