1.4 Release properties
Gaia Collaboration et al. (2016a) provides an overview of the contents of Gaia DR1. Arenou et al. (2017) describes the overall validation of the data.
1.4.1 Statistical properties
Author(s): Anthony Brown
Sky-coverage maps
Lindegren et al. (2016) provides maps of the source distribution on the sky for the primary astrometric data set and the secondary astrometric data set (also split into sources in common with the IGSL and new sources) separately. The overall source distribution on the sky is shown in Gaia Collaboration et al. (2016a).
Maps of the number of good astrometric observations per source are shown for the primary astrometric data set in Lindegren et al. (2016).
Object statistics
| Source numbers | |
| Description | Number |
| All sources | |
| Sources in the primary astrometric data set | |
| Number of sources in common with Hipparcos | |
| Number of sources in common with Tycho-2 (excluding Hipparcos stars) | |
| Sources in the secondary astrometric data set | |
| Sources with light curves | |
| Classified as Cepheids | |
| Classified as RR Lyrae | |
| Magnitude distribution percentiles | |
| Percentile | |
| % | |
| % | |
| % | |
| % | |
| % | |
| % | |
| % | |
The basic object statistics for Gaia DR1 are listed in Table 1.5. Visual representations of the statistics of the various data fields in Gaia DR1 can be found on the ‘Statistics’ pages in the Gaia archive (http://archives.esac.esa.int/gaia). Further summary statistics can be found in Table 3.4, Table 3.5, and Table 3.6.
Magnitude histograms
The magnitude distribution histograms for all Gaia DR1 sources and for the Hipparcos and Tycho-2 subsets are provided in Gaia Collaboration et al. (2016a). The magnitude distribution percentiles are listed in Table 1.5. The magnitude percentiles were computed with an optimised method that avoids sorting data or storing intermediate data, and consequently the results are not exact, although good enough for the statistical overview.
Error histograms
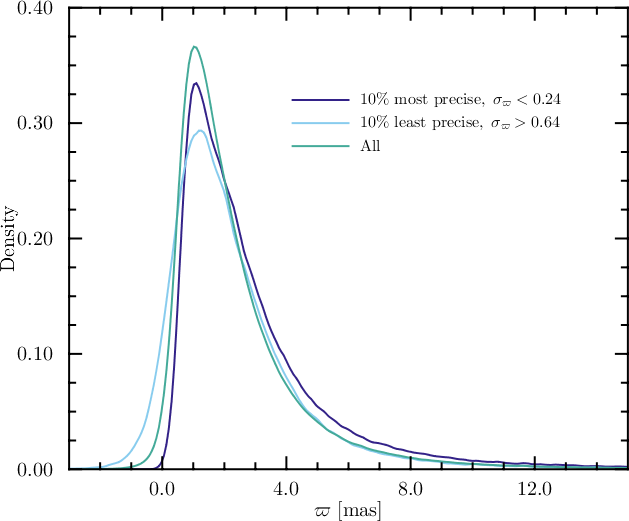
Error histograms and error statistics as a function of celestial position can be found on on the ‘Statistics’ pages in the Gaia archive (http://archives.esac.esa.int/gaia). As a basic demonstration that the parallax uncertainties quoted in Gaia DR1 provide the correct ranking of the parallaxes in terms of precision, we show in Figure 1.14 the distribution of parallax values for all stars in the primary astrometric data set, for the stars with the 10% best parallax uncertainties, and the 10% worst uncertainties. Note how the parallax distribution widens and includes a stronger negative tail as one moves from very precise to less precise parallaxes, which is as expected given that the true parallax values are larger than zero.
1.4.2 Completeness
Author(s): Anthony Brown
We summarize here the main points concerning the completeness of the Gaia DR1 catalogue. For details refer to Gaia Collaboration et al. (2016a) and Arenou et al. (2017).
-
•
Overall, Gaia DR1 does not represent a complete survey in any sense. The source list for the release is incomplete at the bright end and has an ill-defined faint magnitude limit, which depends on celestial position.
-
•
The combination of the Gaia scanning-law coverage and the filtering on data quality done prior to the publication of Gaia DR1 results in large regions on the sky (predominantly along the ecliptic) where many sources are missing, with source density fluctuations that reflect the scanning-law pattern. In addition, gaps may appear in the source distribution.
-
•
Many bright stars at mag are missing from Gaia DR1.
-
•
High-proper-motion stars ( yr) are missing.
-
•
Extremely blue and red sources are missing.
-
•
In dense areas on the sky (above stars per square degree) the effective magnitude limit of Gaia DR1 may be brighter by up to several magnitudes.
-
•
The effective angular resolution on the sky of Gaia DR1, in particular in dense areas, is not yet at the levels expected for the Gaia telescope mirror sizes. For double stars or binaries at separations below about 4 there is a notable decrease in the completeness of the detection of the secondaries.
Selection and filtering criteria
The contents of Gaia DR1 are not a one-to-one copy of the contents of the DPAC main database (MDB, described in Section 1.2.5). The contents of the latter were filtered on data-quality criteria before producing Gaia DR1. The filtering criteria are described in Gaia Collaboration et al. (2016a) and Lindegren et al. (2016). The consequences for the Gaia DR1 properties are described in Gaia Collaboration et al. (2016a) and Arenou et al. (2017).
Bright stars
As mentioned above, many of brightest stars on the sky are not included in Gaia DR1. This is due to a combination of the difficulties to observe bright stars (Gaia Collaboration et al. 2016b, at mag) and to calibrate the available observations (Gaia Collaboration et al. 2016a, at mag). Furthermore, for stars brighter than mag, the -band photometry is strongly affected by (Gaia DR1-related) calibration problems linked to the TDI-gating scheme (Gaia Collaboration et al. 2016a; van Leeuwen et al. 2017; Evans et al. 2017).
Double stars
Double stars and binaries or multiple systems did not receive a special treatment in the data processing for Gaia DR1. All sources were treated as single stars. The consequences for binaries and double stars are described in Lindegren et al. (2016).
Extended objects
Extended objects (e.g., planetary nebulae or galaxies) were not treated for Gaia DR1 and are not listed as such in the catalogue.
Solar-system objects
Solar-system objects are not included in Gaia DR1.
Variable stars
False detections
The detection of sources and their subsequent selection for observation by Gaia is done fully automatically on-board the spacecraft (Gaia Collaboration et al. 2016b). This process is susceptible to false detections caused by cosmic rays, solar protons, background noise, and diffraction spikes in the images of bright stars (Gaia Collaboration et al. 2016b; Fabricius et al. 2016). The false detections from cosmic rays and solar protons are largely eliminated on-board. However, the telemetry processed for Gaia DR1 did include a significant number of spurious detections caused by the diffraction spikes around bright sources (for details, see Fabricius et al. 2016). These led to the creation of a significant number of spurious sources during the process of assigning observations to sources (Fabricius et al. 2016; Lindegren et al. 2016, see also Section 2.4.9).
The filtering on data quality before the production of Gaia DR1 has largely eliminated spurious sources. However, a very small fraction may nevertheless have survived the filtering process.
1.4.3 Limitations
Author(s): Anthony Brown
The limitations of Gaia DR1 that are directly relevant to the scientific interpretation of the data are summarised below. Refer to Gaia Collaboration et al. (2016a), Arenou et al. (2017), Lindegren et al. (2016), van Leeuwen et al. (2017), and Evans et al. (2017) for more detailed descriptions.
Astrometry
-
•
All sources were treated as single stars without taking their radial velocity into account. Any astrometric effects due to the orbital motion in binaries or due to perspective acceleration were ignored. These source-modelling errors are in principle accounted for in the astrometric_excess_noise quantity, but this quantity should be treated with caution as it also includes other modelling errors present in Gaia DR1 (cf. Lindegren et al. 2016).
- •
-
•
The correlations between the astrometric parameters for a given source can reach high values (near or ) over large areas of the sky.
-
•
There are colour-dependent and spatially correlated systematic errors at the level of mas (Lindegren et al. 2016). Over large spatial scales, the parallax zero-point variations reach an amplitude of 0.3 mas, while over a few smaller areas (2 radius), much larger parallaxes biases may occur, up to mas.
Photometry
-
•
For the brightest stars, mag, the photometric accuracy is estimated to be limited to a calibration floor of 3 mmag for the individual CCD transits.
-
•
The quoted standard uncertainties on the mean -band magnitudes at the bright end can vary by an order of magnitude (Evans et al. 2017).
- •
-
•
A small fraction of sources has clearly wrong -band magnitude values. These are sources with quoted magnitudes well beyond the Gaia survey limit, or sources in common with Tycho-2 that have magnitudes well beyond the Tycho-2 survey limit (although some of the latter may be variables with large excursions in brightness).
Guide for the use of the data
Given the limitations of Gaia DR1 summarised above, the interpretation of the data is not straightforward, in particular when it comes to accounting for the incompleteness in any sample drawn from the Gaia Archive. We thus strongly encourage the users of the data to read the papers accompanying Gaia DR1 and to carefully consider the warnings given therein before drawing conclusions from the data.
Concerning the astrometry, we stress two important points:
-
•
The full covariance matrix should be used when taking the standard uncertainties on (subsets and linear combinations of) the astrometric parameters into account in any scientific analysis of the Gaia DR1 data. Examples of how this is done can be found in Brown et al. (1997) and Lindegren et al. (2000).
-
•
The parallaxes in Gaia DR1 may be affected by a systematic error, the magnitude of which is unknown but could be up to 0.3 mas. Averaging parallaxes over small regions of the sky, for instance in an open cluster, will therefore not reduce the uncertainty on the mean below the mas level. Whereas it has been suggested, for instance in Gaia Collaboration et al. (2016a), that a systematic parallax error of mas should be ‘added’ (in quadrature) to the published parallax uncertainties, this is not correct: Brown (2017) clarifies that reported parallax standard errors already include local systematics as a result of the calibration of the TGAS parallax uncertainties by comparison to Hipparcos parallaxes. Unfortunately, there is no simple recipe to account for the systematic uncertainties. The advice is to proceed with one’s analysis of the Gaia DR1 data using the uncertainties quoted in the catalogue (while possibly modelling systematic effects as part of the analysis), but to keep the systematics in mind when interpreting the results of the data analysis.