1.3 Release framework
1.3.1 Time coverage
Author(s): Gonzalo Gracia, Asier Abreu, Neil Cheek, Cian Crowley, Claus Fabricius, Juanma Fleitas, Alex Hutton, Alcione Mora, Hassan Siddiqui
For practical reasons, the Gaia mission is artificially split in time segments. The observations accumulated in each of these time segments are the input for the iterative data processing cycles. Each Gaia data release covers an integer number of time segments, always starting from the start of the nominal mission. Gaia Data Release 1 (Gaia DR1) includes the observations taken during Segments 00 and 01. The following table shows the start and end dates of these segments.
| Segment | Start date | End date |
| Segment 00 | 25-07-2014 | 04-06-2015 |
| Segment 01 | 04-06-2015 | 16-09-2015 |
1.3.2 Scanning law
Author(s): Gonzalo Gracia, Asier Abreu, Neil Cheek, Cian Crowley, Claus Fabricius, Juanma Fleitas, Alex Hutton, Alcione Mora, Hassan Siddiqui
For the time range applicable for the data provided in Gaia Data Release 1 (July 2014 to September 2015), there have been three different scanning laws employed. All three use a fixed Solar aspect angle (angle between the spacecraft spin axis and the Sun) and a fixed spin rate of 59.9605 arcsec s.
- EPSL
-
an Ecliptic Poles Scanning Law (EPSL) in which the spin axis of the spacecraft always lies in the ecliptic plane (no precession), such that the field-of-view directions pass the northern and southern ecliptic poles on each six-hour spin. This scanning law has been in place since the start of nominal operations of the spacecraft on 25 July 2014, at 10:30 UTC. The EPSL was used in the ‘following’ mode, i.e., with the SRS axis trailing the Sun by on the ecliptic. This is equivalent to precession phase .
- NSL
-
a Nominal Scanning Law (NSL) with a precession rate of 5.8 revolutions per year. The transition from the EPSL to this scanning law took place on 22 August 2014 at 21:00 UTC approximately, and was a smooth transition.
- NSL-GAREQ1
-
introduced a discontinuity in the precession phase () and spin phase () of the previous NSL, in order to optimise conditions for quadrupole light deflection observations close to Jupiter as part of the GAREQ experiment. The correction was activated on board on 25 September 2014 at approximately 11:35 UTC.
1.3.3 Spacecraft status
Author(s): Gonzalo Gracia, Asier Abreu, Neil Cheek, Cian Crowley, Claus Fabricius, Juanma Fleitas, Alex Hutton, Alcione Mora, Hassan Siddiqui
Major anomalies and special operations
For the time interval covering Gaia DR1, the spacecraft subsystem configuration is composed of nominal units (A-chain) with the exception of the Micro Propulsion Subsystem (MPS) which was switched to the redundant B-chain after a Safe Mode recovery triggered by a spurious performance change of MPS Thruster 3A (MT3A) on 17 July 2014. After testing of both MPS chains (which both performed nominally), the decision was made to use the B-side due to the MT3A performance issues. See Gaia Collaboration et al. (2016b) for more details.
Numerous Video Processing Unit (VPU) resets have been experienced during the early part of the mission. The thermal effect of having the associated row of CCDs automatically switched off was mitigated to a large extent with the introduction (on 18 September 2014) of an automatic recovery action on-board. Since the deployment of the VPU software version 2.8 in April 2015, no VPU resets have occurred.
A small movement of the M2 mirrors was performed to improve the focus of the following field-of-view in October 2014 and the preceding field-of-view in August 2015. For more details, see Section 1.3.3 and Gaia Collaboration et al. (2016b).
Telescope decontamination operations were performed in September 2014 and June 2015, scheduled after ice build-up had progressed beyond acceptable levels. For more details, see Section 1.3.3 and Gaia Collaboration et al. (2016b).
During December 2014, the MOC introduced open-loop ground automation (i.e., periods during which Gaia transmits science data to the ground stations without any intervention from MOC staff) and extra ground-station bookings to allow for increased science-data down link. The science-data return to ground was thereby increased along with the minimisation of data latency for the photometric and Solar-system alert projects.
A Lunar transit with approximately 0.35% of the Sun’s disk obscured occurred on 11 November 2014. The event was visible in multiple subsystems on the spacecraft (i.e., temperatures, MPS reaction to Solar radiation pressure, etc.). A similar, but larger (5%) event took place in November 2015 (which is not covered by Gaia DR1).
The necessity for a monthly Station-Keeping Manoeuvre (SKM, i.e. the maintenance of the desired orbit around L2) has diminished throughout the mission, the cadence now being between 3 and 4 months.
Focal Plane Assembly
For the time interval covering Gaia DR1, all elements on the focal plane were operating correctly and as expected. There have been no major issues with the PEM-CCD couples and all 106 devices are functioning within, or close to, specification (only one device currently slightly exceeds the readout-noise specification). In the absence of hardware issues, the most important parameter affecting the characteristics and performances of the focal-plane elements is the temperature.
Focal-plane temperature
Amongst the many different temperature sensors on-board the satellite, there are three placed close to the detector array. They are distributed across the focal plane with one placed near the SM1 CCD on row 1, one placed near the AF5 CCD on row 4, and the third one near the RVS3 CCD on row 5. Shown in Figure 1.2 is a plot of the readings obtained from these three sensors after convolving the data through a one-hour-wide running-average smoothing kernel. One can immediately note two temperature increases. These correspond to controlled heating events which were carried out in order to decontaminate the mirrors. Any future heating events will display a signature similar to these two heating events (note that the RVS heaters were switched off as part of a one-off test before the second decontamination in this time range, so, under nominal circumstances, this temperature drop will not be repeated). The top axis on Figure 1.2 displays the number of days after Gaia launch, while shown on the bottom axis are the equivalent values but displayed in a unit of six-hour spacecraft revolutions.
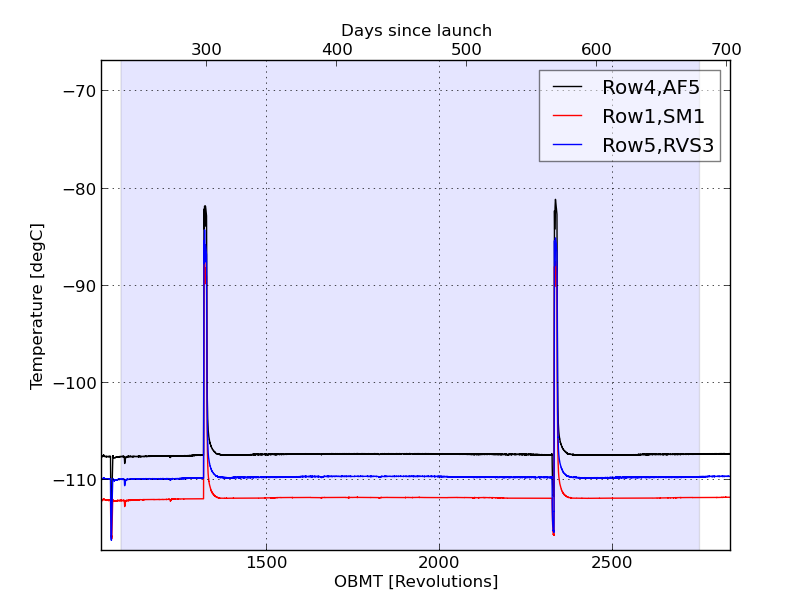
When thermal equilibrium is reached after each heating event, it can be observed that the focal-plane temperature is extremely stable. Large temperature changes can dramatically affect detector characteristics (such as CTI or gain), so long-term stability is an important aspect of the performance. There is an obvious gradient of a few degrees over the focal plane (from sensor-to-sensor), but this gradient remains stable, and the operating temperatures of all devices are close to the target value of Celsius. There is a very slow and gradual long-term evolution of the temperature readings due to the variable distance of the spacecraft to the Sun and, obviously, this changes with a period of a year, but this is a very small effect.
Parallel Charge-Transfer Inefficiency
The L environment offers many advantages for the operation of astronomical observatories, such as high thermal stability. Due to the large distance of L from Earth (1.5 million km), the effect of geomagnetically trapped charged particles is not a concern. However, it follows that L lacks the shielding of the Earth’s magnetosphere and is thus vulnerable to impacts from ionised particles from other sources. Indeed, the L radiation environment is dominated by particles (mostly protons) from the effectively isotropic cosmic rays and the more directional Solar eruptive events. The cosmic-ray component is expected and observed to be rather steady throughout the mission, with the number of impacts expected and observed to vary smoothly and to be anti-correlated with the Solar cycle (see Section 1.3.3). In contrast, the impacts of particles from Earth-directed Solar events are sporadic with more events expected and observed around the time of Solar maximum.
The most worrying effects of radiation on the Gaia science performances are expected to be due to performance degradations of the detectors over time. The most important effects are due to two main sources: 1) ionising radiation damage, and 2) non-ionising radiation damage.
The effects of ionising radiation on the detectors are cumulative and occur when charge builds up on parts of some electronic devices which can result in threshold shifts, charge leakage, etc. A special calibration procedure is periodically run on-board to monitor the accumulation of charge in the oxide layers of the CCD detectors; this is further described in Section 1.3.3.
The lattice displacement damage to the CCD silicon layers is the biggest radiation threat to the achievement of the Gaia science performance goals. The generation of new energy levels between the valence and conduction bands in the silicon produces crystal defect sites that trap electrons from traversing charge packets, to be released from the trap at some later moment in time. This results in a smearing of the images that are readout from the CCD that cannot be calibrated in a simple manner. Indeed, Charge Transfer Inefficiency (CTI) of the CCDs was identified as a potential threat to the mission at an early stage. CTI in the transfer through the serial (readout) register is discussed in Section 1.3.3; however, Gaia is most sensitive to CTI in the image area (along-scan direction).
The most important hardware mitigation for along-scan CTI effects is the periodic injection of charge into the devices. This is carried out every seconds for AF1 and AF2-9 devices and seconds for BP and RP devices. This scheme sees four contiguous lines of charge injected into the CCD and clocked out through the TDI lines. This serves to periodically fill trapping sites with injected electrons, thus preventing the trapping of photo-electrons. Indeed, for those traps with characteristic release time scales on the order of seconds, these traps will be kept filled over the period of the charge injection, thus keeping them effectively permanently filled and thus rendered effectively inactive. The regular presence of the injection features in the data stream also means that the CTI effects on the injections can be used to monitor the evolution of the trapping and release effects on the detector over time. One such diagnostic is what is known as the First Pixel Response (FPR) and is measured by computing the number of electrons removed from the first injected pixel line through trapping (in practise, we also need to account for trapping from subsequent lines).
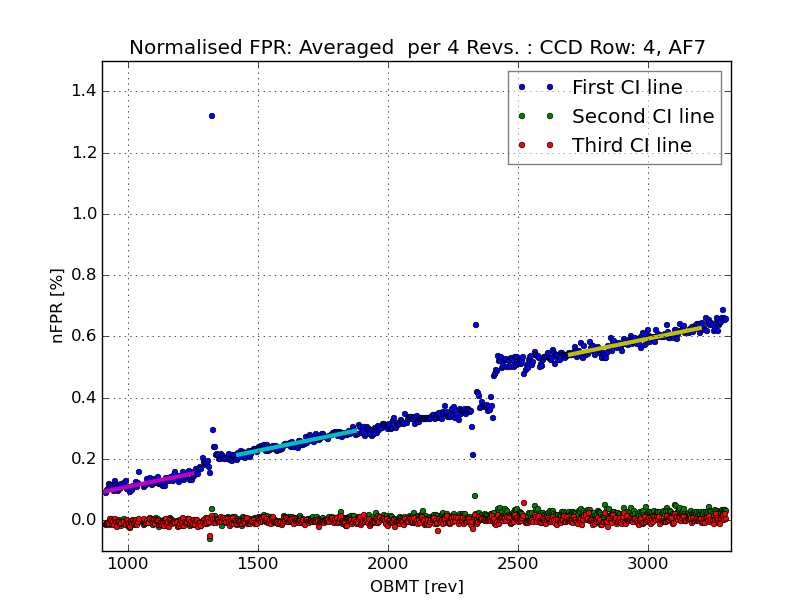
Shown in Figure 1.3 are the FPR results (normalised by the charge-injection level) for the AF7 CCD on row 4. The steady increase in CTI is apparent and is thought to be due to the low-energy tail of the Galactic cosmic-ray impacts. The two step increases are correlated with two Earth-directed proton events.
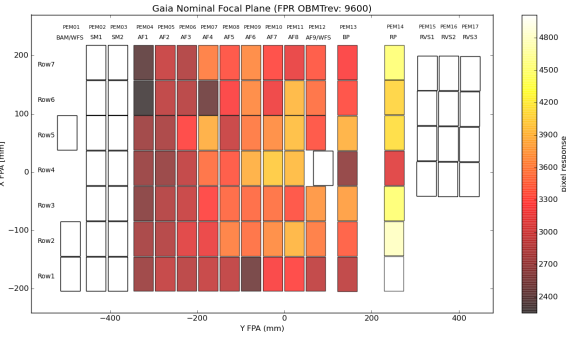
The almost linear degradation in the transfer efficiency is noticeable and rather similar for all devices. However, the effects of the Solar proton events are heavily affected by the differential shielding across the focal plane. Therefore, the net CTI observed in each device is a convolution of the (low-level) initial pre-flight CTI due to traps generated during the manufacturing process, the effect of the cosmic-ray impacts, and the effects of the Solar protons. Shown in Figure 1.4 is the result of the extrapolation of in-flight FPR measurements to the nominal end-of-mission time for Gaia. The higher CTI FPR values for the RP CCDs are apparent and caused by the higher inherent along-scan transfer inefficiences for these devices that were already measured pre-launch. Also apparent in this figure is a pattern showing higher FPR values towards the centre of the focal plane, which is a result of the shielding. However, the most important result that can be derived from these data is that the now-predicted end-of-mission CTI values are approximately an order of magnitude less than was feared before launch.
Furthermore, offline studies of the image shapes as a function of the time since charge injection have confirmed that the effects of CTI in the along-scan direction are low. A full analysis of the effects of CTI on the science data will become possible with time as more calibrations are carried out in the iterative data processing. Note that no periodic charge injection occurs in the SM and RVS devices, however. The CTI in the along-scan direction in these (and the other) devices is monitored through special calibration activities that take place every three to four months. The results are consistent with those presented here for the AF, BP, and RP CCDs. See Crowley et al. (2016) for a full discussion of the effects of the radiation environment on the Gaia detectors over the first two years of the mission.
Serial Charge-Transfer Inefficiency
A common technique for monitoring the CTI in the serial (readout) registers of CCDs is to generate charge in the image area and then monitor any trailing into the post-scan samples after the charge is transferred through the serial register. Since the Gaia VPUs are not capable of generating nominal packets containing post-scan samples, a special calibration is run periodically where five different levels of charge are injected into each science device (apart from SM devices, where the definition of the CCD operating mode precludes the acquisition of post-scan pixels). At the same time, ‘Virtual Objects’ (VOs) are placed over the end of the image area (in order to monitor the injected charge level) and are also used to acquire post-scan pixels. To circumvent the problem where post-scan samples cannot be stored in nominal packets, the engineering functionality of SIF is used to gather the raw PEM data which is subsequently down linked in a special packet with high priority. Since radiation damage has been lower than expected, it is currently sufficient to run this activity with a cadence of somewhere between three to four months.
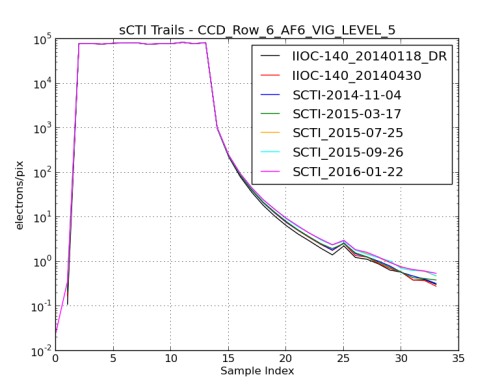
At time of writing (mid 2016), there have been seven runs of the serial-CTI calibration in-flight. These runs allow the tracking of the evolution of the CTI in the serial register. However, it is found that the CTI is still dominated by the traps that have been present since device manufacture. Shown in Figure 1.5 are data derived from each run of the activity so far for the AF6 device on CCD row 6, and for the highest injection level. The co-added, high S/N cuts in the across-scan direction show the two pre-scan samples, followed by image-area samples showing the injected charge, and then the trailing into the post-scan samples due to the release of the injected electrons from traps in the serial register. In Figure 1.6, the very slow evolution of the serial CTI curve from run-to-run is readily apparent.
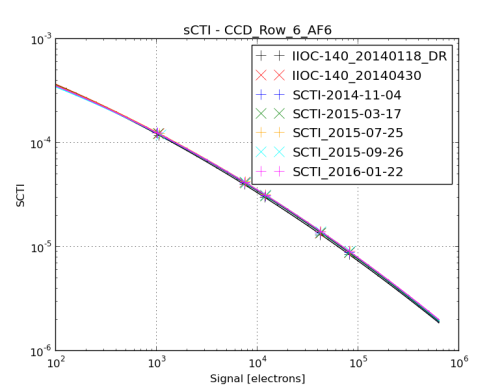
This slow evolution of the serial CTI (the continued domination by pre-flight, manufacturing traps) is apparent all across the focal plane. In summary, CTI in the serial register is still dominated by the traps inherent to the manufacturing process and the radiation-induced degradation in CTI, whilst clearly measurable, is of the order of a few percent of the pre-flight CTI (–% for AF/BP devices and –% for the thicker red devices, which had much lower native CTI to begin with). So, similar to the situation for the CTI in the along-scan direction, the CTI effects of radiation damage in the serial register are low.
Non-uniformity calibration
As discussed in detail in Section 2.3.5, the electronic readout of the Gaia CCDs suffers from variations within a TDI line which have a non-trivial dependency on the exact readout scheme. Since most CCDs are operated in a windowing mode, where the exact locations of the windows depend on the sky, it follows that a constant reconfiguration of the readout scheme is applied to most devices. There is a model of the offset variation as a function of various readout parameters that needs to be calibrated periodically throughout the mission in order to properly correct these offsets. Some details on the various effects are discussed in Section 2.3.5; here we discuss only the status of the special on-board calibration that is carried out to calibrate the model.
During the non-uniformity calibration activity, the VPUs are, one-by-one, taken out of operational mode and artificial ‘Virtual Object’ (VO) detections are placed into the VPU algorithms. These detections result in empty windows to be readout from each device as the objects are propagated across the various science CCDs in the row controlled by that VPU. The VO patterns are designed to sample different readout configuration timings and are used to calibrate the offset non-uniformity model.
The nominal cadence of each run has settled to be between three to four months and, to date, the activity has been performed on-board nine times. The data gathering has mostly been successful. However, some issues related to the CCD gates and an on-chip cross-talk effect during gate-activation commands resulted in some optimisations being performed for specific devices in order to get the highest-quality data.
CCD cosmetic defects
All CCDs are manufactured with a number of non-perfect, or defected, pixels. These can be manifest in a number of ways, but typically there will be a number of pixels which are under-responsive in comparison to the surrounding population, and a number that exhibit elevated signal levels, even in darkness. Due to the TDI operation of the Gaia CCDs, such pixel defects will be smeared out in some form due to the fact that the signal has been integrated over all CCD image-area pixels in the column before reaching the serial register. Of course, for gated observations, the effective integration distance is shortened, so it may be that a defect pixel far from the serial register produces an effect in the non-gated data, but not in (all or some of) the gated data. In addition to these fabrication cosmetics, there are radiation-induced defects created and evolving in-orbit.
For Gaia, apart from the standard need to characterise CCD defects for the processing of the science data, it is also important to take them into account in order to ensure correct operation of the on-board detection (the SM CCDs) and confirmation (the AF1 CCDs) chains. Defects and evolution in dark-signal non-uniformity (DSNU) need to be tracked and updated on-board.
The locations and characteristics of these defects were diagnosed pre-flight and stored in the VPU memories for the on-board processing of the SM, AF1, and RP windows (the RP-window data is used on-board to provide a red magnitude for each object which is used as input when deciding whether an RVS window should be assigned for an object or not). So far, only one on-board change has been required in order to update the DSNU table for one SM CCD which contains a weak (15 ADU), radiation-induced hot column.
When analysing the whole focal plane using the analysis of defect pixel evolution as described in Section 2.3.4, it is found that the number of radiation-induced defects is low. The sensitivity of the analysis to weak defects will increase during later data-processing cycles and more detailed statistics will become available with progressing mission duration (for further detail on defect pixel evolution, see Crowley et al. 2016).
Flat-band voltage shift
Radiation-induced generation of electron-hole pairs in the CCDs cause a gradual accumulation of positive charge on the CCD gate oxide layers over time. The end result is an effective change in the potentials under the gates of each of the CCDs, which is termed a ‘flat-band voltage shift’. The CCD operating point is set to tolerate the maximum expected end-of-mission flat-band voltage shift of V, but the trend over time needs to be monitored in case steps need to be taken to avoid any degradation in the performances of the devices. In principle, any effect can be compensated for by changing the operating voltages of the devices by an appropriate amount. A periodic run of a special calibration activity on-board is required to monitor the evolution.
During this activity, charge-injection data is acquired from every CCD and the potential under the injection drain () is successively increased from a low value of V in order to find the value at which charge stops being injected (this point, the turn-off voltage, corresponds to the point at which the equals the potential under the injection gate). The potential under the gate will evolve with increased charge accumulation in the oxide, but the potential under the drain should remain unaltered since it is connected directly to the silicon. Thus, the change in operating point over time diagnoses the flat-band voltage shift. The activity is being run throughout the mission with a cadence of 6–12 months; so far, it has been run on-board three times, including a dry-run of the activity shortly after launch.
The average and standard deviation for the on-ground-measured turn-off voltages for the 106 flight devices is V. A comparison with in-orbit data so far shows no clear evidence for a measurable flat-band voltage shift beyond the measurement noise for any one device. However, the mean shift over all devices between the on-ground measurement and the June 2015 on-board measurements is V. Therefore, after extrapolation, it is currently expected that flat-band voltage shifts will not cause detector performance issues before the end-of-mission. It should be noted that for future runs of this activity, the sampling will be optimised for each CCD in order to reduce measurement noise.
Prompt particle events
The object detection algorithms running on-board Gaia scan the images coming from each Sky-Mapper (SM) CCD in search for local flux maxima. For each local maximum, spatial-frequency filters are applied over the flux distribution within a samples window centred around the local flux maximum. Objects failing to meet star-like PSF criteria (too sharp or too smooth PSF) are rejected. For full details on the object rejection strategy, see de Bruijne et al. (2015).
This filtering mechanism takes place at the SM CCDs but is followed by a confirmation stage in the AF1 CCDs that further removes those objects that, having been detected in SM, do not re-appear in AF1, typically cosmic rays or Solar protons. Detection-process statistics (e.g., the rejected number of cosmics) are telemetered to ground in the form of auxiliary-science-data packets. These are only counters (in fact a ‘by-product’ of the detection chain) and neither energy nor nature of the impacting radiation particles are provided.
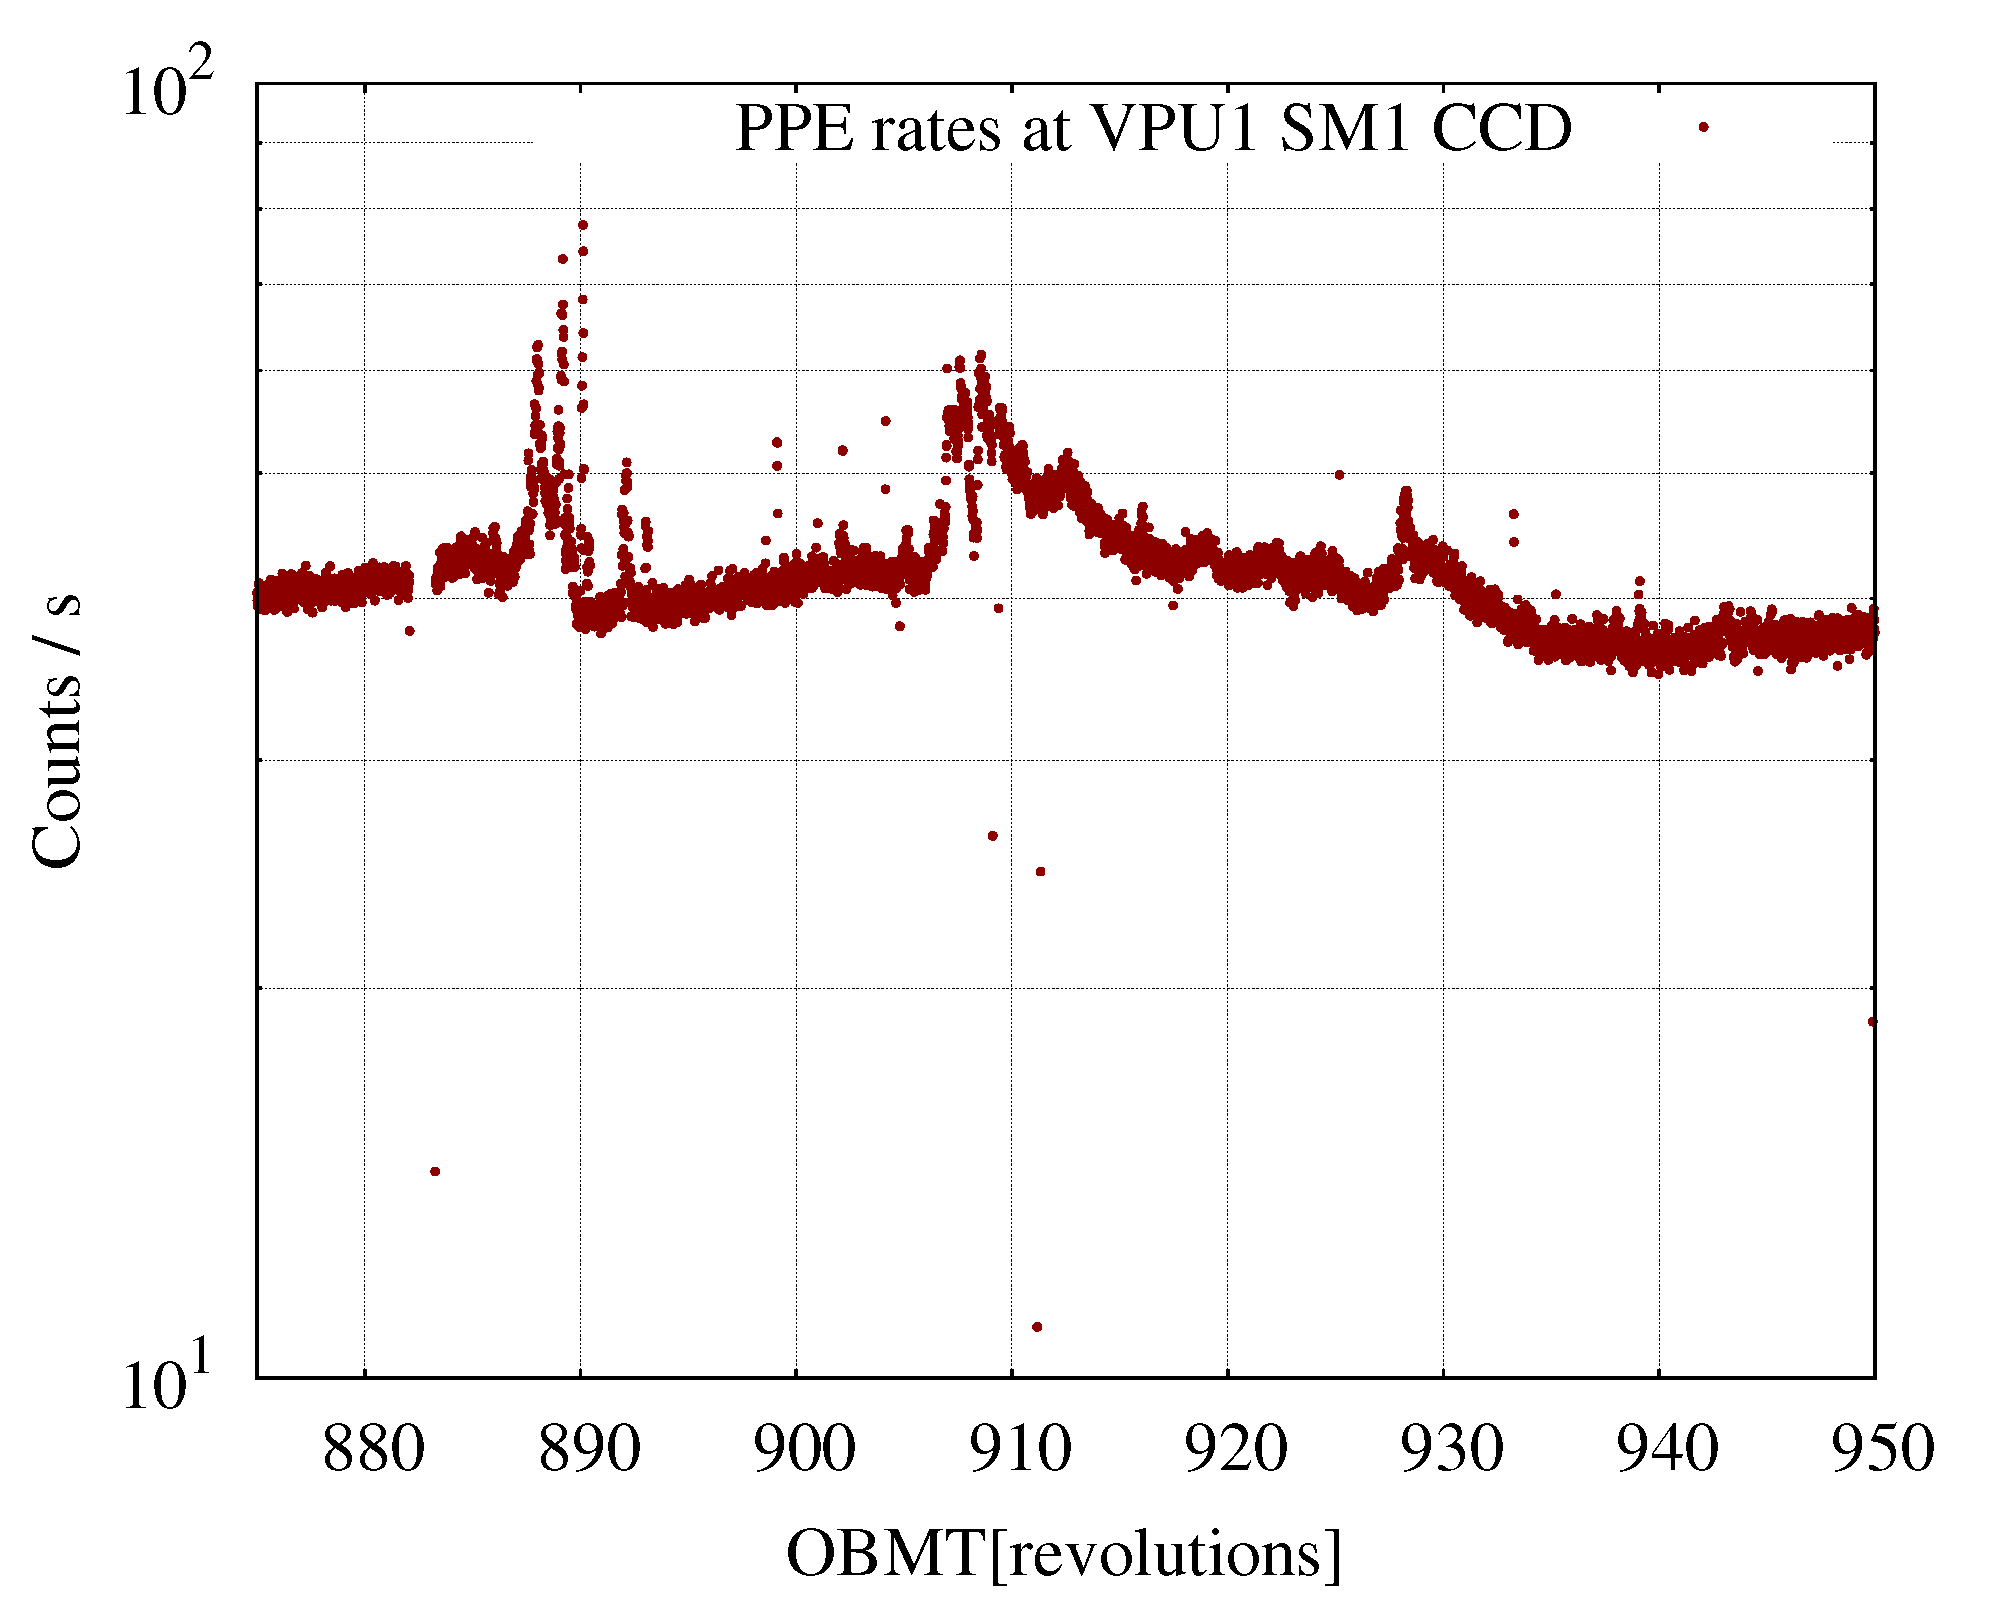
Figure 1.8 shows the typical prompt-particle-event rates extracted from the auxiliary science telemetry. The prompt-particle-event time lines contain two main features, namely (1) ‘peaks’ of counts (expectedly) concentrated around times of increased radiation activity, and (2) a ‘background’ count rate (at 40 counts s) which is present at all times, on top of which Solar activity shows up.
The predicted background rate measured at each CCD (SM or AF) produced by an incident isotropic flux of cosmics can be estimated using Sullivan (1971) and is given by:
| (1.1) |
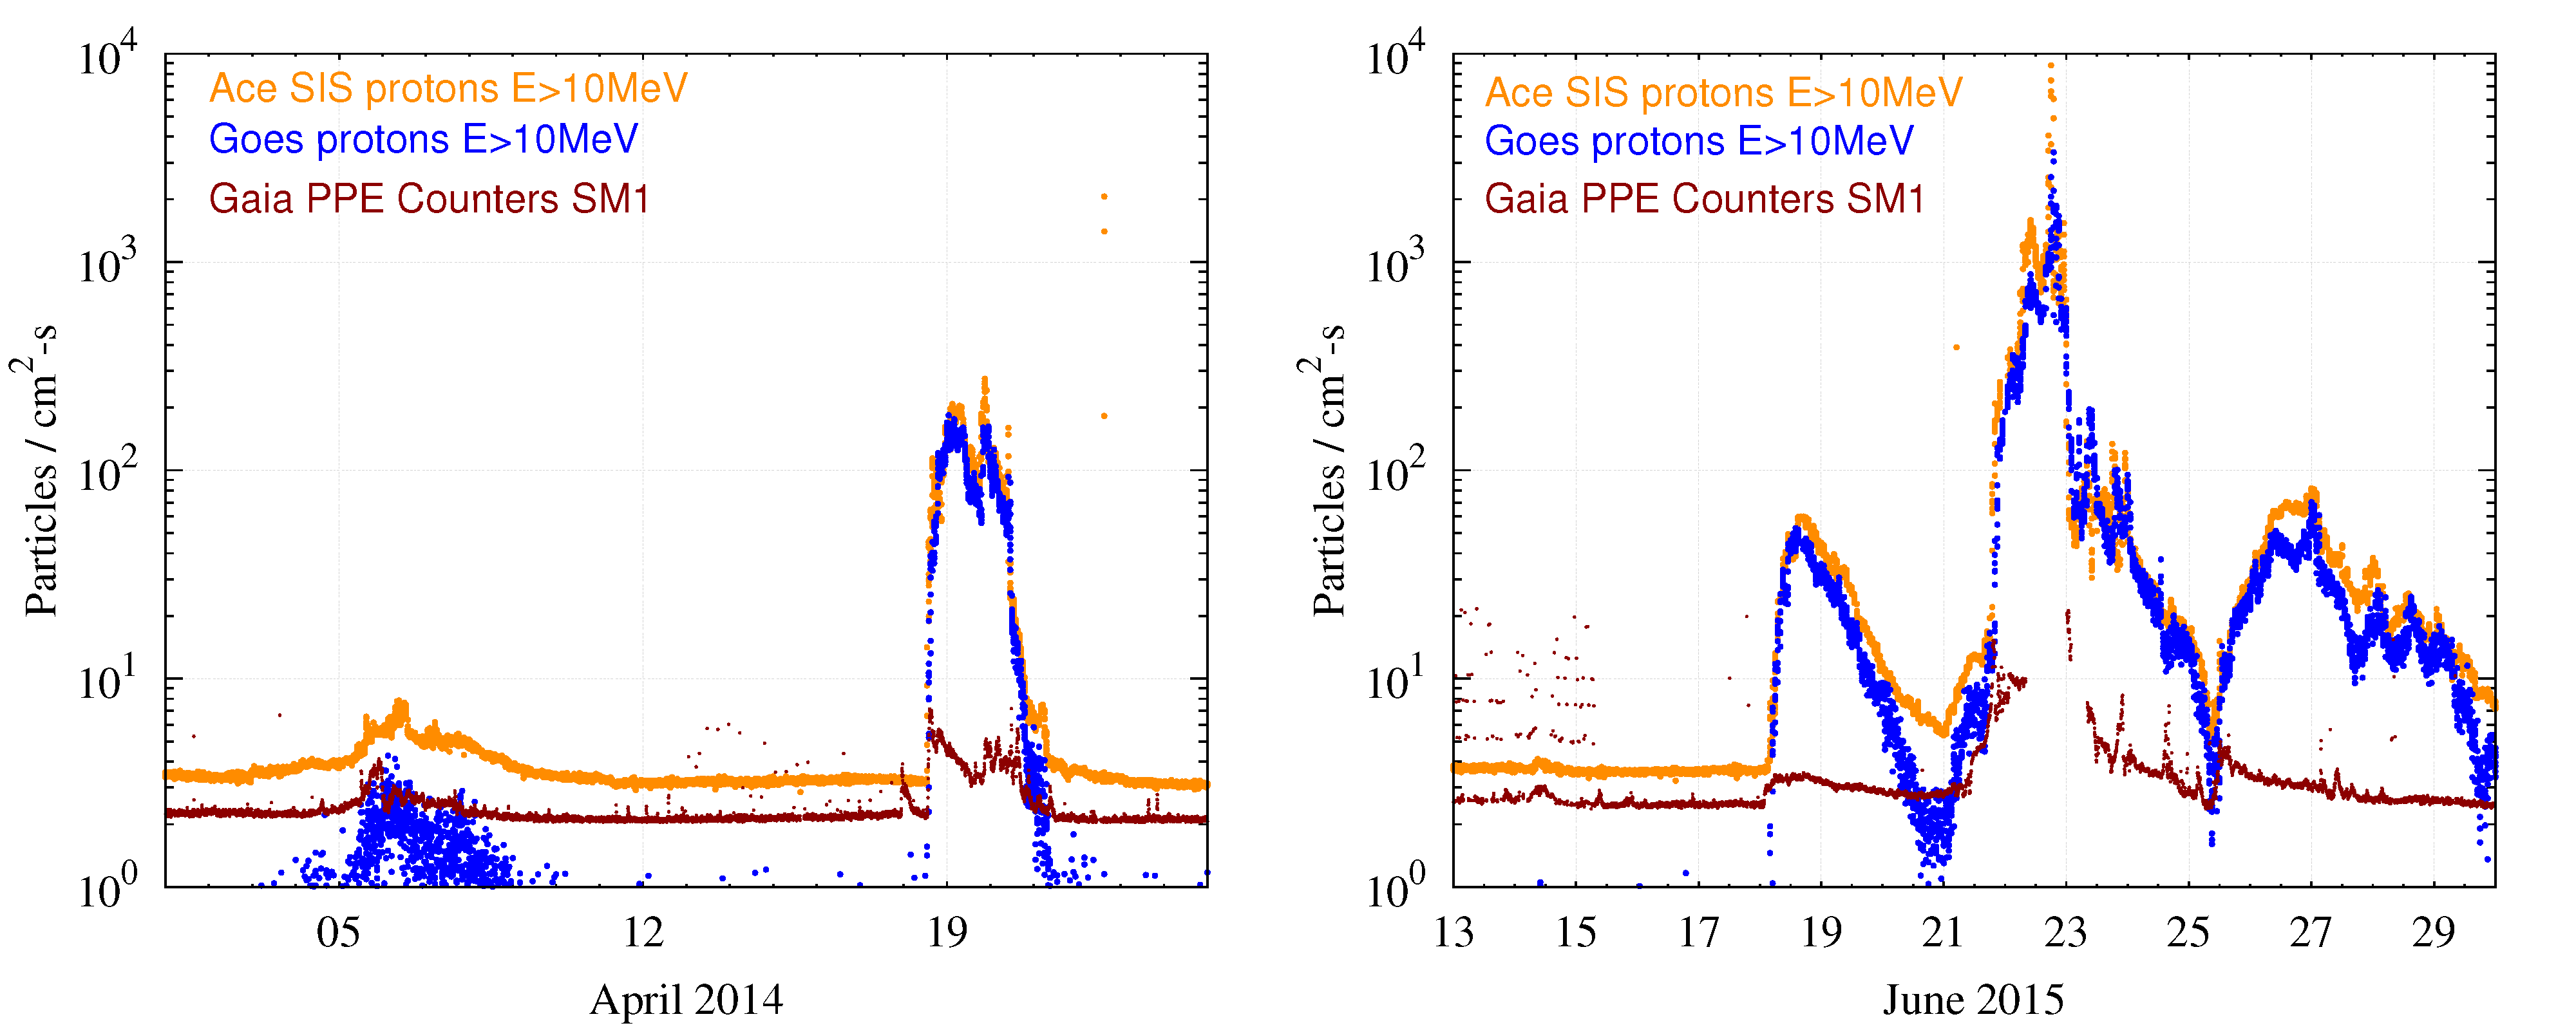
where is the effective detection area of the given detector in cm ( cm for SM CCDs) and is measured in particles cm s. For a typical (Barth et al. 1999; Catalano et al. 2014) particle background at L of 5 protons cm s, the expected prompt-particle-event rate measured by Gaia at L should be 42.75 counts s, which is in good agreement (10% difference) with actual measured rates. The peaks in the prompt-particle-event counters are clearly correlated with increased Solar activity. We thus compared Gaia prompt-particle-event counters against other spacecraft’s radiation monitoring instruments data (ACE: http://www.srl.caltech.edu/ACE/; and GOES: http://www.swpc.noaa.gov/products/goes-proton-flux) over the same time scales to perform an external consistency check. Figure 1.9 shows a couple of such qualitative comparisons for ‘strong’ Solar events. We found systematically that Gaia prompt-particle-event counters are following the increase in the Solar radiation particles (protons) measured by the other dedicated radiation monitoring instruments. The Gaia focal plane being shielded inside the thermal tent structure of the spacecraft should systematically measure lower particle fluxes than the other instruments, as a good fraction of the incident particles on the spacecraft will be blocked by the thermal-tent materials. Both analyses give confidence on the robustness of the Gaia on-board autonomous detection/rejection algorithms.
Cosmics impacting on a CCD produce (displacement) radiation damage. The traps created in this process degrade the nominal charge-transfer times of the photo-electrons during the readout in TDI mode as charge is trapped and released. This degradation in the charge-transfer efficiency – or CTI effect () – is known to introduce a bias in the star’s centroid position estimation (Prod’homme et al. 2012). On-board measures are taken to mitigate this effect, e.g., activation of regular charge injections that help fill the existing traps.
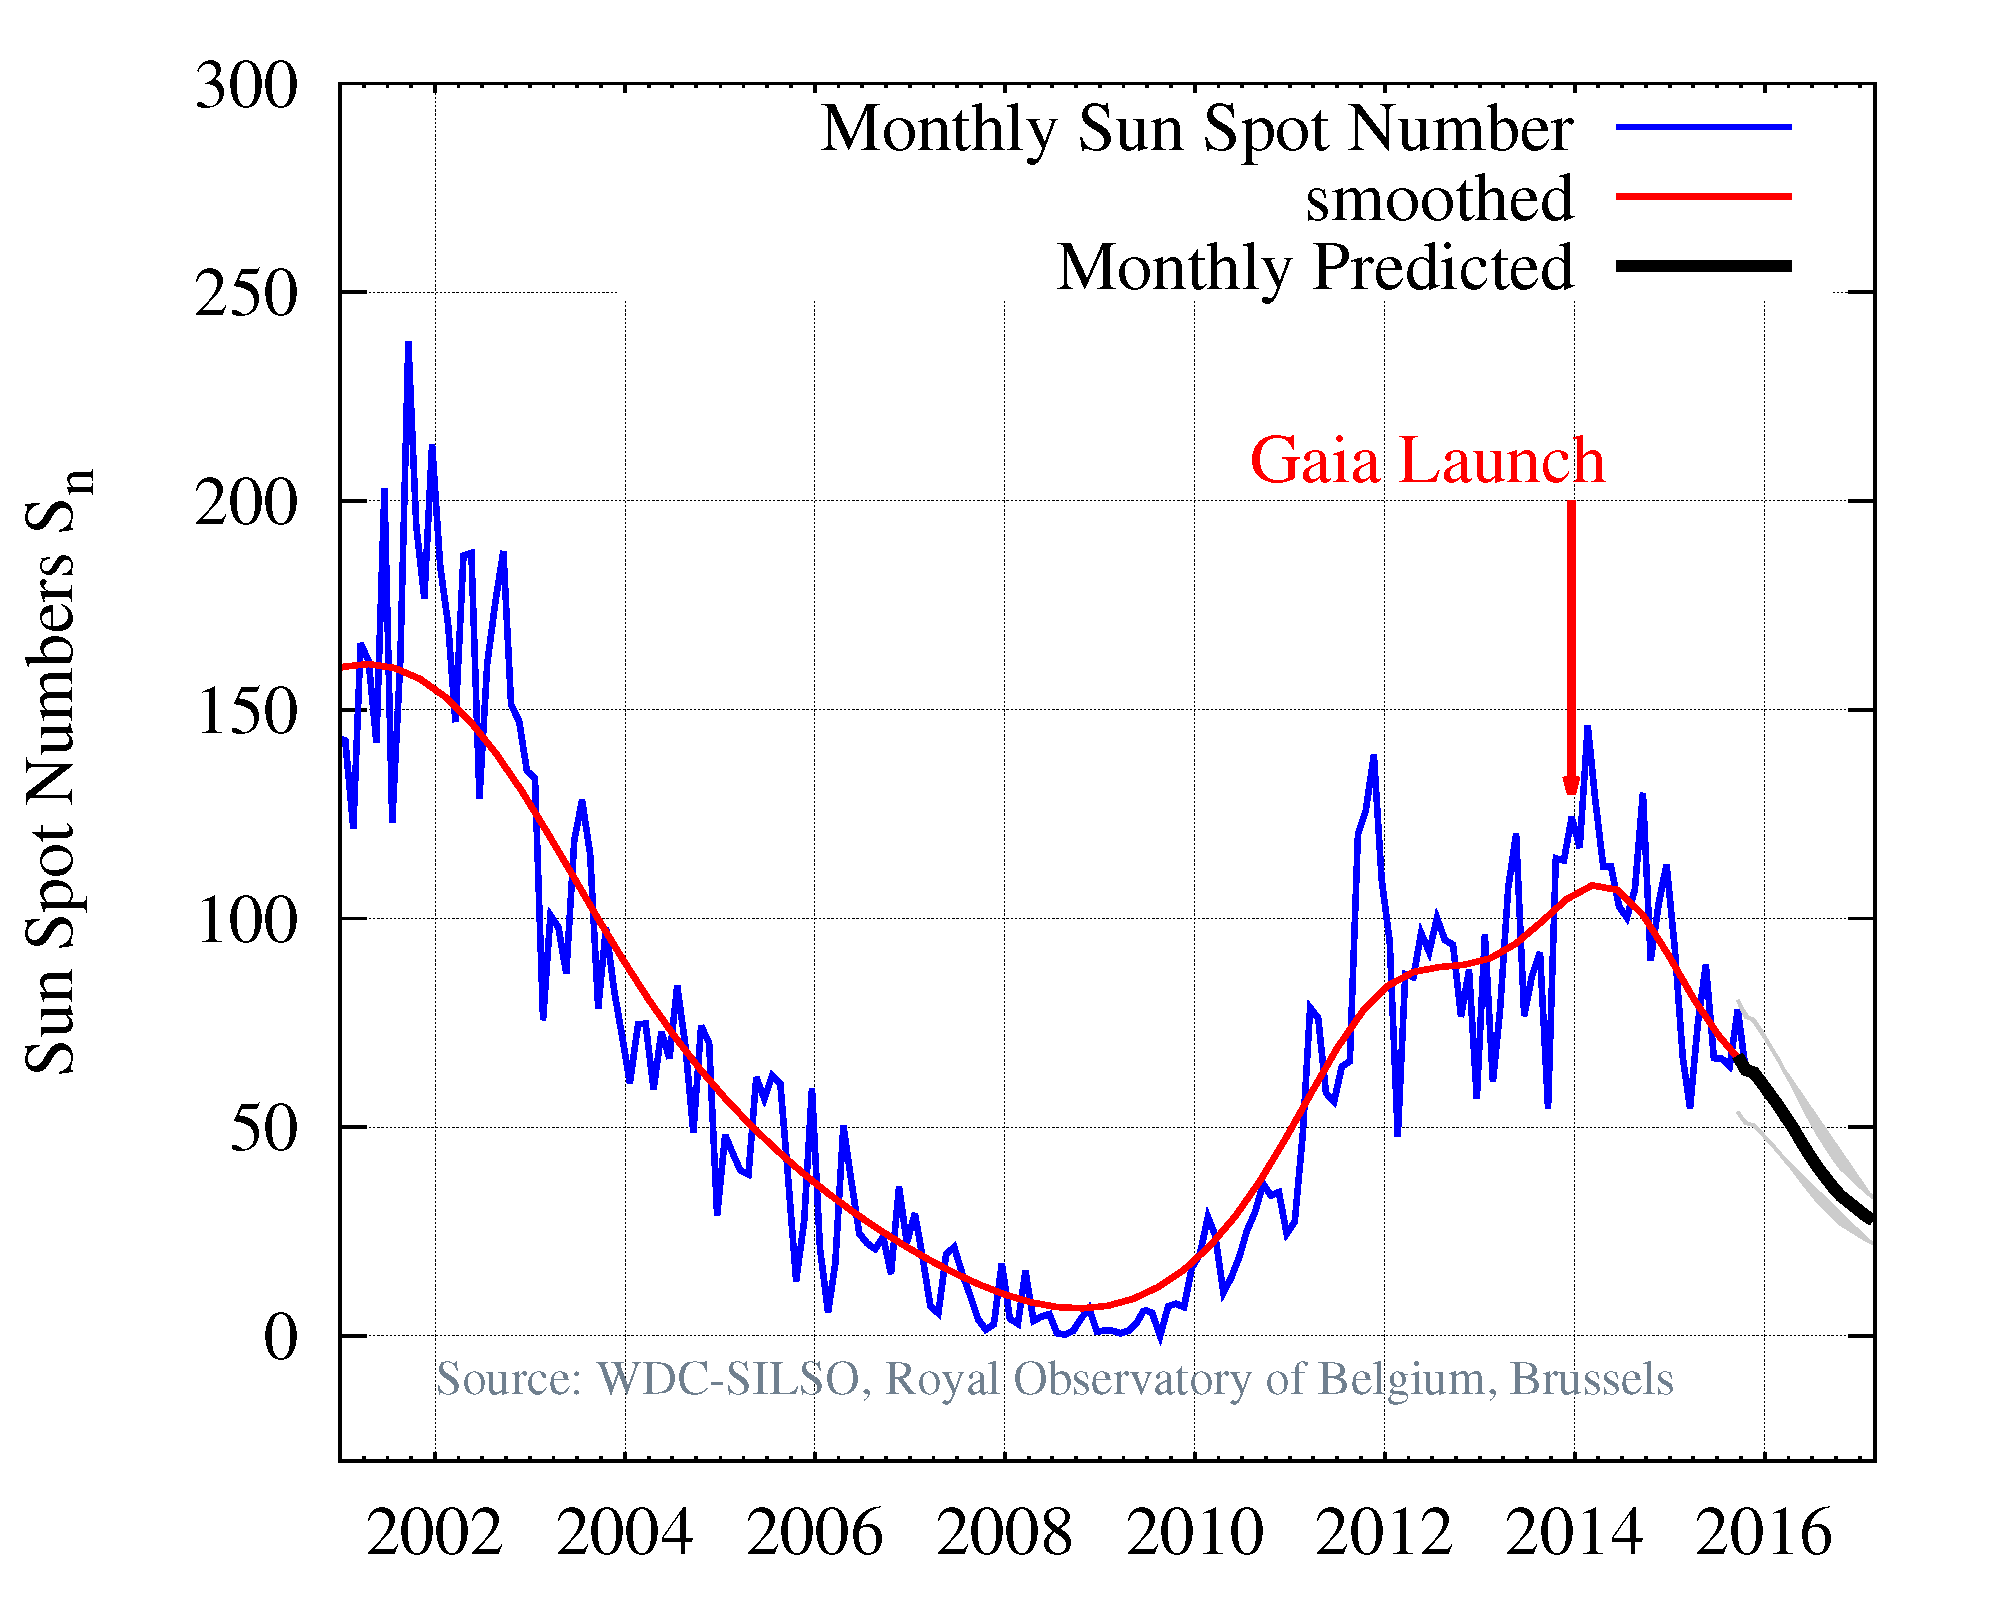
Gaia was launched in December 2013, just after the maximum of Solar cycle 24. Solar activity is therefore expected to progressively decrease towards Solar minimum (see Figure 1.10), resulting in a ‘benign’ (a-priori) situation from a CCD radiation damage perspective.
The Gaia prompt-particle-event counters are regularly used to monitor the instantaneous radiation environment experienced by Gaia at L and its possible implications for radiation damage. For a quantitative assessment, however, first-pixel-response analysis is used to study the level of radiation damage accumulated by the Gaia CCDs.
Focus
Before launch, it was expected that the Gaia telescopes focus would be very stable. In this way, the best focus would be obtained during commissioning and kept constant throughout the mission. The M2 mirror mechanisms (M2MMs) were not envisaged to be used during the nominal mission, except in case of a major anomaly. However, the focus has continuously evolved during the mission. Due to its direct impact on the mission performance (astrometric precision and spectral resolution), the First Look pipeline provides a suite of diagnostics, monitoring its behaviour on a daily basis. The astrometric precision is the most sensitive parameter, and can be estimated via the Cramér-Rao metric, as explained in Lindegren (1978, 2010):
| (1.2) |
where is the maximum along-scan centroid location precision for a given star and CCD transit (that is, the along-scan astrometric information contained in an individual sample image), is the total number of electrons for an infinite focal plane, is the normalised PSF multiplied by , that is the number of electrons collected from the star for each pixel , is the derivative of with respect to the along-scan pixel coordinate, the readout noise (in electrons), and the homogeneous sky background (in electrons). This equation can be used to estimate how close any given PSF or LSF centroiding method is to the maximum theoretical performance. However, a very good knowledge of the payload and each star is needed to provide accurate estimates, including oversampled average PSFs with colour and across-scan dependence. However, relative measurements are much simpler:
| (1.3) |
where is a normalised metric independent of the actual stellar flux for bright stars where the Poisson noise dominates. For these objects, can be estimated using the actual sample values for and finite differences for . An average value can thus be provided and used for quick look payload health checks on a timely basis. The approximate method thus provides relative and not absolute measurements, and is affected by additional effects such as stellar colour, across-scan position, or sub-pixel position. However, its simplicity provides a very useful proxy to determine the overall focus evolution trend, and whether a refocus is needed.
Figure 1.11 shows the history of the AF image quality for each field of view averaged over all CCDs throughout the mission, estimated using all unsaturated, un-gated, class-0 observations. Several things are apparent. First, the values are always close to and mostly below one, as expected for good-quality, near-diffraction-limited telescopes. Second, the focus has never been completely stable. Third, there are sharp discontinuities introduced by payload decontamination. Some optical quality is always recovered as a result. However, fine adjustment (refocus) has sometimes been applied afterwards. Fourth, the degradation slope is becoming smaller as the mission evolves, which points to an increasingly stable payload. Table 1.3 lists the payload decontamination and refocusing events that have happened during the interval covered by Gaia DR1 (commissioning has been explicitly excluded).
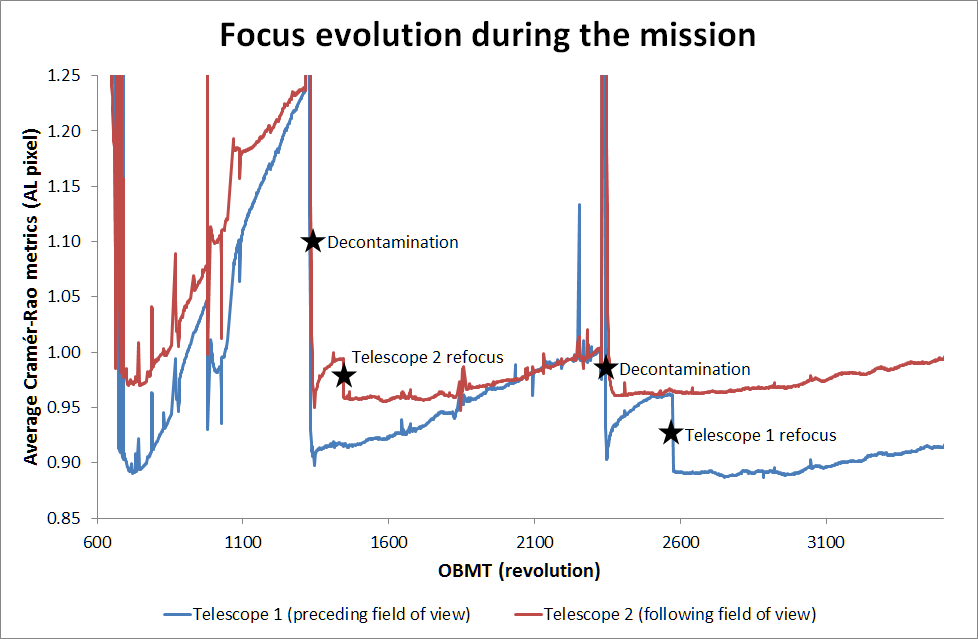
| UTC | OBMT | Event |
| 2014-09-23 | 1317 | Payload decontamination |
| 2014-10-24 | 1443 | Refocus following field-of-view |
| 2015-06-03 | 2330 | Payload decontamination |
| 2015-08-03 | 2574 | Refocus preceding field-of-view |
Notes. The time interval covers Gaia DR1 only. Approximate dates (UTC at Gaia) and OBMT (revolutions) are provided.
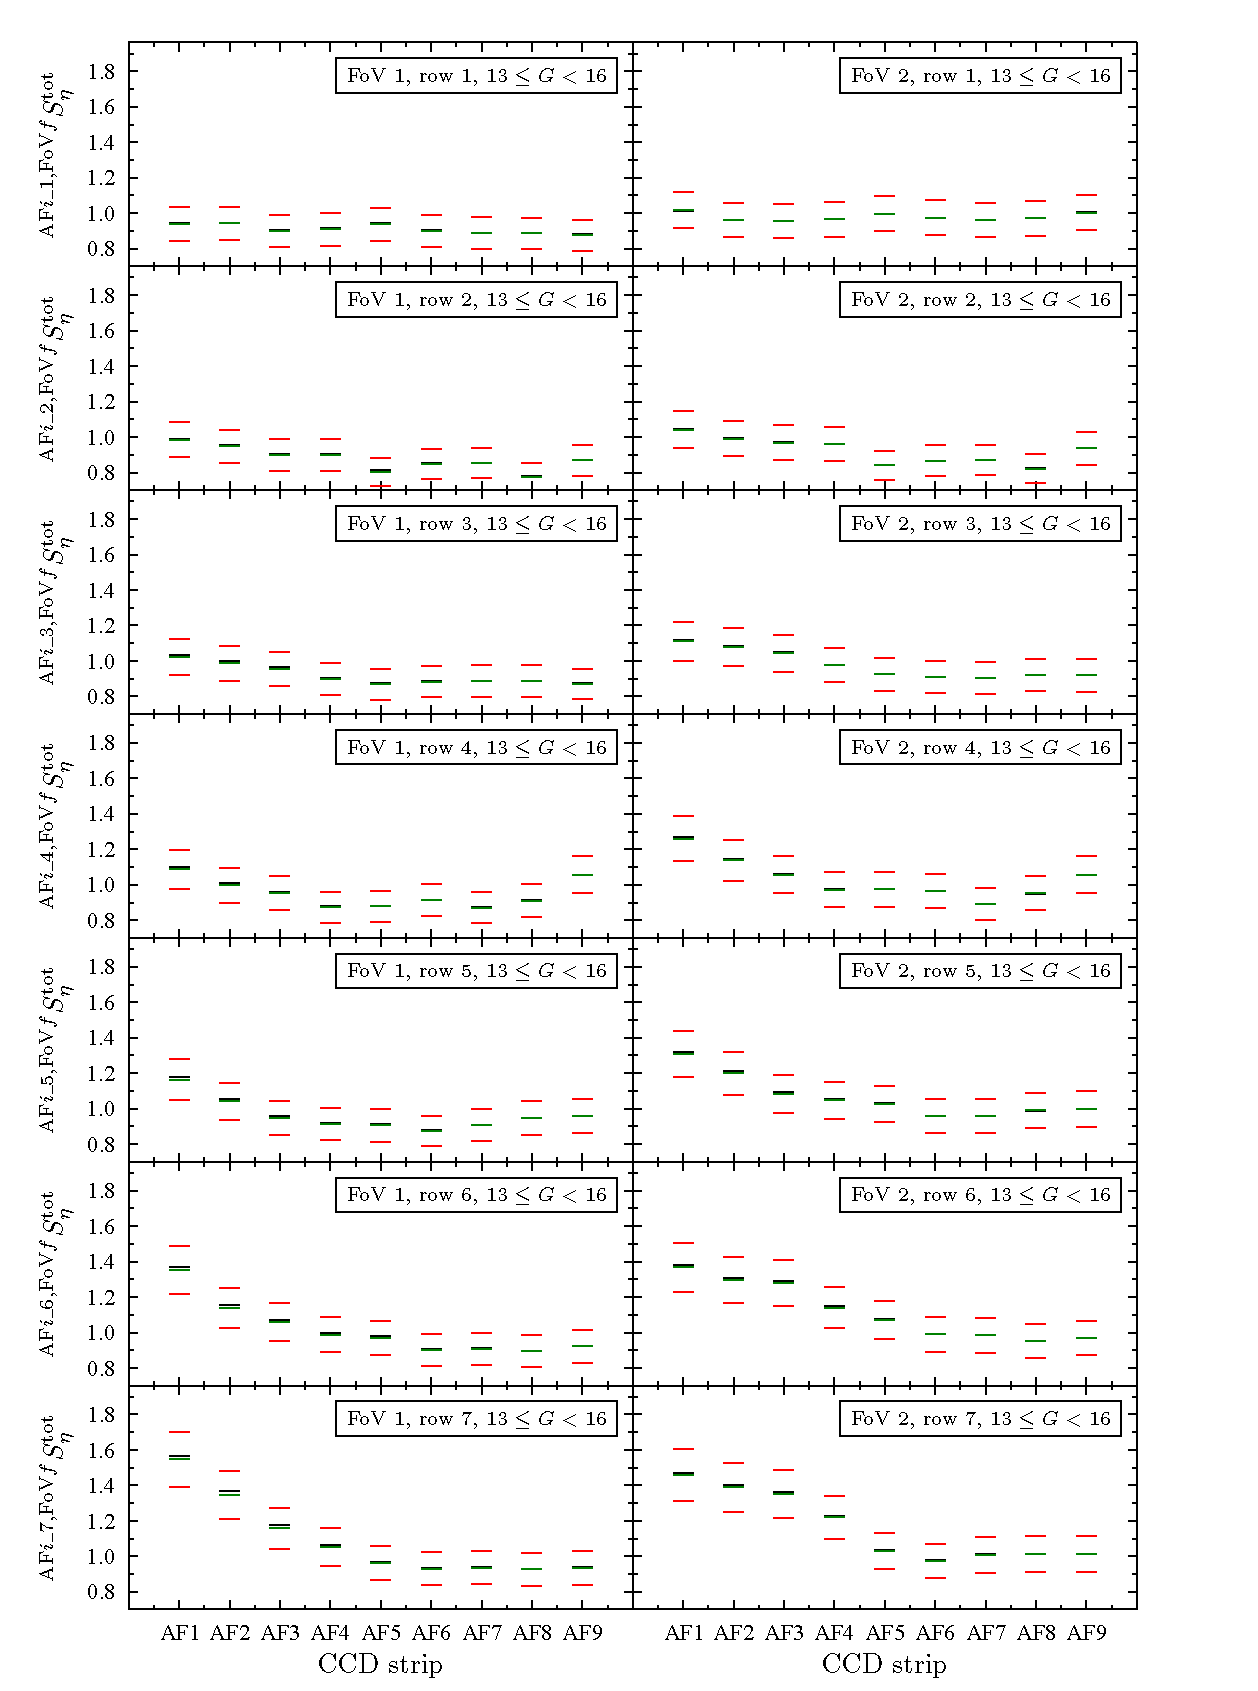
More detailed information is provided by the daily First Look diagnostics. Figure 1.12 shows the average relative AF image quality for each CCD and field of view, as estimated during a typical interval (OBMT: 3536.78056 – 3540.50363 [revs], UTC: 2016-03-31T00:54:21 – 2016-03-31T23:14:39). The field-of-view dependence of the astrometric quality is apparent. The optimum values are typically obtained for CCD strips AF5 to AF8. These variations are expected for the large field-of-view covered by Gaia.
Transmission
It became clear in the early commissioning phase that the response in AF was degrading rapidly, and especially for observations in the following field of view. In addition, the degradation had a clear colour dependence.
After heating of the mirrors and the focal plane, the response was fully recovered, showing that the extinction was due to ice deposits at least on the mirrors. The temperature at which the recovery took place was consistent with a contaminant of water ice, and this was and still is considered the most likely explanation.
After decontamination, the response degradation soon returned, and a total of five de-contaminations have been carried out so far (mid 2016). Fortunately, the build up of new ice layers is slowing down substantially, as demonstrated in Figure 1.13, and only a very small number of de-contaminations will still be needed in the future.
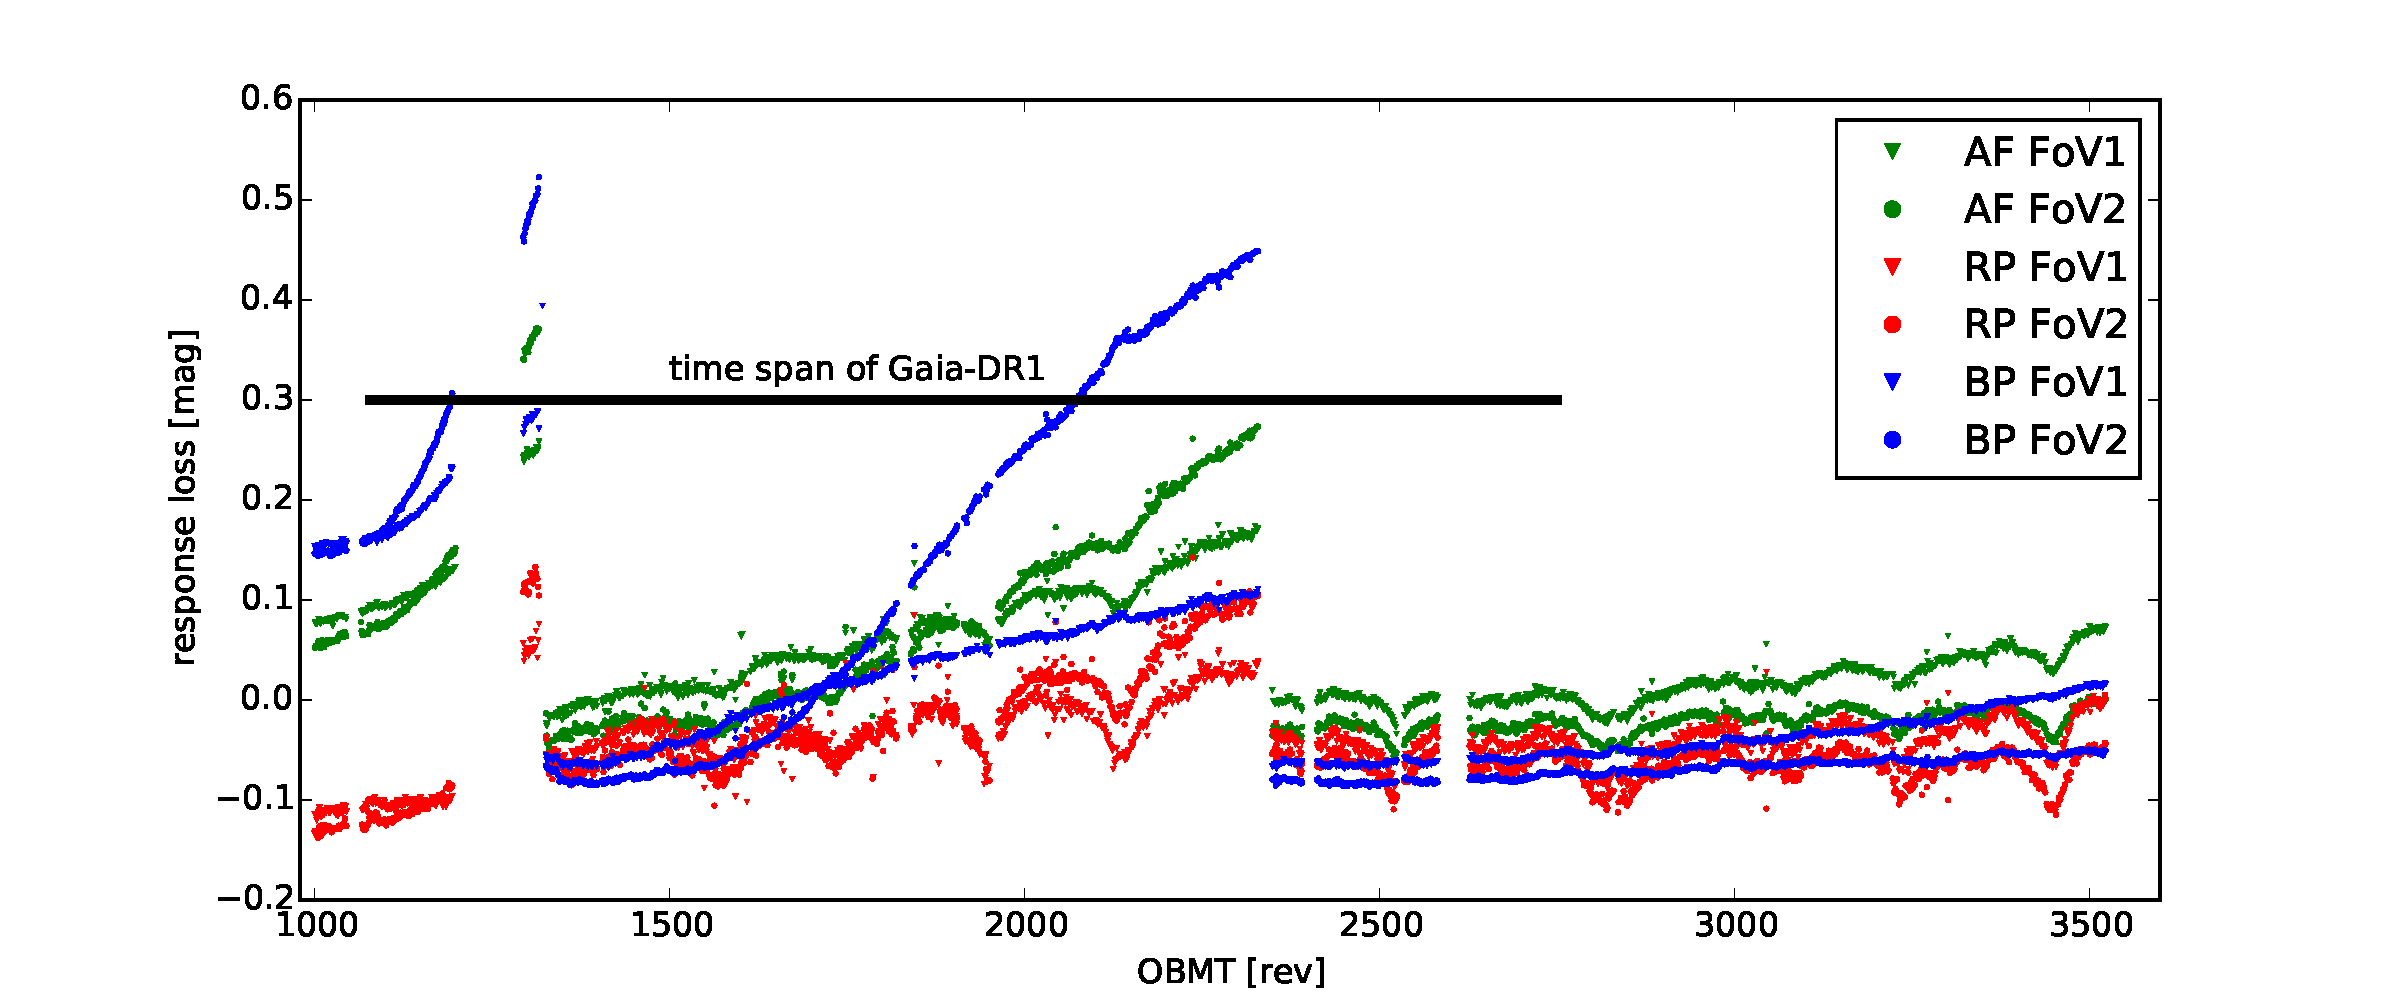
The response has been monitored closely since the early commissioning, using the photometry from the Tycho-2 catalogue (Høg et al. 2000). Tycho-2 was chosen because it contains a sufficient number of sources all over the sky, easy to identify, and with good-quality astrometry and photometry. At the same time, average relations between Tycho photometry and the Gaia broad-band , , and magnitudes had already been established before launch, using methods explained in Jordi et al. (2010).
The precise photometric relations depend not only on the spectral type of the star, but also on the amount of reddening. The reddest sources were therefore not used in the response monitoring. Even so, Figure 1.13 shows artificial response variations that occur in step with changes in the average colour of the stars, especially for the magnitudes. This, however, does not affect the overall trend, which is the objective of the monitoring.
As a consequence of the response variation, there has been a corresponding variation in the magnitude limit for the Gaia observations. This is so because the detection limit is defined as a certain, fixed flux level, so when contamination builds up, the limit is (up to) a few tenths of a magnitude brighter.
VPU configuration
The Video Processing Units (VPUs; Section 1.1.3) assign, among others, the window size, sampling class, and observation priority to each object that is confirmed for observation. The VPU algorithms (VPAs) are highly parametrised. The configuration of the VPU/VPA parameters, which is carefully tracked in the CDB, determines which objects are observed. During the time interval covering Gaia DR1, the VPU application software (VPAs) was updated on 24–28 April 2015 from version 2.7 to 2.8. Version 2.8 allows enhanced flexibility in the areas of the RVS across-scan window size and RVS faint limit, the AF2-9 faint-star across-scan window size, the AF1 coarse-confirmation parametrisation, and suppression of SM double detections.
Detection-chain-parameter settings
During the time interval covering Gaia DR1, several changes to the detection-parameter settings were made. The Gaia DR1 interval started off with a faint SM detection threshold defined at mag. On 15 September 2014, this threshold was lowered to mag. Finally, on 27 October 2014, the threshold was changed to mag. The AF1 confirmation parameters were changed on 15 September 2014, 27 October 2014, and 11 May 2015.
Other VPU parameter changes made during the Gaia DR1 interval include a dark-signal non-uniformity look-up-table update for an evolving bright column in the SM2 CCD in CCD row 4 on 16 December 2014, an update of the RVS across-scan centring bias and offset on 3 February 2015, a patch of the AfMagToGate parameter defining the AF1 TDI gates on 20 May 2015, an update of the saturation as well as the faint detection thresholds for double detections on 4 July 2015, and an update of the adaptive RVS magnitude thresholds on 1 September 2015.
RVS window-size and RVS faint-threshold settings
The RVS end-of-mission performances were impacted by the straylight found on-board (Gaia Collaboration et al. 2016b). The modifications introduced in VPU software version 2.8 were mainly aimed to partially recover the pre-launch RVS performance. Therefore, four new RVS functionalities, controlled with a new set of parameters, were introduced: increased along-scan RVS window size, the option to have stair-like windows in RVS, an adaptive across-scan RVS window size, and an adaptive faint RVS threshold:
-
•
The along-scan size of the RVS window was increased from 1260 TDI1 to 1296 TDI1, allowing a better background subtraction. This modification is hard-coded in the software by increasing the RVS macro-sample size from 105 TDI1 to 108 TDI1.
-
•
A new VPU parameter allows to define the window shape to have a stair-like shape to allow for a slight across-scan tilt of the spectra. The default shape of the window is now derived from the rectangular shape by shifting each of the 12 macro-samples of the window towards the positive across-scan coordinates by a user-defined offset. These offset are a function of the RVS CCD strip, the field-of-view, and the across-scan position of the object in AF1. After testing and careful consideration, it has been decided to not use this functionality.
-
•
The adaptive faint threshold is defined by a new parameter which depends on phase during the six-hour revolution and across-scan position in the CCD / focal plane. Prior to the RVS resource-allocation algorithm, a new object filter based on the RVS magnitude has been added to preselect the candidate objects as function of the Sun’s azimuth (which is a good proxy for the instantaneous intensity of the stray light). During times of high stray light, the RVS faint limit can be as bright as mag, whereas at times of low stray light, it is lowered to values as faint as 16.2 mag.
-
•
The adaptive across-scan window size in RVS is defined by a new pair of parameters which are a function of the Sun’s azimuth, the RVS magnitude, the field-of-view, the RVS CCD strip, the across-scan position of the object in AF1, and the across-scan smearing. After testing and careful consideration, it has been decided to not use this functionality and operate with a constant across-scan size of 10 pixels.
Both the adaptive faint threshold and the adaptive across-scan window size use the Sun’s azimuth, which is derived on board from a simple model which needs periodic (roughly monthly) calibration / parameter updates.
PDHU configuration
Down-link priority settings and data-deletion settings are user defined and tracked in the CDB. In general, bright stars have higher priority for being telemetered to ground first and are protected on-board from being deleted. During the time interval covered by Gaia DR1, a few changes to these settings were made: the non-unity multiplexing ratios were multiplied by a factor 10 on 28 October 2014, the faint-end granularity for SP2 packets was improved on 10 November 2014, and the position of the ASD4 and BAM File_IDs in the PDHU down link priority table was swapped on 16 September 2015 so that the on-board procedure that stops the down link in case link problems are detected affects BAM data rather than ASD4 data.
1.3.4 Processing configuration
Author(s): Rocio Guerra, Javier Castañeda, Chantal Panem, Francesca De Angeli, Krzysztof Nienartowicz, Rosario Messineo
DPCE
DPCE is part of the Gaia Science Operations Centre (SOC) at ESAC, Madrid, Spain. DPCE operates software from:
-
•
CU1:
-
–
Main DataBase (MDB);
-
–
MOC Interface Task (MIT);
-
–
De-compression and Calibration Services (DCS);
-
–
Payload Operations System (POS);
-
–
Gaia Transfer System (GTS);
-
–
-
•
CU3:
-
–
Initial Data Treatment (IDT);
-
–
First Look (FL);
-
–
Astrometric Global Iterative Solution (AGIS);
-
–
-
•
DPCE:
-
–
IDT/FL DataBase (IDTFLDB);
-
–
Daily PipeLine (DPL);
-
–
Gaia Observing Schedule Tool (GOST).
-
–
As the ‘hub’ in the Gaia Science Ground Segment, DPCE is the interface between MOC and other DPAC DPCs (Section 1.2.4). This includes data retrieval from MOC and distribution to DPCs after IDT/FL processing and distribution of the MDB, i.e., receiving the processed data from the other DPCs and assembly of the subsequent version after DPAC processing. DPCE also has responsibility for interactions with MOC with respect to payload calibration and operations.
DPCE performs both daily and cyclical processing.
DPCE daily processing
DPCE daily processing aims to provide the raw observation data from the spacecraft in usable form for further processing and an initial treatment into higher-level data. The input to the daily processing is the telemetry stream from the spacecraft with initial input data from CU3 and CU5 in the form of catalogues and calibration data. This processing started during the commissioning period of Gaia and will continue until the end of spacecraft operations.
The input data set processed by the DPCE daily pipeline for Gaia DR1 corresponds to the following period:
-
•
Start time: 2014-07-25T10:29:60 UTC;
-
•
End time: 2015-09-16T16:20:00 UTC.
The principal software systems (MOC, IDT, and FL) have run with versions 17.0, 17.1, and 18.0 (including a number of patch releases to fix specific issues found during operations). The following table shows the main data types produced at DPCE that are inputs to Gaia DR1 and the total counts:
| Data type | Total counts |
| ApBackgroundRecordDt | 1 803 317 |
| AstroElementary | 21 881 483 835 |
| BamElementary | 3 050 355 |
| BaryVeloCorr | 20 233 |
| BiasRecordDt | 834 438 |
| Oga1 | 19 607 |
| PhotoElemSmo | 22 625 037 |
| PhotoElementary | 23 515 409 486 |
| AcShifts | 255 058 637 |
| AcShiftsSmearing | 90 655 739 |
| AocsAttitude | 303 342 |
| AstroObsSpecialVo | 10 196 787 |
| AstroObservation | 29 096 110 412 |
| AstroObservationVo | 136 524 103 |
| BamObservation | 3 026 236 |
| ChargeInjection | 52 881 287 |
| FailedBamObs | 320 |
| GateInfoAstro | 336 210 546 |
| GateInfoPhoto | 16 881 026 |
| GateInfoRaw | 927 625 308 |
| GateModePkt | 605 090 |
| ObjectLogAFXP | 33 010 494 473 |
| ObjectLogRVS | 2 174 653 888 |
| ObjectLogRvsRotSmear | 714 087 495 |
| PhotoObsSpecialVo | 10 196 787 |
| PhotoObservation | 29 095 929 577 |
| PhotoObservationSmo | 22 809 106 |
| PhotoObservationVo | 136 524 103 |
| PreScan | 953 420 |
| RvsResolution | 1 359 |
| SifPkt | 14 475 751 |
| SpectroObsSpecialVo | 295 886 |
| SpectroObservation | 1 930 334 418 |
| SpectroObservationVo | 69 596 589 |
| Statistics | 979 414 |
| StatsVariant | 976 872 |
| WfsPkt | 827 942 |
| ZoomGateModePkt | 2 317 976 |
DPCE cyclic processing
The cyclical processing consists of running AGIS and the MDB:
-
•
AGIS produces the main astrometric solution for the mission. The applicable version for Gaia DR1 is 18.2, generating sources (before CU9 filtering).
-
•
The MDB is the central repository for the Gaia mission data. The size of the inputs for the Gaia DR1 generation is 60 TB (excluding the processing done during commissioning). The MDB comprises a number of tools required for handling the input/output actions, assessing the data accountability, and checking the data consistency. In particular, the MDB Integrator collects all of the output data processed during the cycle and previous inputs, unifying them into a unique table of Gaia sources for publication.
In addition, DPCE receives and distributes the contents of the MDB to the rest of the Data Processing Centres using the Gaia Transfer System over the Internet. The current bandwidth between the hub – DPCE – and the other DPCs is 1 Gb s; this can be increased as needed for subsequent processing cycles.
DPCB
Background
The Data Processing Centre of Barcelona (DPCB) is embedded in the Gaia DPAC group at the University of Barcelona (UB) and the Institute for Space Studies of Catalonia (IEEC), in close cooperation with the Barcelona Supercomputing Centre (BSC) and the Consorci de Serveis Universitaris de Catalunya (CSUC), also in Barcelona, Spain. The operational DPCB hardware is provided by BSC, whereas the team at the UB/IEEC carries out the management, operations, development, and software tests. The responsibilities of DPCB are the execution of the:
-
•
Gaia Transfer System (CU1-GTS), for the reception of input data on a daily basis from DPCE and for the transfer of data produced at DPCB to DPCE;
-
•
Intermediate Data Updating (CU3-IDU), one of the major processing tasks in the cyclic processing in charge of regenerating all the intermediate data as described in Section 2.4.2;
-
•
CU2 Simulations, specifically CU2-GASS and CU2-GOG, which simulate satellite telemetry and the final Gaia catalogue, respectively.
The main focus of DPCB during operations is to execute the cyclic processing, running several stages of CU3-IDU every data processing cycle. In some cases, depending on the inputs available and specially in the first processing cycles, only part of these subsystems may be run whereas, in later stages of the mission, repeated execution of some of these subsystems may be needed during a given cycle.
Additionally to the execution of CU3-IDU, DPCB is also responsible for the integration of the CU3-IDU software into the execution environment and available resources, in particular the MareNostrum supercomputer. This supercomputer, hosted at BSC, offers a peak performance of 1.1 Petaflops and 100.8 TB of main memory. It is composed of more than 3000 computing nodes.
The design and implementation of CU3-IDU and its integration in DPCB presents a variety of interesting challenges, covering not only the purely scientific problems that appear in any data-reduction process but also the technical issues that arise when processing the huge amount of data that Gaia provides. In particular, DPCB has developed an efficient and flexible execution framework, including tailored data-access routines, efficient data formats, and an autonomous application in charge of handling and checking the correctness of all input data entering or produced by CU3-IDU.
DPCB is therefore responsible for the reprocessing of all the accumulated astrometric data collected from the spacecraft, adding the latest measurements, and recomputing the CU3-IDU outputs using the latest calibrations to obtain better scientific results.
The improved results provided by CU3-IDU executions at DPCB are the starting point for the next iterative reduction loop, which includes AGIS and PhotPipe. Without CU3-IDU results, the Gaia data processing chain would not be able to provide the envisaged accuracy. Therefore, its presence is key to obtain the optimum convergence of the iterative process on which all the data processing of the spacecraft is based.
Gaia DR1
For Gaia DR1, the following IDU processes have been executed:
-
•
Scene: predicts the CCD transit times of sources given an input catalogue and the spacecraft attitude;
-
•
Detection classifier: flags spurious detections which have to be ignored in the subsequent processes;
-
•
Crossmatch: matches observations to sources;
-
•
Validation: provides technical and scientific consistency checks.
These processes are nominally executed after a given data segment is closed and DPCB has received all the data. The tasks are executed sequentially in a single run over the full data set. In the current case, the tasks included all the data up to Segment 01 (inclusive).
In this processing cycle, CU3-IDU version 18.0.0 was used. All the processing was performed on the MareNostrum III supercomputer starting on 14 October 2015 and finishing on 4 November 2015. It means a total of 21 days which includes the validation activities and delivery of the data to DPCE. During this period, observations and TB of input data were successfully processed.
A brief summary of the results obtained at DPCB during this processing activity:
-
•
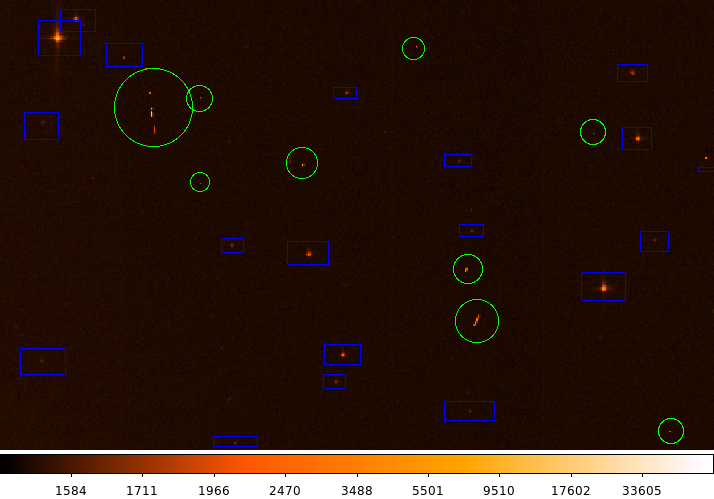
observations were classified as spurious detections. These are mainly caused by the diffraction spikes of bright stars and the transit of major Solar-system bodies. These observations were filtered out from the crossmatch.
-
•
new sources were added to the initial Gaia working catalogue by the crossmatch task. This task started from the Initial Gaia Source List (IGSL; Smart and Nicastro 2014), containing source entries, which was already known to be incomplete.
In this particular execution for Gaia DR1, due to the current limitations of the algorithms, the number of new sources created due to spurious detections has been very high. This is expected to be greatly reduced in forthcoming executions with the integration of more sophisticated crossmatch algorithms and improved spurious-detection models. Spurious detections are currently the main cause of the catalogue pollution and additional effort has been committed to improve the detection classification in forthcoming releases.
For further details on the scientific features and limitations of the algorithms used in this execution, see Section 2.4.9.
The total computing hours consumed and volume of data produced by each process in this activity, only including successful runs, is shown in Table 1.4. However, the intermediate-data arrangement and validation tasks and activities have also consumed CPU time. When accounting for all the operations in MareNostrum III, the real number of CPU hours consumed for this activity approaches .
| Task | CPU hours | Data size [Gigabytes] |
| Scene | ||
| Detection classifier | ||
| Crossmatch | ||
| Total |
In addition to the described operational activities, DPCB also provides support to the development and testing of CU3-IDT and other related products. These activities use mainly resources in CSUC. Being involved in the development of CU3-IDT has provided the DPCB team unique knowledge and expertise on the spacecraft raw-data processing which has remarkably contributed to significant improvements in the software developed for the execution of CU3-IDU.
Finally, during many years, DPCB has generated key CU2 simulation data sets used in the development and testing of products across DPAC. CU2-GASS simulations have been essential prior to Gaia launch to test DPAC software and some are still used, even after launch, to ensure the proper implementation of the processing chains. CU2-GOG simulations are still being generated and are now an essential part of the CU9 software validation and testing.
DPCC
Background
The Data Processing Centre at CNES (named DPCC) has the responsibility of running the CU4, CU6, and CU8 processing chains all along the Gaia mission. This includes both daily and cyclic processing. DPCC is also in charge of backing up the Gaia Main DataBase (MDB, located at DPCE) and the science telemetry archive during the entire mission. DPCC is located at CNES (Centre National d’Etudes Spatiales, Toulouse, France).
The object-processing chains (CU4) will process all other objects not processed or identified in the CU3, CU5, or CU6 data reduction (as well as eclipsing binaries identified by CU7). Such objects include Non-Single Stars (NSSs), Solar-System Objects (SSOs), and Extended Objects (EOs).
The spectroscopic processing chains (CU6) process and analyse the data obtained with the Radial Velocity Spectrometer (RVS). The goals of the spectroscopic processing system are:
-
•
to monitor the health of the spectrograph and to calibrate its characteristics;
-
•
to provide radial and rotational velocities;
-
•
to issue variability and multiplicity diagnostics;
-
•
to alert on objects that require a rapid ground-based follow-up; and
-
•
to provide clean, calibrated spectra.
The chains dealing with astrophysical classes and astrophysical-parameter determination (CU8) provide the astrophysical parameters for the objects that Gaia observes (stars, galaxies, quasars, etc.). The name of the CU8 data processing system is Apsis.
Gaia observes more than one billion stars, each one 70–80 times over the five-year mission. The ground data processing has therefore to face several challenges:
-
•
a huge number of elements to handle with dozens of tables containing up to 70–80 billion rows;
-
•
a complex processing with timeliness constraints: daily systems to deal with the data-reduction-cycle ones;
-
•
a huge volume to handle: 3 PB of data are foreseen at the end of the mission (disregarding intermediate data generated in each DPC).
As a consequence, in 2011, DPCC has chosen the Hadoop and Map/Reduce technologies as the core of the DPCC framework, following a database system study that showed Hadoop to be the best solution to handle more than 10 million objects. The scalability of the solution allows an incremental purchase of the hardware in order to follow the growing needs in terms of volume and processing power over the five years of the nominal mission.
DPCC is responsible for all aspects related to the physical hardware used to process the data (from purchase to regular maintenance and system administration) as well as for the development and maintenance of the software infrastructure required to process and archive the input and output data, run the scientific modules developed within CU4, CU6, and CU8 on the DPCC cluster, and deliver the data to scientists and DPCE. DPCC has a fundamental role in the validation, pre-integration of the modules developed by scientists, and integration into the final framework, up to the final qualification of the overall system. All operational aspects (from data deliveries to pipeline operations) are under DPCC responsibility.
During operations, all data are received daily at DPCC from DPCE and archived in a mirror database (MDB Backup) for long-term preservation. The solution is based on temporary disk servers (64 TB) and on a robotic system with LTO-6 tapes, allowing to store up to 3 PB.
The DPCC data reception chain allows to automatically analyse and index the data that are needed as input to the chains. It publishes them on a Web portal (named GAIAWEB) for analysis by the payload experts. This web server is used every day to communicate with scientists, as it also stores the main results of the chains execution, log files, and execution reports.
Gaia DR1
During Cycle 01, only the daily processing ran in DPCC, the cyclic chains still being under development and qualification.
The CU6 bias non-uniformity calibration chain (named UC1) ran several times, each time when a new SpecialVOsequence was received. Its objective is to calibrate the bias non uniformity of the RVS instrument.
The CU6 daily RVS calibration chain (named UC2) has been running on a quasi daily basis since mid-Cycle-01. It is triggered after reception of a qualified FL run (ODAS astrometry) with associated IDT runs and crossmatch results. This allows to perform the daily RVS calibration (wavelength, along-scan LSF, across-scan LSF, diffuse background, photometric) and to derive the radial velocities of the stars.
The CU4 SSO daily processing system (SSO-ST, for short term) was qualified in Cycle 01 to provide science alerts to IMCCE.
DPCI
Background
The Gaia photometric and spectro-photometric data are processed at the Data Processing Centre located at the Institute of Astronomy (University of Cambridge, UK). This is also referred to as DPCI.
The large data volume produced by Gaia (26 billion transits per year), the complexity of its data stream, and the self-calibrating approach pose unique challenges for scalability, reliability, and robustness of both the software pipelines and the operation infrastructure. DPCI therefore adopted Hadoop and Map/Reduce as the core technologies for its infrastructure since 2010.
DPCI is responsible for all aspects related to the physical hardware used to process the data (from purchase to regular maintenance and system administration) as well as for the development of the software infrastructure required to run the scientific modules developed within CU5 on the DPCI cluster. DPCI has a fundamental role in the integration of those modules into the official pipeline. All operation aspects (from data deliveries to pipeline operation) are under DPCI responsibility.
The pipeline processing the photometric and spectro-photometric data is called PhotPipe. For the production of the data included in Gaia DR1, PhotPipe releases 18.1.0, 18.2.0 and 18.3.0 were used to perform different aspects of the processing. In PhotPipe, the scientific modules are implemented as a series of ‘Processing Elements’ that can be assembled into a workflow or ‘Recipe’. Recipes are defined using a specifically designed Domain Specific Language (DSL) called Scylla, based on functional programming. For details on the scientific processing of the data, see Section 5.
During operations, data is received daily at DPCI. The automatic data-handling system records new deliveries and stores useful metadata into a database. The data is thus transferred to the cluster to be ready to be imported. This process converts the input data from the DPAC format into the internal data model, optimised for the PhotPipe processing. The modelling of the complex data stream is done using yet another DSL (and compiler) developed ad hoc by the DPCI team, called Charybdis.
PhotPipe operates in cyclic mode, i.e., PhotPipe operations start when all data for a data segment has been received as well as when the results of the IDU (IPD and crossmatching in particular) from the same cycle are received. The processing in PhotPipe can be divided into the following steps:
-
•
ingestion and pre-processing of data, including the computation of bias corrections, heliotropic angles, predicted and extrapolated positions, and the creation of types optimised for the PhotPipe processing by joining several inputs coming from different upstream systems;
-
•
BP/RP pre-processing and initial calibration, in particular background (stray light component only for Gaia DR1) and along-scan geometric calibration;
-
•
integrated flux internal calibration, including the initialisation of the photometric internal reference system and all the internal calibrations required to remove all instrumental effects (time-link calibration, Gate and Window Class-link calibration, large- and small-scale calibrations);
-
•
BP/RP instrument model calibration, taking into account the effect of varying flux response and LSF across the focal plane and in time over the BP and RP CCDs;
-
•
external calibration creating the link between the internal photometric reference system and the absolute one, thus allowing comparisons of Gaia data with other catalogues;
-
•
export of the data produced by PhotPipe to the MDB for integration with results from other systems, distribution to downstream users within DPAC and for creation of selections to be released to the public.
At each cycle, PhotPipe will re-process all data collected by Gaia since the start of the nominal mission. Particularly in the first cycles, significant improvements in the software and algorithms are expected while becoming more and more familiar with the data. The cyclic nature of the processing ensures these improvements affect all the data collected so far.
Gaia DR1
During Cycle 01, just over 29 billion field-of-view transits entered the PhotPipe processing. Only for a fraction of these (21.9 billion field-of-view transits), IPD results were available, thus enabling further processing in PhotPipe.
It should be mentioned that the significant reduction in the number of observations that can be processed due to missing IPD results, is not uniformly distributed in time, sky, colour, or magnitude. Faint sources are mostly affected due to several periods of RAW-only-mode processing for low-priority data in IDT. Additional gaps are introduced due to missing satellite attitude information (required for a successful crossmatch and for a computation of predicted and extrapolated positions) and object logs (required for the computation of bias corrections). Spurious detections, even though mostly blacklisted by the IDU crossmatching and therefore filtered out from further processing in PhotPipe, contaminate the data set.
The current status of the software can handle successfully nominal cases (truncated windows, unexpected Gate/Window Class configurations; complex Gate cases are not treated). All the processing in PhotPipe is transit-based. The source mean photometry is produced by accumulating the calibrated epoch photometry for all the transits crossmatched to the same source.
Next, a detailed accounting of the operations for Cycle 01 is provided, including how the number of transits calibrated was affected by various problems encountered. Note that even though some transits do not have all the required information available, they are nevertheless brought forward in the processing and stored: this is because in future cycles the now-missing information might be available and might therefore then be possible to recover those transits.
-
•
The operations started with AstroObservations (AO), PhotoObservations (PO), and AstroElementaries (AE).
-
•
AO (observed in a time range covering 20.07 hours) could not be processed due to a problem in GaiaTools related to the access to the CDB in the period following the VPU software update to version 2.8. complete transits (with both -band samples and BP and RP samples) were available to further processing.
-
•
field-of-view transits had a corresponding AstroElementary (containing the IPD results). Only field-of-view transits had valid IPD results for all SM/AF CCDs. Incomplete transits are used for further processing but are more likely to drop off in case of other problems affecting the few CCD transits available.
-
•
Out of the field-of-view transits available, had a valid match, and were blacklisted (considered to be spurious detection). Blacklisted transits are not calibrated.
-
•
field-of-view transits were covered by attitude reconstruction and could therefore have a successful estimate of across-scan motion and heliotropic angles. field-of-view transits instead were lost due to attitude gaps.
-
•
field-of-view transits have successfully estimated extrapolated positions for BP/RP. transits failed the extrapolation process because of missing or low-quality IPD results. Extrapolated positions are required for further scientific processing.
-
•
The following two filters are applied to all scientific processing:
-
–
the periods during decontamination and refocus activities are avoided (this reduces the number of field-of-view transits by to );
-
–
transits flagged as Truncated, EliminatedSamples, GateRelease, MissingWindow, or having DistanceToLastCi 0 in either BP or RP are filtered out (this reduces the number of field-of-view transits by to ).
-
–
-
•
The process of BP/RP initial calibration (stray light, along-scan geometric calibration, and computation of spectral-shape coefficients) runs independently on BP and RP CCD transits. are available at the start (twice the number of field-of-view transits left after the filtering reported at the previous item). The following reductions in number take place (the percentages refer to the total number of field-of-view transits, i.e., ): have no bias (no ObjectLog coverage) or no heliotropic coordinates (no attitude coverage), have no background estimate (insufficient VO coverage), have no crossmatch (blacklisted transits) or no extrapolated positions, have negative integrated BP/RP flux, failed the computation of the spectral-shape coefficients for either BP or RP. Contrary to the filtering reported in the previous item, this one affects independently the BP and RP CCD transits, so the total number of field-of-view transits entering the photometric calibration step is reduced by a lower amount than what would be obtained by summing up all the percentages at this point plus the ones at the previous point. The total number of field-of-view transits entering the photometric calibration step is . It is clear, however, that most of these field-of-view transits will have incomplete colour information, which will prevent them from being calibrated as there is no provision of default colours in PhotPipe for this cycle.
-
•
Indeed, when performing the first accumulation of calibrated data (after the link calibration), the field-of-view transits are accumulated to produce a catalogue of sources with photometry. Through the iterations, this number is slightly reduced due to some calibration being missing (mostly at the bright end) and to the colour restrictions imposed by the model used for the time-link calibration. The catalogue of mean photometry generated by PhotPipe for Cycle 01 contains a total of sources (before CU9 filtering).
DPCG
Background
DPCG is embedded in the Gaia DPAC group at the Astronomical Observatory of the University of Geneva, Switzerland. Its physical location is the Integral Science Data Centre, a part of the Geneva Observatory, in Versoix near Geneva, Switzerland. DPCG runs the Integrated Variability Pipeline (IVP), which is the CU7 Variability Pipeline integrated into DPCG’s software and hardware infrastructure. Along the pipeline processing, data is visualised for monitoring and quality-check purposes. DPCG performs a cyclic processing dependent on the input provided by the CU3, CU4, CU5, CU6, and CU8 systems. The overall DPCG processing aims at providing a characterisation and classification of the variability aspects of the celestial objects observed by Gaia. The information DPCG will provide at the end of the mission is:
-
•
Reconstructed time series
-
•
Time-series statistics for all objects and all time series
-
•
Identification of variable objects
-
•
Identification of periodic objects
-
•
Characterisation of variable objects: significant period values, amplitudes, phases, and model
-
•
Classification of the objects: a probability vector providing the probability per object to be of a given variability type
-
•
Additional attributes that do depend on the classification of the objects to a given variability type.
The Integrated Variability Pipeline extracts attributes which are specific to the objects belonging to specific classification types. This output of the IVP is transferred to DPCE and integrated into the MDB from where it is used as input for processing, mainly by CU4, and CU8.
The DPCG hardware has the following elements:
-
•
Data nodes: machines providing the bulk of the disk storage needed for the development, testing, and operational needs of DPCG. A single data node is configured with a Postgres 9.5 database. It is planned for the next cycle to use the distributed Postgres-XL on multiple nodes, which will provide horizontal scalability related to the number of hardware nodes available, while retaining the ease of use and functionalities of a standard SQL database.
-
•
Processing nodes: these are providing the bulk of CPU processing power for DPCG. They are using the Sun Grid Engine (SGE) batch system to launch pipeline runs that process sources in parallel on a high-performance-computing cluster.
-
•
Broker nodes: these are providing middle ware for message exchange between the various parts of the system. Currently based on a single-node Active MQ server.
-
•
Monitoring nodes: web and application server(s), machines hosting the web and application server for the DPCG to host part of the visualisation tool and the continuous integration tool.
-
•
Off-line backup system: providing backup and recovery functionality of the Postgres database.
-
•
Data exchange node: the front-end machine for data exchange between DPCE and DPCG on which GTS/Aspera is installed.
Gaia DR1
The Integrated Variability Pipeline is built in a modular fashion, and chosen parts of variability analysis can be included or excluded by editing the configuration file. For normal operations, all ‘scientific’ analyses are expected to be executed. However, given the focus on Cepheid and RR Lyrae candidates only a subset of modules has been included. The Cycle 01 processing has been performed with releases 19.1.x of the following modules:
-
•
VariDataExchange
-
•
VariConfiguration
-
•
VariObjectModel
-
•
VariFramework
-
•
VariStatistics
-
•
VariCharacterisation
-
•
VariClassification
-
•
VariSpecificObjects.
During Cycle 01 processing, a specific subset of sources was processed with the intention of showcasing the quality of output DPCG and CU7 can produce. However, the end-of-mission number of sources processed is expected to be many orders of magnitude larger than what is available in Gaia DR1.
For Cycle 01 processing DPCG ingested roughly 3.5 million sources over the whole sky, with associated photometric data (CU5 output selected to meet a minimum of at least 20 observations per source, as variability processing has been found to be most reliable when sources have 20 or more observations). DPCG and CU7 then retained only a few tens of thousands of sources of interest based on their position and likelihood of crossmatch. Of interest were specifically sources within the Magellanic Cloud(s), and thus an area of interest was defined within 38 degrees of the South ecliptic pole. A final list of sources of interest with high probabilities, or external catalogue crossmatches of the RR Lyrae and Cepheid types, was finally retained. Further cuts were made by the pipeline’s analyses, until only 3194 were deemed to have been reliably classified and (visually) validated.
DPCT
DPCT operates the AVU pipelines in the Cycle-01 processing, including the daily pipelines of the AVU/AIM and AVU/BAM systems and the data-reduction-cycle pipeline of the GSR system. DPCT processed 800 daily runs of AIM and BAM and completed the first GSR data-reduction processing. The number of work flows executed is about , and the number of jobs processed is about million. The size of the received input data is about 70 TB while the largest Oracle database at DPCT has a size of 150 TB.
The daily pipelines of the AVU/AIM and AVU/BAM systems are stable after the relevant upgrade implemented at the end of the commissioning phase, but they continue to evolve in order to improve their results and add new modules needed to enrich the analysis. The AVU/AIM and AVU/BAM software systems have run with versions 16.0, 17.0, and 18.0 (including a number of patch releases to fix specific issues found during operations). The AVU/AIM pipeline is running with the following modules: Ingestion, Raw Data Processing, Monitoring, Daily Calibration, Report and Monthly Diagnostics. The AVU/AIM processing strategy is based on time, with each AVU/AIM run being defined on 24 hours of observed data. The AIM pipeline starts with the aim to select AstroObservation having gclass 2. The Raw Data Processing processes AstroObservations with gclass equal to 0, 1, or 2 and estimates the image parameters. In processing Cycle 01, the AVU/AIM system processed with a PSF/LSF bootstrapping library including specific image profile templates for each CCD, spectral-type bin, and gclass. The AVU/AIM system cannot process defined runs when IDT runs in RAW-only mode. The Monitoring module is a collection of software modules dedicated to extract information on the instrument health, astrometric-instrument calibration parameters, image quality during in-flight operations, and comparison among AVU/AIM and IDT outputs. The Daily Calibration module is devoted to the Gaia signal-profile reconstruction on a daily basis. Its work flow also includes diagnostics and validation functions. The calibration-related diagnostics include the image-moment variations over the focal plane. An automatic tool performs validation of the reconstructed image profiles before using them within the AIM chain. The computing performance depends strongly on the number of AstroObservations characterising the AIM run. The AIM pipeline can manage runs with different sizes. The observed range in Cycle-01 processing is between 2 and 11 million AstroObservations. A filter is activated in runs with more than 5 million AstroObservations in order to process the minimum number of data in each bin defined on several instrument and observation parameters and time intervals without losing quality in the AVU/AIM result. The filter is usually activated when Gaia is scanning the galactic plane.
The AVU/BAM pipeline is running with the following modules: Ingestion, Pre-Processing, RDP, Monitoring, Weekly Analysis, Calibration, Extraction and Report. In the Raw Data Processing (RDP) module, the following algorithms are running: Raw Data Processing, Gaiometro, Gaiometro2D, DFT, Chi Square, BAMBin, and comparison with IDT BamElementary. The AVU/BAM system has two run strategies: IDT and H24. In the IDT strategy, used from commissioning to December 2015 (covering Gaia DR1), a BAM run is defined when a transfer containing the BAM data is received at DPCT. The processing is started automatically without any check on data. In the other strategy, the H24 strategy, a BAM run is defined based on 24 hours of data and the processing starts automatically when the data availability reaches a threshold defined by the BAM payload expert (e.g., 98%–99%). The AVU/BAM system has been processing with the H24 strategy since December 2015 to have BAM analyses at regular intervals. The AVU/BAM pipeline has been sending the BAM output to the end of each run since the commissioning phase. After the last operational BAM software release, BAM 19.0.0, the pipeline takes about 60 minutes to execute all modules.
In order to ensure that the automatic data reception and ingestion processes are executed without data losses, DPCT has implemented and executed a set of procedures to guarantee the consistency of the data inside the DPCT database. Data-consistency checks are executed on all DPCT data stores and at different times, e.g., before and after data are used in the data-reduction pipelines. The DPCT data-consistency checks are working as expected, i.e., the data-management pipelines are reliable.
The DPCT data stores are in good shape and they are used to provide data services to all AVU data processing and analysis activities. In particular the DPCT database repository, implemented with Oracle technology, is collecting all data received and generated from/to the DPCT pipeline. This configuration allows having data online to conduct additional analyses not implemented in the delivered pipelines. At the end of processing Cycle 01, the size of this database repository is about 150 TB.
Moving to the data-reduction-cycle pipelines, the GSR system started operations in processing Cycle 01 running software version 18.1.0 (including two patch releases to fix specific issues found during operations). The first GSR ran on data of data Segment 00 and data Segment 01 with a Tycho-2 star selection of the Gaia catalogue table and the usage of the IDT and IDU attitude data set. The GSR pipeline was executed with the following modules: Ingestion, System Coefficient Generation, Solver, Solution Analysis, De-Rotation and Comparison, Extraction and Report. The ingestion step is the most complex data-handling module as billions of AstroElementaries are read and matched to sources to populate the GSR data store. The System Coefficient Generation module is devoted to calculate the coefficient parameter of the system of linearised equations to be solved to produce the GSR sphere solution. The Solver module consists of the implementation of the LSQR algorithm for solving the system of linearised equations and it is the only module running on the Fermi supercomputer at CINECA. The Solver finds a GSR solution and the analysis module checks the exit status of the solution algorithm and provides an alert in case of problems revealed by the stopping conditions implemented in the LSQR algorithm. The next module in the pipeline is the De-Rotation and Comparison module which converts the GSR solution into a format compatible with that of the AGIS one. It also de-rotates the AGIS solution back into its internal reference frame. The GSR results are collected in the final report.
The first GSR solution was for astrometric position and attitude parameters only. The instrument was added as correction to the known terms and the attitude-knot interval was 180 s. The operational run has been completed and ended as expected with the successful completion of all the pipeline modules. The results are not scientifically viable because of the pending improvement of the GSR software for what regards the implementation of the attitude constraints and the implementation of missing parts of the instrument model. For this reason, the output of GSR-01 was not sent to the MDB to be included in the MDB-01 release. From a technical point of view, the full GSR pipeline, including the Solver module running on the CINECA supercomputer, has been executed.
The following table shows the main data types produced at DPCT during the data processing prior to Gaia DR1:
-
•
BamElementaryT;
-
•
Bav;
-
•
CalibratedBav.
As explained above, the GSR output is not provided to the MDB. The output and findings of AIM, as well those of BAM, provided in the daily and periodic reports have been used by the payload-expert group to check the instrument health by performing cross checks with other DPAC systems providing the same instrument measurements.