2.4 Processing steps
Author(s): Claus Fabricius
As mentioned above (Section 2.1.1) the pre-processing is run in almost real time on a daily basis, as well as much later during each data processing cycle. Processing steps are of course somewhat different in the two cases, and not all of them need to be repeated cyclically.
The demand of always being up to date in the daily processing, leads to a complication when the processing has been stopped for some days due to maintenance or when the data volume is very high as it happens when the spin axis is close to the Galactic poles. The adopted solution in some cases is to skip some processing steps for data of lower priority in these specific situations, and essentially postpone the full treatment to the cyclic pre-processing. This is relevant for Gaia DR1, which is based on the daily pre-processing.
2.4.1 Overview
Author(s): Claus Fabricius
The major complication for the daily pre-processing is the ambition to process a given time span before all the telemetry has arrived at the processing centre, and without knowing for sure if data that appears to be missing will in fact ever arrive. The driver is the wish to keep a close eye on the instrument and to issue alerts on interesting new sources.
As a rule, housekeeping telemetry, and the so-called auxiliary science data (ASD, see Section 2.2.2), is sent to ground first, followed by the actual observations for selected magnitude ranges. This is meant to be the minimum required for the monitoring tasks. Later follows other magnitude ranges, unless memory becomes short on-board and the data in down-link queue overwritten. Data can be received at different ground stations, and may also for that reason arrive unordered at the processing centre.
The daily pre-processing is known as the Initial Data Treatment (IDT) and is described below (see Section 2.4.2). It is followed immediately by a quality assessment and validation known as First-Look (FL, see Section 2.5.1 and Section 2.5.2), which takes care of the monitoring tasks and the daily calibrations.
The cyclic pre-processing, known as the Intermediate Data Updating (see Section 2.4.2), runs over well-defined data sets and can be executed in a much more orderly manner. It consists of three major tasks, viz. calibrations, image parameter determination, and crossmatch, as well as several minor tasks as described below.
2.4.2 Daily and cyclic processing
Author(s): Jordi Portell, Claus Fabricius, Javier Castañeda
As previously explained, there are good reasons for performing a daily pre-processing, even if that leads to not fully consistent data outputs. That is fixed regularly in the cyclic pre-processing task. Some algorithms and tasks are only run in the daily systems (mainly the raw data reconstruction, which feeds all of the DPAC systems), whereas other tasks can only reliably run on a cyclic basis over the accumulated data. There are also intermediate cases, that is, tasks that must run on a daily basis but over quite consolidated inputs. That is achieved by means of the First-Look (FL) system, which is able to generate some preliminary calibrations and detailed diagnostics. Table 2.6 provides an overview of the main tasks executed in these two types of data pre-processing systems. Please note that most of the ‘Final’ tasks mentioned in IDU are not included in the present release: only the crossmatch is included. The final determination of spectro-photometric image parameters (that is, BP/RP processing) is done in PhotPipe (see Section 5).
| Task | Daily (IDT) | Daily (FL) | Cyclic (IDU) |
| Raw data reconstruction | Final | ||
| Basic angle variations determination | Final | ||
| On-ground attitude reconstruction | Prelim. (OGA1) | Prelim. (OGA2) | |
| Bias and astrophysical background | Prelim. | Final | |
| Astrometric LSF calibration | Prelim. | Final | |
| Spectro-photo image parameter determination | Prelim. | ||
| Astrometric image parameter determination | Prelim. | Final | |
| Crossmatch processing | Prelim. | Final |
Notes. ‘Final’ means that the outputs generated by that task are not updated anymore (unless in case of problems or bugs), whereas ‘Preliminary’ means a first version of a data output that is later updated or improved.
Initial Data Treatment (IDT)
IDT includes several major tasks. It must establish a first on-ground attitude (see Section 2.4.5), to know where the telescopes are pointing in every moment; it must calibrate the bias, and it must calibrate the sky background (see Section 2.4.6). Only with those pieces in place can it start thinking of attacking the actual observations.
For the observations, the first thing is to reconstruct all relevant circumstances of the data acquisition, as explained in Section 2.4.3. From the BP and RP windows we can determine a source colour, and then proceed to determine the image parameters (see Section 2.4.8).
The final step of IDT is the crossmatch between the on-board detections and a catalogue of astronomical sources, having filtered detections deemed spurious (see Section 2.4.9). One catalogue source is assigned to each detection, and if no one is found, a new source is added.
Intermediate Data Updating (IDU)
The Intermediate Data Updating (IDU) is the instrument calibration and data reduction system more demanding in terms of data volume and processing power across DPAC. IDU includes some of the most challenging Gaia calibrations tasks and aims to provide:
-
•
Updated crossmatch table using the latest attitude, geometric calibration and source catalogue available.
-
•
Updated calibrations for CCD bias and astrophysical background (see Section 2.4.6).
-
•
Updated instrument LSF/PSF model (see Section 2.3.2).
-
•
Updated astrometric image parameters; location and fluxes (see Section 2.4.8).
All these tasks have been integrated in the same system due to the strong relation between them. They are also run in the same environment, the Marenostrum supercomputer hosted by the Barcelona Supercomputing Centre (BSC) (Spain). This symbiosis facilitates the delivery of suitable observations to the calibrations, and of calibration data to IDU tasks.
As anticipated in Section 2.1.1, IDU plays an essential role in the iterative data reduction; the successive iterations between IDU, AGIS and PhotPipe (as shown in Figure 2.10) are what will make possible to achieve the high accuracies envisaged for the final Gaia catalogue.

Fundamentally, IDU incorporates the astrometric solution from AGIS resulting in an improved crossmatch but also incorporates the photometric solution from PhotPipe within the LSF/PSF model calibration obtaining improved image parameters. These improved results are the starting point for the next iterative reduction loop. Without IDU, Gaia would not be able to provide the envisaged accuracies and its presence is key to get the optimum convergence of the iterative process on which all the data processing of the spacecraft is based.
2.4.3 Raw data reconstruction
Author(s): Javier Castañeda
The raw data reconstruction establishes the detailed circumstances for each observation, including SM, AF, BP, and RP windows of normal observations, RVS windows for some brighter sources, as well as the BAM windows. The result is stored in persistent raw data records, separately for SM and AF (into AstroObservations); for BP and RP (into PhotoObservations); for RVS (into SpectroObservations); and for BAM (into BamObservations). These records need no later updates and are therefore only created in IDT.
The telemetry star packets with the individual observations include of course the samples of each window, but do not include several vital pieces of information, e.g. the AC position of each window line, if some lines of the window are gated, or if there is a charge injection within or close to the window. These details, which are common to many observations, are instead sent as auxiliary science data (ASD).
As previously described, there are several kinds of ASD files. ASD1 files detail the AC offsets for each CCD for each telescope. These offsets give the AC positions of window lines in the CCD at a given instant, relative to the position of the window in AF1. Due to the precession of the spin axis, the stellar images will have a drift in the AC direction, which can reach 4–5 pixels while transiting a single CCD. This shift changes during a revolution and must therefore be updated regularly. When an update occurs, it affects all window lines immediately, but differently for the two telescopes. Windows may therefore end up with a non-rectangular shape, or windows may suddenly enter into conflict with a window from the other telescope.
The regular charge injections for AF and BP/RP CCDs are recorded in the ASD5 records. IDT must then determine the situation of each window with respect to the more recent charge injection. This task has an added twist, because charge injections that encounter a closed gate will be held back for a while, and actually diluted.
Also the gating is recorded in an ASD file, and here IDT must determine the gate corresponding to each window line. The detection causing the gate will have the same gate activated for the full window, but other sources observed around the same time will have only gating in a part of their windows. Any awkward combination may occur. An added twist is that the samples immediately after a release of a gate, will be contaminated by the charge held back by the gate, and are therefore useless.
2.4.4 Basic angle variation determination
Author(s): Alcione Mora
The Gaia measurement principle is that differences in the transit time between stars observed by each telescope can be translated into angular measurements. All these measurements are affected if the basic angle (the angle between telescopes, ) is variable. Either it needs to be stable, or its variations be known to the mission accuracy level (1 as).
Gaia is largely self-calibrating (calibration parameters are estimated from observations). Low frequency variations () can be fully eliminated by self-calibration. High frequency random variations are also not a concern because they are averaged during all transits. However, intermediate-frequency variations are difficult to eliminate by self-calibration, especially if they are synchronised with the spacecraft spin phase, and the residuals can introduce systematic errors in the astrometric results (Michalik and Lindegren 2016, Sect. 2). Thus, such intermediate-frequency changes need to be monitored by metrology.
The BAM device is continuously measuring differential changes in the basic angle. It basically generates one artificial fixed star per telescope by introducing two collimated laser beams into each primary mirror (see Fig. 2.11). The BAM is composed of two optical benches in charge of producing the interference pattern for each telescope. A number of optical fibres, polarisers, beam splitters and mirrors are used to generate all four beams from one common light source. See Gielesen et al. (2012) for further details. Each Gaia telescope then generates an image on the same dedicated BAM CCD, which is an interference pattern due to the coherent input light source. The relative AL displacement between the two fringe patterns is a direct measurement of the basic-angle variations.
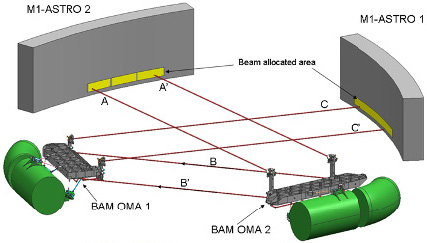
A detailed description of the BAM data model, the data’s collection, fitting and daily processing are outlined in Section 7 of Fabricius et al. (2016).
2.4.5 On-ground attitude reconstruction (OGA1 & 2)
Author(s): David Hobbs, Michael Biermann, Jordi Portell
The processing of attitude telemetry from the Gaia spacecraft is unique due to the high accuracy requirements of the mission. Normally, the on board measured attitude from the star trackers, in the form of attitude quaternions, would be sufficient for the scientific data reduction but perhaps requiring some degree of smoothing and improvement before use. This raw attitude is accurate to the order of a few arcseconds ( ) but for the Gaia mission an attitude accurate to a few tens of as is required. This is achieved through a series of processing steps as illustrated in Figure 2.12.
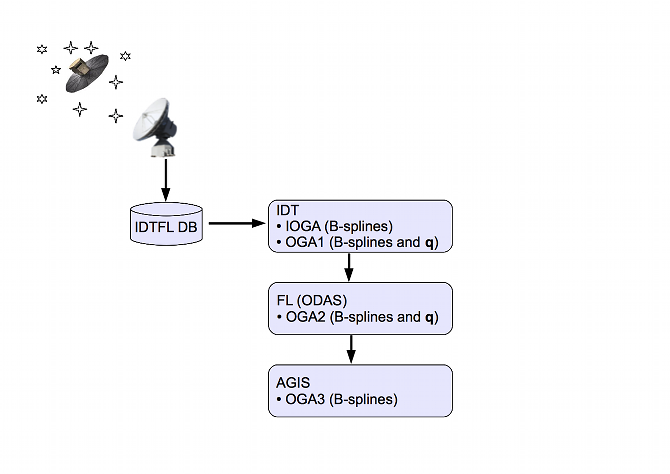
The raw attitude is received in TM and stored in the IDTFL database. This is then available for IDT which performs the IOGA which fits a set of B-spline coefficients to the available TM, resulting is an array of B-spline coefficients and the associated knot times (see Section 3.3.4). The output from IOGA can then be used as the the input to OGA1 which is a Kalman filter designed to smooth the attitude and to improve its accuracy to the order of 50 milli-arcseconds (mas). At this point more Gaia specific processing begins. For Gaia a First Look (FL) process is employed to do a direct astrometric solution on a single days worth of data, known as the One Day Astrometric Solution (ODAS). This is basically a quality check on the Gaia data but also results in an order of magnitude improvement in the attitude accuracy and will be available in the form of B-splines and quaternions. The results of this process, known as OGA2, were the intended nominal input to AGIS although it would also be possible to use OGA1 from IDT as input to AGIS. However, in practise, mainly due to data gaps and discontinuities between OGA1 segments, it has been found that a simple spline fit to the commanded attitude is sufficient for initializing AGIS processing. AGIS is the the final step in the attitude improvement where all the available observations for primary stars are used together with the available attitude and calibration parameters to iteratively arrive at the final solution with a targeted accuracy. This AGIS final attitude referred to as the On-Ground-Attitude-3 (OGA3).
The attitude related tasks in IDT are (see Section 2.4.2):
-
•
ingest the ancillary science data (ASD), star packets (SP1) for the brightest detections () and raw attitude from IDTFL DB, noting the time intervals covered;
-
•
compute the Initial OGA (IOGA) for suitable time intervals;
-
•
extract a list of sources from the Attitude Star Catalogue using IOGA, and identify (crossmatch) those sources corresponding to the mentioned bright detections;
-
•
determine OGA1 by correcting IOGA with the match distances to the catalogue by means of an Extended Kalman Filter (EKF);
IOGA
In IDT the raw attitude values from the AOCS are processed to obtain a mathematical representation of the attitude as a set of spline coefficients. The details of the spline fitting are outlined in Appendix A of the AGIS paper (Lindegren et al. 2012). The result of this fitting process is the Initial OGA (IOGA). The time intervals processed can be defined by natural boundaries, like interruptions in the observations, e.g. due to micro-meteorites. The boundaries can also be defined by practical circumstances, like the end of a data transmission contact, or the need to start processing.
Using IOGA, a list of sources is extracted from the Attitude Star Catalogue (ASC) in the bands covered by Gaia during the time interval being processed. The ASC will in the early phases of the mission be a subset of the IGSL, but can later be replaced by stars from the MDB catalogue. This allows the next process, OGA1, to run efficiently, knowing in advance if a given observation is likely to belong to an ASC star.
OGA1
The main objective of OGA1 is to reconstruct the non-real-time First On-Ground Attitude (OGA1) for the Gaia mission with very high accuracy for further processing. The accuracy requirements for the OGA1 determination (along and across scan) can be set to 50 milliarcsec for the first 9 months, to be improved later on in the mission to 5 mas. OGA1 relies on an extended Kalman filter (KF) to estimate the orientation, , and angular velocity, , of the spacecraft with respect to the Satellite Reference System (SRS) defining the state vector
| (2.16) |
System model
The system model is fully described by two sets of differential equations, the first one describing the satellite’s attitude following the quaternion representation
| (2.17) |
where
| (2.18) |
and the second one using the Euler’s equations
| (2.19) |
where is the moment of inertia of the satellite and is the total disturbance and control torques acting on the spacecraft. The satellite is assumed to be represented as a freely rotating rigid body, which implies to set the external torques to zero in Equation 2.19. If this simplification will not work nicely to reconstruct the Gaia attitude, then the proper required to follow the NSL should be taken into account.
Process and measurement model
The process model predicts the evolution of the state vector and describes the influence of a random variable , the process noise. For non-linear systems, the process dynamics is described as following:
| (2.20) |
where and are functions defining the system properties. For OGA1, is given by Equation 2.17 and Equation 2.19, and is a discrete Gaussian white noise process with variance matrix :
| (2.21) |
The measurement model relates the measurement value to the value of the state vector and describes also the influence of a random variable , the measurement noise of the measured value. The generalized form of the model equation is:
| (2.22) |
where is the function defining the measurement principle, and is a discrete Gaussian white noise process with variance matrix (with standard deviations of 0.1 mas and 0.5 mas along and across scan respectively):
| (2.23) |
In order to estimate the state, the equations expressing the two models must be linearized in order to use the KF model equations, around the current estimation () for propagation periods and update events.
This procedure yields the following two matrices to be the Jacobian of and functions with respect to the state:
| (2.24) |
and
| (2.25) |
KF propagation equations
The KF propagation equations consist of two parts: the state system model and the state covariance equations. The first one
| (2.26) |
can be propagated using a numerical integrator, such as the fourth-order Runge-Kutta method. The matrix is called the transition matrix, the system noise covariance matrix and the system noise covariance coupling matrix.
The transition matrix can be expressed as:
| (2.27) |
where
| (2.28) |
and
| (2.29) |
Here the matrix notation represents the skew symmetric matrix of the generic vector . For the state covariance propagation, the Riccati formulation is used:
| (2.30) |
Its prediction can be carried out through the application of the fundamental matrix (i.e. first order approximation using the Taylor series) about which becomes now.
| (2.31) |
where represents the propagation step. The process noise matrix used for the Riccati propagation Equation 2.30 is considered to be
| (2.32) |
since OGA1 will depend more on the measurements (even if not so accurate at this stage) than on the system dynamic model.
KF update equations
The KF update equations correct the state and the covariance estimates with the measurements coming from the satellite. In fact, the measurement vector consists of the so called measured along scan angle , and the measured across scan angle , and they are the values as read from the AF1 CCD’s.
On the other hand, the calculated field angles () are the field angles calculated from an ASC for each time of observation. The set of the update equations are listed below:
| (2.33) | |||
| (2.34) | |||
| (2.35) |
where the measurement sensitivity matrix is given by
| (2.36) |
and the measurement noise matrix is chosen such that
| (2.37) |
The standard deviation for the field angle errors along and across scan are computed and provided by IDT.
The processing scheme
The OGA1 process can be divided in 3 main parts: input, processing and output steps.
1) The inputs are:
-
•
Oga1Observations (OGA1 needs these in time sequence from IDT) composed essentially by:
-
–
transit identifiers (TransitId)
-
–
observation time (TObs)
-
–
observed field angles (FAs) including geometry calibration
-
–
-
•
A raw attitude (IOGA), with about 7 noise (in B-splines).
-
•
A crossmatch table with pairs of: SourceId-TransitId, plus proper direction to the star at the instance of observation.
2) The processing steps
The OGA1 determination is a Kalman filter (KF) process, i.e. essentially an optimization loop over the individual observations, plus at the end a spline-fitting of the resulting quaternions. The main steps are:
-
•
Sort by time the list of elementaries. Then, sort the list of crossmatch sources by the transit identifier with the ones from the sorted list of elementary. The unmatched elementary transits are simply discarded.
-
•
Initialize the KF: interpolate the B-spline (IOGA attitude format) in order to get the first quaternion and angular velocity to start the filter. Optionally, the external torque can be reconstructed in order to have a better accuracy for the dynamical system model.
-
•
Forward KF: for a generic time , predicting the attitude quaternion from the state vector at the time of the preceding observation.
-
•
Backward KF: for a generic time , predicting the attitude quaternion from the state vector at the earlier time of the preceding observation.
-
•
From the pixel coordinates compute the field coordinates from SM and AF measurements, using a Gaia calibration file. As observed field angles OGA1 will use the AF2 values.
-
•
The calculated field coordinates of known stars (from ASC) are computed.
-
•
Correct the state using the difference between the observed and the calculated measurements in the along-scan () and across-scan () directions.
-
•
At the end of the loop over the measurements generate a B-spline representation for the whole time interval for output.
-
•
A last consolidation step is carried out in order to remove any attitude spike that may appear, for example due to a wrong crossmatch record.
The OGA1 determination process was found to need backward propagation of the KF in order to sufficiently reduce the errors near the start of the time interval. This was found to be a problem during testing and is a well known issue for Kalman filters. The problem was solved by introducing the backward filtering which resulted in a uniform distribution of errors.
3) The outputs are the improved attitude (for each observation time ) in two formats:
-
•
quaternions in the form of array of doubles.
-
•
B-spline representation from the OGA1 quaternions.
The OGA1 process, being a Kalman filter, needs its measurements in strict time sequence. In order to keep the OGA1 process simple, the baseline is thus to separately use the CCD transits. OGA1 must use two-dimensional (2D) astrometric measurements from Gaia. That is, the CCD transits of stars used by OGA1 must have produced 2D windows. OGA1 furthermore requires at least about one such 2D measurement per second and per FoV, in order to obtain the required precision.
OGA2 and ODAS source positions
The main objective of the ODAS is to produce a daily high-precision astrometric solution that is analysed by First Look Scientists in order to judge Gaia’s instrument health and scientific data quality (see also Section 2.5.2). The resulting attitude reconstruction, OGA2, together with source position updates computed in the framework of the First Look system is also used as input parameters by the photometric and spectroscopic wavelength calibrations (for the last mission data segment in each Gaia data release). For the first two data segments, the OGA2 is accurate to the 50 mas level because it is (like OGA1) tied to the system of the ground based catalogues, but it is precise at the sub-mas level, i.e. internally consistent except for a global rotation w.r.t. the ICRF. The OGA2 accuracy will improve during the mission with each catalogue produced by DPAC.
The computation of the OGA2 is not a separate task but one of the outputs of the ODAS (One-Day Astrometric Solution) software of the First Look System (see Section 2.5.2). This process can be divided into three main parts: input, processing and output steps:
-
1.
The OGA2 inputs are outputs of the IDT system, namely:
-
–
AstroElementaries with transit IDs and observation times,
-
–
OGA1 quaternions ,
-
–
a source catalogue with source IDs, and
-
–
a crossmatch table with pairs of source IDs and transit IDs.
-
–
-
2.
The processing steps: The attitude OGA2 is determined in one go together with daily geometric instrument calibration parameter updates and updated source positions in the framework of the First Look ODAS system which is a weighted least-square method.
-
3.
The OGA2 outputs are the B-spline representation of the improved attitude (as a function of observation time ).
Along with the OGA2, FL produces on a daily basis improved sources positions which also are used as input parameters by the photometric and spectroscopic wavelength calibrations (for the last mission data segment in each Gaia data release). The accuracy and precision levels of the source positions are the same as those of the OGA2.
2.4.6 Bias and astrophysical background determination
Author(s): Nigel Hambly
As mentioned previously in Section 2.3.5 concerning bias, on-ground monitoring of the electronic offset levels is enabled via pre-scan telemetry that arrives in one second bursts approximately once per hour per device. IDT simply analyses these bursts by recording robust mean and dispersion measures for each burst for each device, and low-order spline interpolation is employed to provide model offset levels at arbitrary times when processing samples from the CCDs. Regarding the offset non-uniformities mentioned previously we reiterate that only the readout-independent offset between the prescan level and the offset level during the image section part of the serial scan is corrected in IDT — all other small effects are ignored.
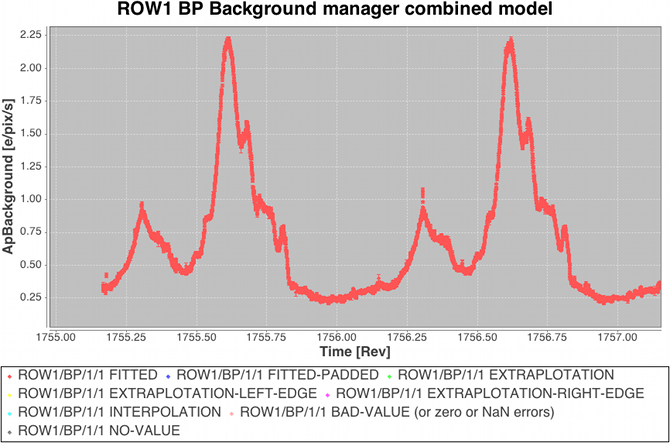
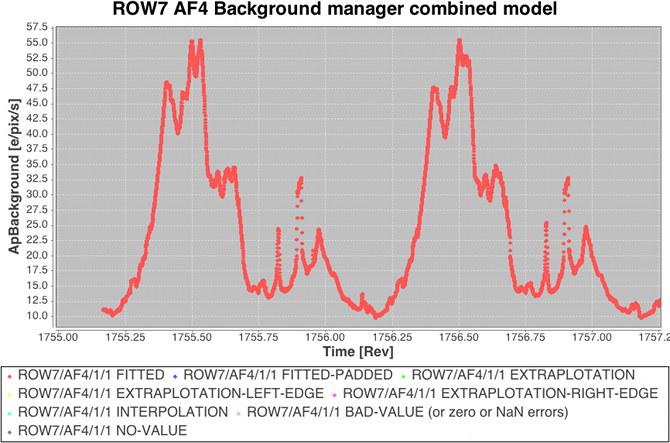
The approach to modelling the ‘large-scale’ background is to use high priority observations to measure a two-dimensional background surface independently for each device so that model values can be provided at arbitrary along-scan time and across-scan position during downstream processing (e.g. when making astrometric and photometric measurements from all science windows). A combination of empty windows (VOs) and a subset of leading/trailing samples from faint star windows are used as the input data to a linear least-squares determination of the spline surface coefficients. The procedure is iterative to enable outlier rejection of those samples adversely affected by prompt-particle events (commonly known as ‘cosmic rays’) and other perturbing phenomena. For numerical robustness the least-squares implementation employs Householder decomposition (van Leeuwen 2007) for the matrix manipulations. Some example large-scale astrophysical background models are illustrated in Figure 2.13.
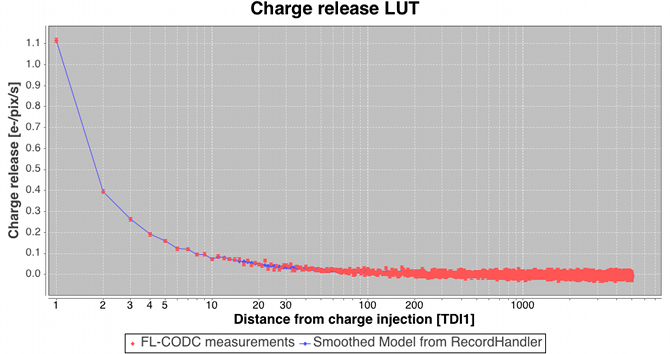
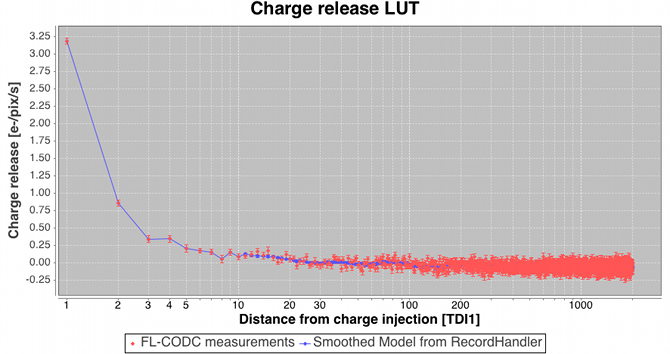
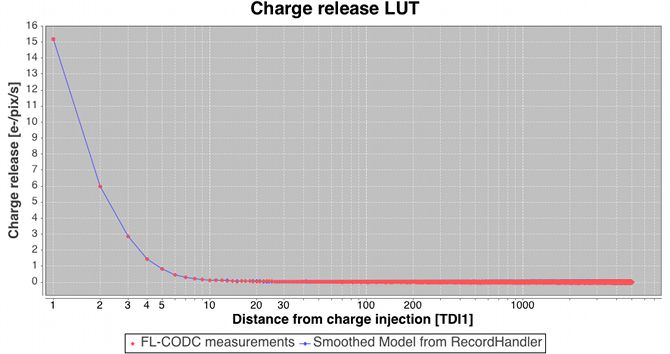
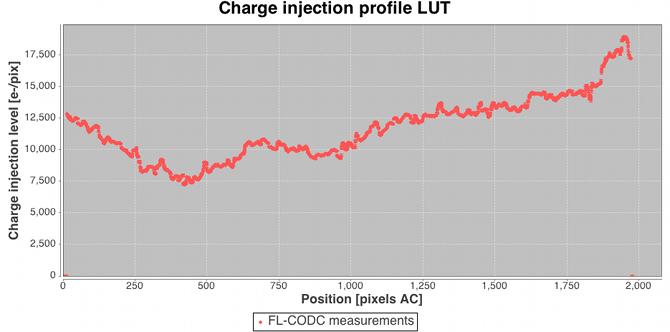
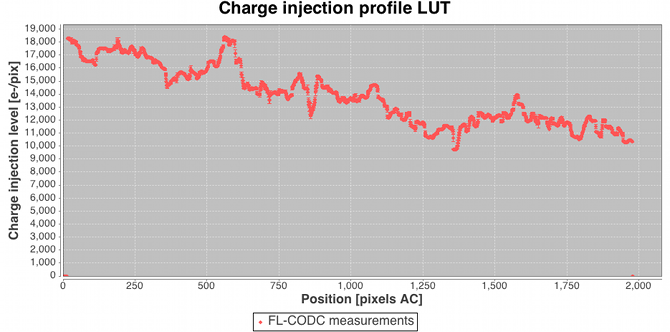
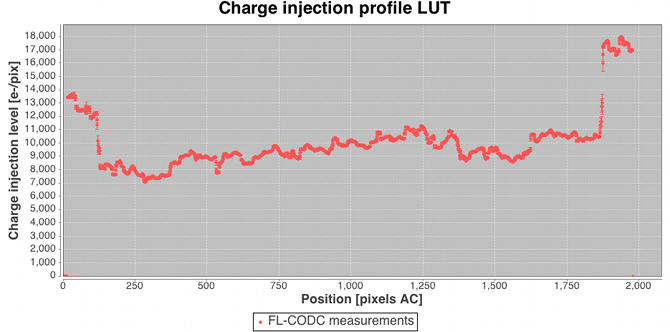
Following the large-scale background determination a set of residuals for a subset of the calibrating data are saved temporarily for use downstream in the charge release calibration process which is implemented as a ‘one day calibration’ in the First Look subsystem (see later). Residuals folded by distance from last charge injection are analysed by determining the robust mean value and formal error on that value in each TDI line after the injection. The across-scan injection profile, also determined in a one day calibration employing empty windows that happen to lie over injection lines, is used to factor out the power-law dependency of release signal versus injection level. Note that in this way new calibrations of the charge injection profile and the charge release signature are produced each day. This is done to follow the assumed slow evolution in their characteristics as on-chip radiation damage accumulates. The new calibrations are fed back into the daily pipeline at regular intervals (see later) such that an up-to-date injection/release calibration is available to all processing that requires them. Figure 2.14 shows some example charge release curves typical of those during the Gaia DR1 observation period. Example across-scan charge injection profiles are shown in Figure 2.15.
2.4.7 Spectro-Photometric Image Parameters determination
Author(s): Anthony Brown
Although the BP and RP data are treated from scratch again in the photometric processing (see Section 5), a pre-processing of these data within IDT is needed in order to derive instantaneous source colour information (which may differ from the mean source colour). The source colours are needed in the astrometric image parameters determination (Section 2.4.8).
The photometric processing is described in detail in the Gaia data release paper (See sections 5.3 and 5.4. in Fabricius et al. 2016).
2.4.8 Astrometric Image Parameters determination
Author(s): Claus Fabricius, Lennart Lindegren
The image parameter determination needs to know the relevant PSF or LSF, and as the image shape among other things depends on the source colour, we first need to determine the colour. We start with the determination of quick and simple image parameters in AF using a Tukey’s bi-weight method. The resulting positions and fluxes serve two purposes. They are used as starting points for the final image parameter determination, and they are also used to propagate the image location from the AF field to the BP and RP field in order to obtain reliable colours. This process is explained in more detail in Fabricius et al. (2016), Sect. 3.3. Note, however, that for Gaia DR1 the colour dependence of the image shapes was not yet calibrated.
The final image parameters, viz. transit time, flux, and for 2D windows also the AC position, were determined with a maximum likelihood method described in Section 2.4.8. For converting the fluxes from digital units to , gain factors determined before launch were used. The resulting parameters are stored as intermediate data for later use in the astrometric and photometric core processes.
A general Maximum-Likelihood algorithm for CCD modelling
The general principle for Maximum-Likelihood (ML) fitting of arbitrary models in the presence of Poissonian noise is quite simple and can be formulated in a general framework which is independent of the precise model. In this way it should be possible to use the same fitting procedure for 1D and 2D profile fitting to CCD sample data, as well as for more complex fitting (e.g. for estimating the parameters of the LSF model). Here we outline the basic model for this framework.
Model of sample data
The basic input for the estimation procedure consists of data and a parametrised model. The estimation procedure will adjust the model parameters until the predicted data agrees as well as possible with observed data. At the same time it will provide an estimate of the covariance matrix of the estimated parameters and a measure of the goodness-of-fit. The ML criterion is used for the fit, which in principle requires that the probability distribution of the data is known as a function of the model parameters. In practise a simplified noise model is used and this is believed to be accurate enough and leads to simple and efficient algorithms.
Let be the sample data, the model parameters, and the sample values predicted by the model for given parameters. Thus, if the model is correct and are the true model parameters, we have for each
| (2.38) |
Using a noise model, we have in addition
| (2.39) |
where is the standard deviation of the readout noise. More precisely, the adopted continuous probability density function (pdf) for the random variable is given by
| (2.40) |
valid for any real value .
It is assumed that , and are all expressed in electrons per sample (not in arbitrary AD units, voltages, or similar). In particular, is the sample value after correction for bias and gain, but including dark signal and background. The readout noise is assumed to be known; it is never one of the parameters to be estimated by the methods described in this note.
The functions are in principle defined by the various source, attitude and calibration models, including the LSF, PSF and CDM models. The set of parameters included in the vector varies depending on the application. For example, in the 1D image centroiding algorithm may consist of just two parameters representing the intensity and location of the image; in the LSF calibration process, will contain the parameters (e.g. spline coefficients) defining the LSF for a particular class of stars; and so on. The intensity model is left completely open here; the only thing we need to know about it is the number of free parameters, .
Maximum Likelihood estimation
Given a set of sample data , the ML estimation of the parameter vector is done by maximizing the likelihood function
| (2.41) |
where is the pdf of the sample value from the adopted noise model (Equation 2.40). Mathematically equivalent, but more convenient in practise, is to maximize the log-likelihood function
| (2.42) |
Using the modified Poissonian model, Equation 2.40, we have
| (2.43) |
where the additive constant absorbs all terms that do not depend on . (Remember that is never one of the free model parameters.) The maximum of Equation 2.43 is obtained by solving the simultaneous likelihood equations
| (2.44) |
Using Equation 2.43 these equations become
| (2.45) |
2.4.9 Crossmatch (XM) processing
Author(s): Javier Castañeda
The crossmatch provides the link between the Gaia detections and the entries in the Gaia working catalogue. It consists of a single source link for each detection, and consequently a list of linked detections for each source. When a detection has more than one source candidate fulfilling the match criterion, in principle only one is linked, the principal match, while the others are registered as ambiguous matches.
To facilitate the identification of working catalogue sources with existing astronomical catalogues, the crossmatch starts from an initial source list, as explained in Section 2.2.3, but this initial catalogue is far from complete. The resolution of the crossmatch will therefore often require the creation of new source entries. These new sources can be created directly from the unmatched Gaia detections.
A first, preliminary crossmatching pre-processing is done on a daily basis, in IDT, to bootstrap downstream DPAC systems during the first months of the mission, as well as to process the most recent data before it reaches cyclic pre-processing in IDU. By definition, such daily crossmatching cannot be completely accurate, as some data will typically arrive with a delay of some hours or even days to IDT.
On the other hand, the final crossmatching (also for the present release) is executed by IDU over the complete set of accumulated data. This provides better consistency as having all of the data available for the resolution allows a more efficient resolution of dense sky regions, multiple stars, high proper motion sources and other complex cases. Additionally in the cyclic processing, the crossmatch is revised using the improvements on the working catalogue, of the calibrations, and of the removal of spurious detections (see Section 2.4.9).
Some of the crossmatching algorithms and tasks are nearly identical in the daily and cyclic executions, but the most important ones are only executed in the final crossmatching done by IDU.
For the cyclic executions of the crossmatch the data volume is rather small. However the number of detections will be huge at the end of the mission, reaching records. Ideally, the crossmatch should handle all these detections in a single process, which is clearly not an efficient approach, especially when deploying the software in a computer cluster. The solution is to arrange the detections by spatial index, such as HEALPix (Górski et al. 2005), and then distribute and treat the arranged groups of detections separately. However, this solution presents some disadvantages:
-
•
Complicated treatment of detections close to the region boundaries of the adopted spatial arrangement.
-
•
Handling of detections of high proper motion stars which cannot be easily bounded to any fixed region.
-
•
Repeated accessing to time-based data such as attitude and geometric calibration from spatially distributed jobs.
These issues could in principle be solved but would introduce more complexity into the software. Therefore another procedure better adapted to Gaia operations has been developed. This processing splits the crossmatch task into three different steps.
- Detection Processor
- Sky Partitioner
-
This second step is in charge of grouping the results from the previous step according to the source candidates provided for each individual detection. The objective is to determine isolated groups of detections, all located in a rather small and confined sky region which are related to each other according to the source candidates. Therefore, this step does not perform any scientific processing but provides an efficient spatial data arrangement by solving any region boundary issues and high proper motion scenarios. Therefore, this stage acts as a bridge between the time-based and the final spatial-based processing. See Section 2.4.9.
- Match Resolver
-
Final step where the crossmatch is resolved and the final data products are produced. This step is ultimately a spatial-based processing where all detections from a given isolated sky region are treated together, thus taking into account all observations of the sources within that regiod Rel n from the different scans. See Section 2.4.9.
In the following subsections we describe the main processing steps and algorithms involved in the crossmatching, focusing on the cyclic (final) case.
Sky Coordinates determination
The images detected on board, in the real-time analysis of the sky mapper data, are propagated to their expected transit positions in the first strip of astrometric CCDs, AF1, i.e. their transit time and AC column are extrapolated and expressed as a reference acquisition pixel. This pixel is the key to all further on-board operations and to the identification of the transit. For consistency, the crossmatch does not use any image analysis other than the on-board detection, and is therefore based on the reference pixel of each detection, even if the actual image in AF1 may be slightly offset from it. This decision was made because, in general, we do not have the same high-resolution SM and AF1 images on ground as the ones used on board.
The first step of the crossmatch is the determination of the sky coordinates of the Gaia detections, but only for those considered genuine. As mentioned, the sky coordinates are computed using the reference acquisition pixel in AF1. The precision is therefore limited by the pixel resolution as well as by the precision of the on-board image parameter determination. The conversion from the observed positions on the focal plane to celestial coordinates, e.g. right ascension and declination, involves several steps and reference systems as shown in Figure 2.16.
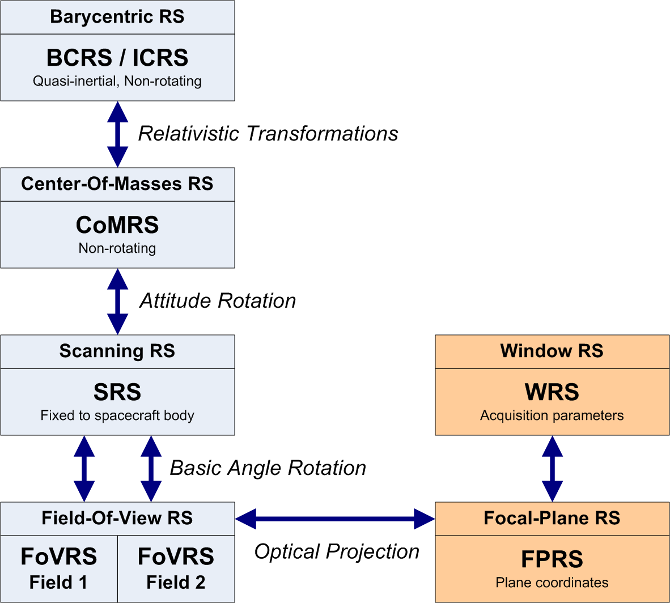
The reference system for the source catalogue is the Barycentric Celestial Reference System (BCRS/ICRS), which is a quasi-inertial, relativistic reference system non-rotating with respect to distant extra-galactic objects. Gaia observations are more naturally expressed in the Centre-of-Mass Reference System (CoMRS) which is defined from the BCRS by special relativistic coordinate transformations. This system moves with the Gaia spacecraft and is defined to be kinematically non-rotating with respect to the BCRS/ICRS. BCRS is used to define the positions of the sources and to model the light propagation from the sources to Gaia. Observable proper directions towards the sources as seen by Gaia are then defined in CoMRS. The computation of observable directions requires several sorts of additional data like the Gaia orbit, solar system ephemeris, etc. As a next step, we introduce the Scanning Reference System (SRS), which is co-moving and co-rotating with the body of the Gaia spacecraft, and is used to define the satellite attitude. Celestial coordinates in SRS differ from those in CoMRS only by a spatial rotation given by the attitude quaternions. The attitude used to derive the sky coordinates for the crossmatch is the initial attitude reconstruction OGA1 described in Section 2.4.5.
We now introduce separate reference systems for each telescope, called the Field of View Reference Systems (FoVRS) with their origins at the centre of mass of the spacecraft and with the primary axis pointing to the optical centre of each of the fields, while the third axis coincides with the one of the SRS. Spherical coordinates in this reference system, the already mentioned field angles (), are defined for convenience of the modelling of the observations and instruments. Celestial coordinates in each of the FoVRS differ from those in the SRS only by a fixed nominal spatial rotation around the spacecraft rotation axis, namely by half the basic angle of 106 degrees.
Finally, and through the optical projections of each instrument, we reach the focal plane reference system (FPRS), which is the natural system for expressing the location of each CCD and each pixel. It is also convenient to extend the FPRS to express the relevant parameters of each detection, specifically the field of view, CCD, gate, and pixel. This is the Window Reference System (WRS). In practical applications, the relation between the WRS and the FoVRS must be modelled. This is done through a geometric calibration, expressed as corrections to nominal field angles as detailed in Section 3.3.5.
The geometric calibration used in the daily pipeline is derived by the First-Look system in the ‘One-Day Astrometric Solution’ (ODAS), see Section 2.4.5 whereas the calibration for cyclic system is produced by AGIS.
Scene determination
The scene is in charge of providing a prediction of the objects scanned by the two fields of view of Gaia according to the spacecraft attitude and orbit, the planetary ephemeris and the source catalogue. It was originally introduced to track the illumination history of the CCDs columns for the parametrization of the CTI mitigation. However, this information is also relevant for:
-
•
The astrophysical background estimation and the LSF/PSF profile calibration, to identify the nearby sources that may be affecting a given observation. The scene can easily reveal if the transit is disturbed or polluted by a parasitic source.
-
•
The crossmatch, to identify sources that will probably not be detected directly, but still leave many spurious detections, for example from diffraction spikes or internal reflections.
Therefore, the scene does not only include the sources actually scanned by both fields of view but it also identifies:
-
•
Sources without the corresponding Gaia observations. This can happen in the case of:
-
–
Very bright sources (brighter than 6th magnitude) and SSO transits not detected in the Sky Mapper (SM) or not finally confirmed in the first CCD of the Astrometric Field (AF1).
-
–
Very high proper motion SSO, detected in SM but not successfully confirmed in AF1.
-
–
High density regions where the on board resources are not able to cope with all the crossing objects.
-
–
Very close sources where the detection and acquisition of two separate observations is not feasible due to the capacity of the Video Processing Unit.
-
–
Data losses due to: on board storage overflow, data transfer issues or processing errors.
-
–
-
•
Sources falling into the edges and between CCD rows.
-
•
Sources falling out of both fields of view but so bright that they may disturb or pollute nearby observations.
It must be specially noted that the scene is established not from the individual observations, but from the catalogue sources and planetary ephemeris and is therefore limited by the completeness and quality of those input tables.
Spurious Detections identification
The Gaia on-board detection software was built to detect point-like images on the SM CCDs and to autonomously discriminate star images from cosmic rays, etc. For this, parametrised criteria of the image shape are used, which need to be calibrated and tuned. There is clearly a trade-off between a high detection probability for stars at 20 mag and keeping the detections from diffraction spikes (and other disturbances) at a minimum. A study of the detection capability, in particular for non-saturated stars, double stars, unresolved external galaxies, and asteroids is provided by de Bruijne et al. (2015).
The main problem with spurious detections arises from the fact that they are numerous (15–20% of all detections), and that each of them may lead to the creation of a (spurious) new source during the crossmatch. Therefore, a classification of the detections as either genuine or spurious is needed to only consider the former in the crossmatch.
The main categories of spurious detections found in the data so far are:
-
•
Spurious detections around and along the diffraction spikes of sources brighter than approximately 16 mag. For very bright stars there may be hundreds or even thousands of spurious detections generated in a single transit, especially along the diffraction spikes in the AL direction, see Fig. 2.17 for an extreme example.
-
•
Spurious detections in one telescope originating from a very bright source in the other telescope, due to unexpected light paths and reflections within the payload.
-
•
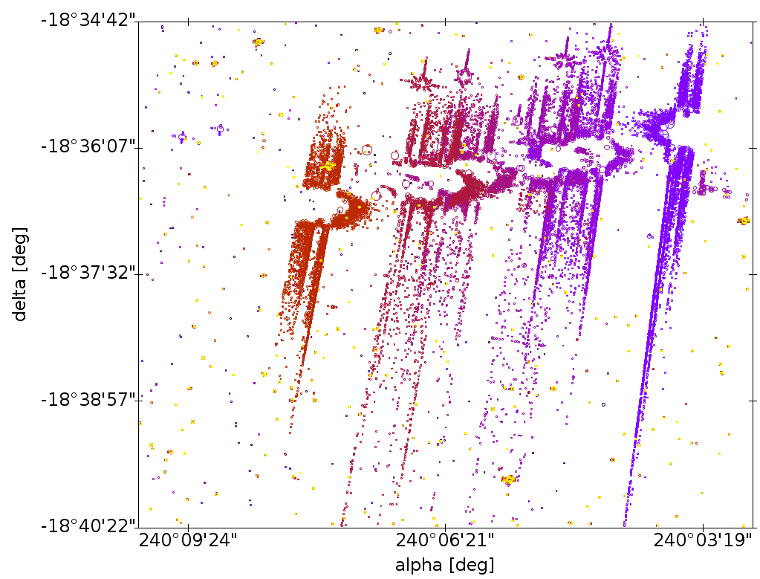
Spurious detections from major planets. These transits can pollute large sky regions with thousands of spurious detections, see Fig. 2.18, but they can be easily removed.
-
•
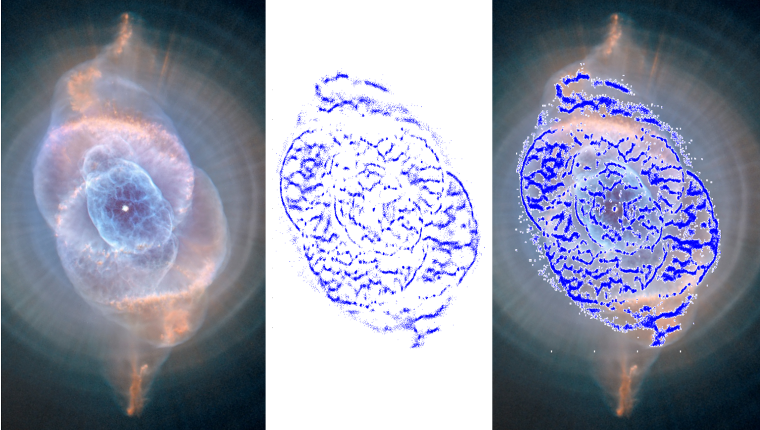
Detections from extended and diffuse objects. Fig. 2.19 shows that Gaia is actually detecting not only stars but also filamentary structures of high surface brightness. These detections are not strictly spurious, but require a special treatment, and are not processed for Gaia DR1.
-
•
Duplicated detections produced from slightly asymmetric images where more than one local maximum is detected. These produce redundant observations and must be identified during the crossmatch.
-
•
Spurious detections due to cosmic rays. A few manage to get through the on-board filters, but these are relatively harmless as they happen randomly across the sky.
-
•
Spurious detections due to background noise or hot CCD columns. Most are caught on-board, so they are few and cause no serious problems.
No countermeasures are yet in place for Gaia DR1 for the last two categories, but this has no impact on the published data, as these detections happen randomly on the sky and there will be no corresponding stellar images in the astrometric (AF) CCDs.
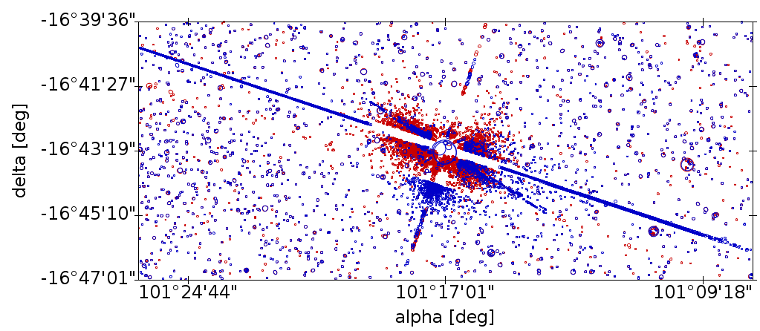
For Gaia DR1 we identify spurious detections around bright source transits, either using actual Gaia detections of those or the predicted transits obtained in the scene, and we select all the detections contained within a predefined set of boxes centred on the brightest transit. The selected detections are then analysed, and they are classified as spurious if certain distance and magnitude criteria are met. These predefined boxes have been parametrised with the features and patterns seen in the actual data according to the magnitude of the source producing the spurious detections.
For very bright sources (brighter than 6 mag) and for the major planets this model has been extended. For these cases, larger areas around the predicted transits are considered. Also both fields of view are scanned for possible spurious detections.
Identifying spurious detections around fainter sources (down to 16 mag) is more difficult, since there are often only very few or none. In these cases, a multi-epoch treatment is required to know if a given detection is genuine or spurious – i.e. checking if more transits are in agreement and resolve to the same new source entry. These cases will be addressed in future data releases as the data reduction cycles progress and more information from that sky region is available.
Finally, spurious new sources can also be introduced by excursions of the on-ground attitude reconstruction used to project the detections on the sky (i.e. short intervals of large errors in OGA1), leading to misplaced detections. Therefore, the attitude is carefully analysed to identify and clean up these excursions before the crossmatch is run.
Detection Processor
This processing step is in charge of providing an initial list of source candidates for each individual observation.
The first step is the determination of the sky coordinates as described in Section 2.4.9. This step is executed in multiple tasks split by time interval blocks. All Gaia observations enter this step, with the exception of Virtual Objects, and data from dedicated calibration campaigns. Also, all the observations positively classified as spurious detections are filtered out.
Once the observation sky coordinates are available these are compared with a list of sources. In this step, the Obs–Src Match, the sources that cover the sky seen by Gaia in the time interval of each task are extracted from the Gaia catalogue. These sources are propagated with respect to parallax, proper motion, orbital motion, etc. to the relevant epoch.
The candidate sources are selected based on a pure distance criterion. The decision of only using distance was taken because the position of a source changes slowly and predictably, whereas other parameters such as the magnitude may change in an unpredictable way. Additionally, the initial Gaia catalogue is quite heterogeneous, exhibiting different accuracies and errors which suggest the need of a match criterion subjected to the provenance of the source data. In later stages of the mission, when the source catalogue is dominated by Gaia astrometry, this dependency can be removed and then the criterion should be updated to take advantage of the better accuracy of the detection in the along scan direction. At that point it will be possible to use separate along and across scan criteria, or use an ellipse with the major axis oriented across scan which will benefit the resolution of the most complex cases.
A special case is the treatment of solar system objects observations. The processing of these objects are the responsibility of CU4 and for this reason no special considerations have been implemented in the crossmatch. These observations will have Gaia Catalogue entries created on daily basis by IDT and those entries will remain, so the corresponding observations will be matched again and again to their respective sources without any major impact on the other observations.
An additional processing may be required when we find observations with no source candidates at all after these observation to source matching process. In principle this situation should be rare as IDT has already treated all observations before IDU runs. However, unmatched observations may arise because of IDT processing failures, updates in the detection classification, updates in the source catalogue or simply the usage of a more strict match criterion in IDU. Thus, this additional process is basically in charge of processing the unmatched observations and creating temporary sources as needed just to remove all the unmatched observations in a second run of the source matching process. The new sources created by these tasks will ultimately be resolved (by confirmation or deletion) in the last crossmatch step.
Summarising, the result of this first step is a set of MatchCandidates for the whole accumulated mission data. Each MatchCandidate corresponds to a single detection and contains a list of source candidates. Together with the MatchCandidates, an auxiliary table is also produced to track the number of links created to each source, the SourceLinksCount. Results are stored in a space based structure using HEALPix Górski et al. (2005) for convenience of the next processing steps.
Sky Partitioner
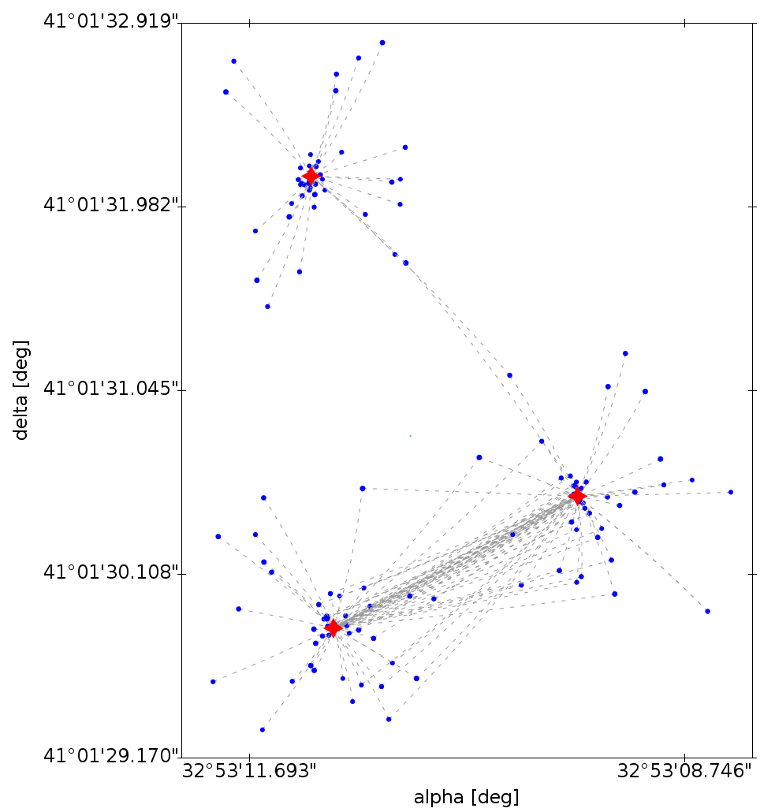
The Sky Partitioner task is in charge of grouping the results of the Obs–Src Match according to the source candidates provided for each individual detection. The purpose of this process is to create self contained groups of MatchCandidates. The process starts loading all MatchCandidates for a given sky region. From the loaded entries, the unique list of matched sources is identified and the corresponding SourceLinksCount information is loaded. Once loaded, a recursive process is followed to find the isolated and self contained groups of detections and sources. The final result of this process is a set of MatchCandidateGroups (as shown in Figure 2.20) where all the input observations are included. In summary, within a group all observations are related to each other by links to source candidates. Consequently, sources present in a given group are not present in any other group.
In early runs, there is a certain risk to end with unmanageably big groups. For those cases we have introduced a limit in the number of sources per group so the processing is not stopped. The adopted approach may create spurious or duplicated sources in the overlapped area of these groups. However, as the cyclic processing progresses, these cases should disappear (groups will be reduced) due to better precision in the catalogue, improved attitude and calibration and the adoption of smaller match radius. So far we have not encountered any of these cases and therefore we have not reached the practical limit for the number of sources per group.
After this process each MatchCandidateGroup can be processed independently from the others as the observations and sources from two different groups do not have any relation between them.
Crossmatch resolution
The final step of the crossmatch is the most complex, resolving the final matches and consolidating the final new sources. We distinguish three main cases to solve:
-
•
Duplicate matches: when two (or more) detections close in time are matched to the same source. This will typically be either newly resolved binaries or spurious double detections.
-
•
Duplicate sources: when a pair of sources from the catalogue have never been observed simultaneously, thus never identifying two detections within the same time frame, but having the same matches. This can be caused by double entries in the working catalogue.
-
•
Unmatched observations: observations without any valid source candidate.
For the first cyclic processing, the resolution algorithm has been based on a nearest-neighbour solution where the conflict between two given observations is resolved independently from the other observations included in the group. This is a very simple and quick conflict resolution algorithm. However, this approach does not minimize the number of new sources created, when more than two observations close in time have the same source as primary match.
The crossmatch resolution algorithms in forthcoming Gaia data releases will be based on much more sophisticated. In particular, the next crossmatch will use clustering solutions and algorithms where all the relations between the observations contained in each group are taken into account to generate the best possible resolution.