10.11.4 Processing steps
The processing of the SOS Cep&RRL pipeline includes the following steps that are in common to both RR Lyrae stars and Cepheids (see figure 1 in Clementini et al. 2019):
-
1.
derivation of period and harmonics (amplitudes and phases) by non-linear Fourier analysis;
-
2.
measurement of the light and radial velocity curve parameters (intensity-averaged mean magnitudes, mean radial velocity, amplitudes, epochs of maximum light for the photometry, epoch of minimun for the radial velocity, etc.);
-
3.
consistency check of the periods derived from the 3 photometric bands (, , and );
-
4.
search for secondary periodicities, performed only for sources with transits in the band and with scatter of the best-fit model of the RR Lyrae -band light curves larger than 0.05 mag.
The following additional steps are then applied to sources confirmed as RR Lyrae stars (see figure 2 in Clementini et al. 2019):
-
1.
identification of double-mode RR Lyrae stars;
-
2.
non-linear modelling of double-mode RR Lyrae stars;
-
3.
pulsation mode identification;
-
4.
RR Lyrae classification and validation;
-
5.
stellar parameters derivation: metallicity;
-
6.
stellar parameters derivation: absorption in the -band for RRab stars (g_absorption).
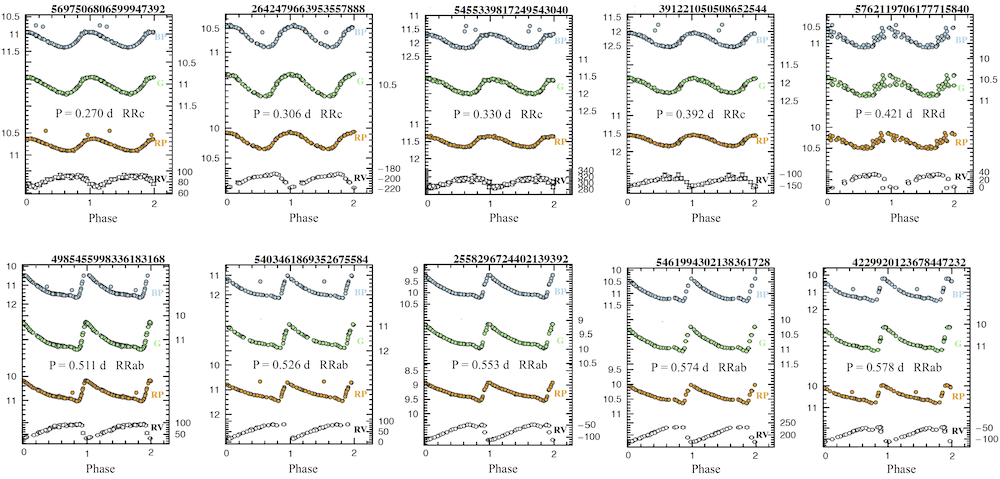
Examples of , , light curves and radial velocity curves for first overtone (RRc), double-mode (RRd) and fundamental mode (RRab) RR Lyrae stars confirmed and fully characterized by the SOS Cep&RRL pipeline are shown in Figure 10.28.