10.9.5 Quality assessment and validation
Verification
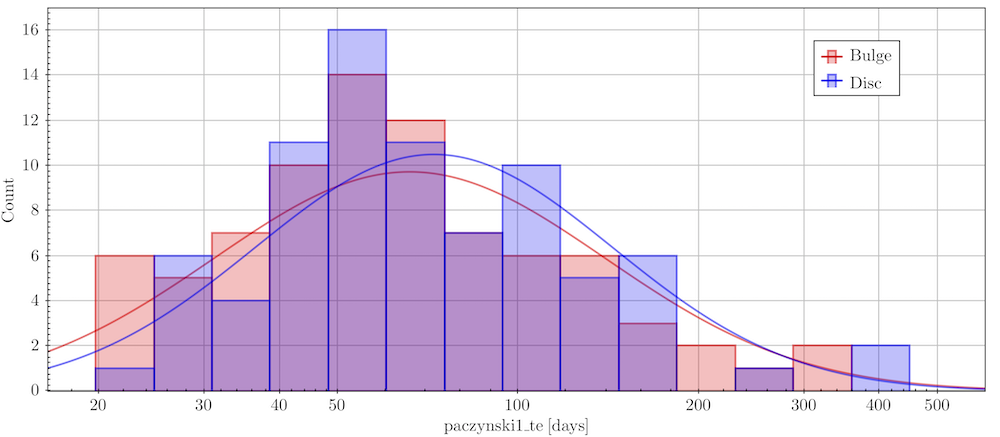
Both sets A and B were verified with the visual inspection by Ł. Wyrzykowski, K. Kruszyńska, and K. Rybicki, who independently viewed the plots of light curves with models from Level 0, Level 1, and Level 2. In the first round, only sources with positive votes from all three persons were accepted. In the second round, sources with two positive votes from the previous round were reviewed and re-assessed. In the end, 164 events were accepted (set A1). Their timescale distribution obtained from Level 1 is shown in Figure 10.23.
Most of the events were identified within the Galactic plane, where the Microlensing membership score was the highest. Only one candidate was at Galactic latitude , which was also identified as a candidate for AGN (Section 10.4). We have removed this source from our sample, leaving 163 Microlensing events as the final outcome of the pipeline.
The second set, containing literature sources (set B), has also been inspected visually, checking primarily whether light curves contained at least three robust data points during the event. Following visual inspections, 233 candidates have been accepted (set B1).
There is an overlap in the classification of Microlensing events from sets A1 and B1 with another class of variables, as eight sources are also identified as potential Long Period Variables (Section 10.8). The exact distinction between these classes is debatable without further study and follow-up observations.
Validation
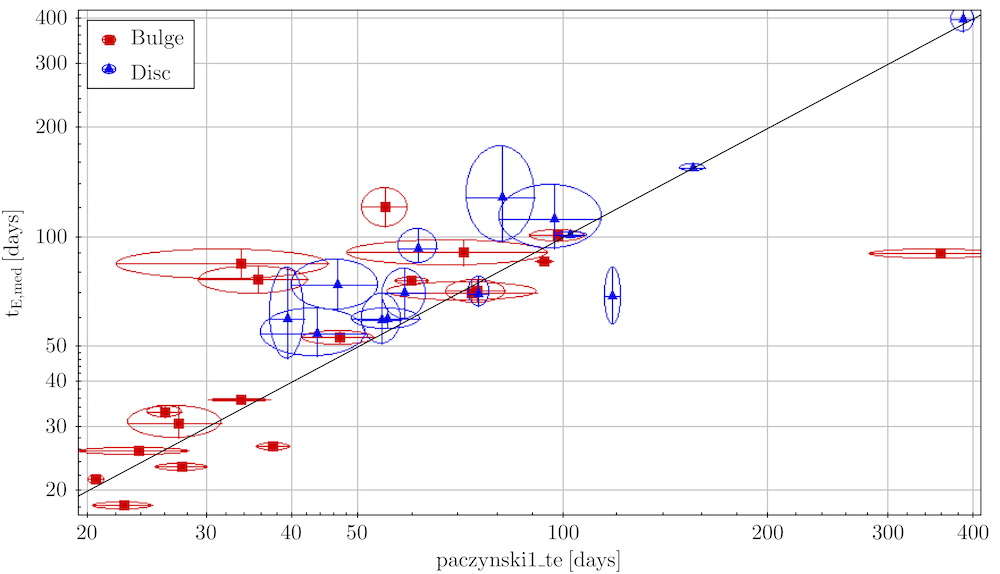
In order to validate the results, we used the cross-match between Gaia DR3 candidates from set A1 and OGLE-IV events published in Mróz et al. (2019, 2020) for standard Paczynski model-like events. There were 33 events in common with both surveys: 22 in the Galactic bulge region (defined by Galactic longitudes within of the centre) and 11 in the Galactic disc region. We have also cross-matched set A1 with possible microlensing events from Mróz et al. (2020) and found 9 events in common.
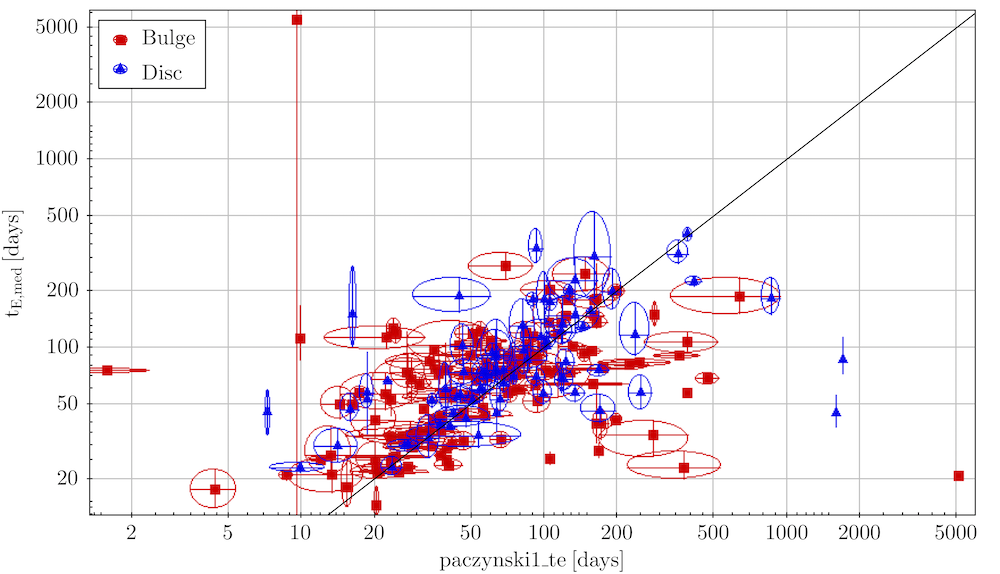
The main Microlensing parameter to validate is the timescale of the event (the Einstein radius crossing time, ). We compared OGLE-IV timescales found with the blended model in a single lens (without parallax effect) with Gaia’s value from Level 1 model fitting. Figure 10.24 shows a comparison between the timescales of the 33 events matched between OGLE-IV and Gaia in the Galactic disc and bulge. Except for one event (source_id 4066190335405241216) at very long timescale ( days), most of the timescales are in agreement within the reported uncertainties. We present the same comparison for OGLE-IV events from set B1 in Figure 10.25.
Cross-match with the OGLE Early Warning System (OGLE EWS, Udalski et al. 2015) yielded 43 events in set A1 and 137 events in set B1. Seventeen events from OGLE EWS appeared in both sets A1 and B1, and they were also reported in Mróz et al. (2019, 2020).
Cross-match was also performed with the MOA (Abe et al. 1997) and KMTNet (Kim et al. 2016) microlensing surveys and their alerts. We identified 80 events in common with Gaia and KMTNet and 43 in common with MOA. Vast majority of them were also reported by the OGLE EWS or published in Mróz et al. (2019, 2020). Only six events from Gaia were not discovered by OGLE and found by MOA or KMTNet.
Cross-match with the ASAS-SN (Shappee et al. 2014) yielded one event for set A1, ASASSN-16li. This event appears also in the Mróz et al. (2020) list of possible microlensing events. As mentioned in Section 10.9.4, two events reported by ASAS-SN were added to the literature sample and passed the visual inspection (set B1), ASASSN-16oe (source_id 6059816980526317568) and ASASSN-V J044558.57+081444.6 (source_id3292310414861319936).
There was no overlap in time between Gaia DR3 and the ZTF survey (Bellm et al. 2019), which started in 2018, therefore none of the microlensing events reported here were observed by the ZTF survey.
Cross-match with the Gaia Science Alerts (Hodgkin et al. 2021) yielded one event (Gaia17aqu, source_id 5599913394301352832) in set A1, which is not fully covered in Gaia DR3, i.e., only the rising and the peak portions of the light curve are present within the Gaia DR3 time span. Set B1 contains eight events found in Gaia Science Alerts, including Gaia17aqu.
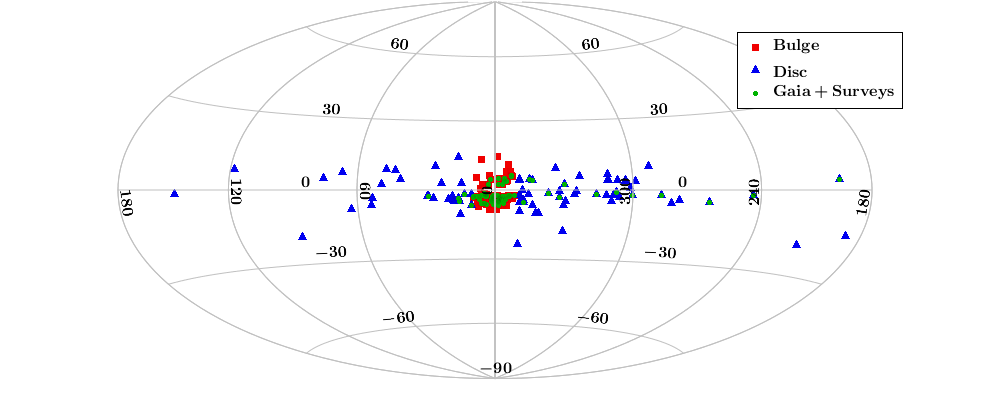
In summary, 273 events were found by other surveys, notably 73 events in set A1 were known before. The total number of new and unique discoveries of Gaia is therefore 90 events. Figure 10.26 shows the sky distribution of Gaia microlensing candidates in set A1 and the ones in common with other public surveys are marked with green points.