10.5.2 Properties of the input data
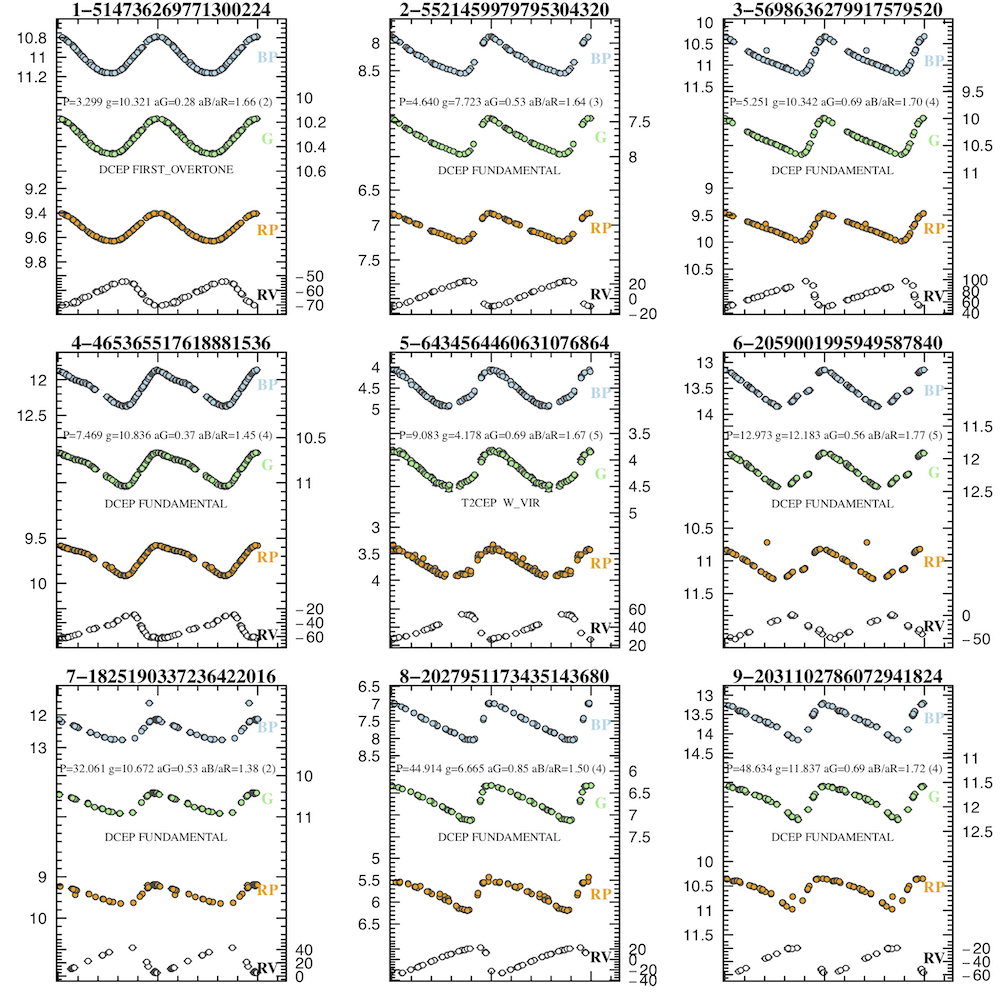
Input data consisted of time-series in the , , bands (when and were available), and radial velocities for a sub-sample of Cepheids. Examples of light and radial velocity curves are shown in Figure 10.8.

The sources analysed by the package were selected according to the following criteria:
-
•
sources classified as candidate Cepheid variables from the Classifiers;
-
•
a minimum number of 12 -FoV transits, after applying the general outlier removal
MultibandOutlierRemovalOperator (Section 10.2.3), as well as the
RemoveOutliersFaintAndBrightOperator outlier removal operator, whose parameters were fine tuned to discard residual outliers in the Cepheid light curves; -
•
a minimum number of five transits for the publication of the RV time-series and of eight transits for the modelling of the folded RV curve;
-
•
a peak-to-peak amplitude 0.1 mag in the -band;
-
•
search of a second periodicity only for sources with a minimum number of more than 40 -FoV transits and with scatter with respect to the modelled -band light curve larger than 0.025 mag.