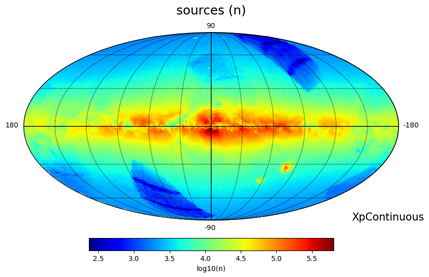
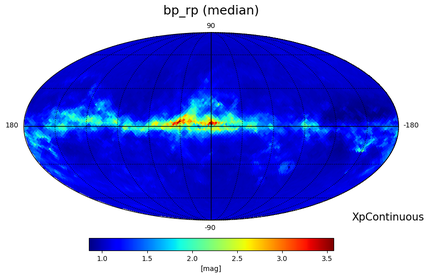
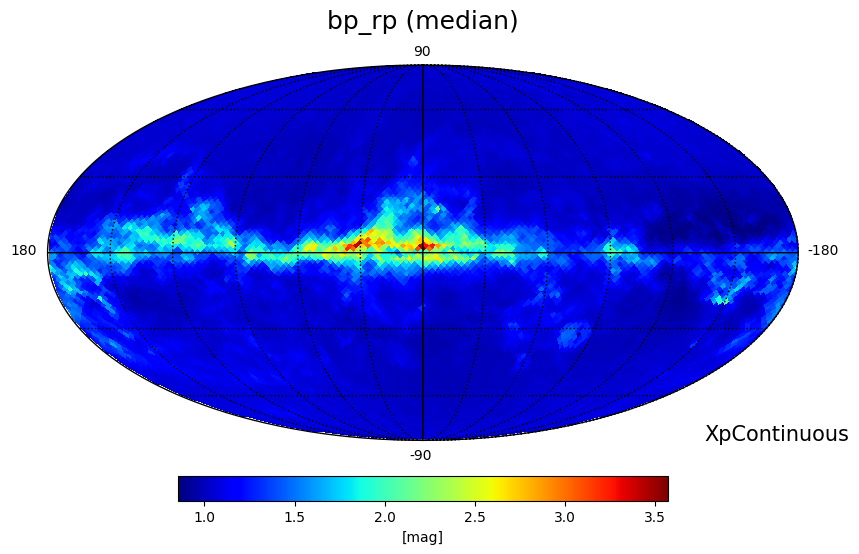
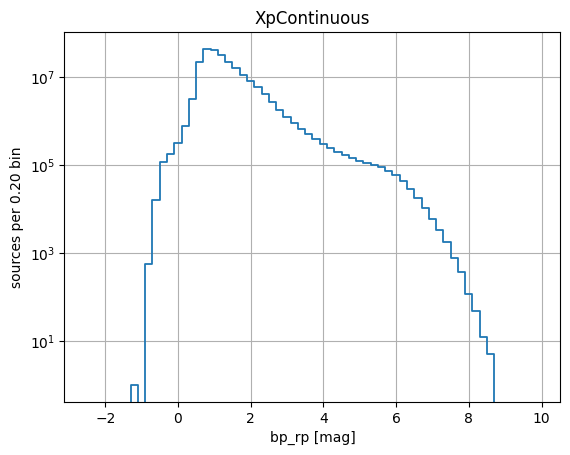
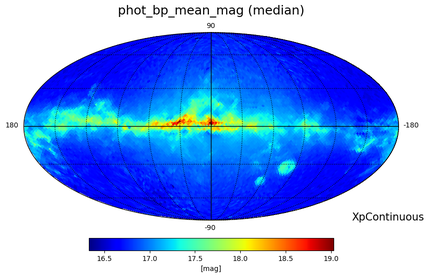
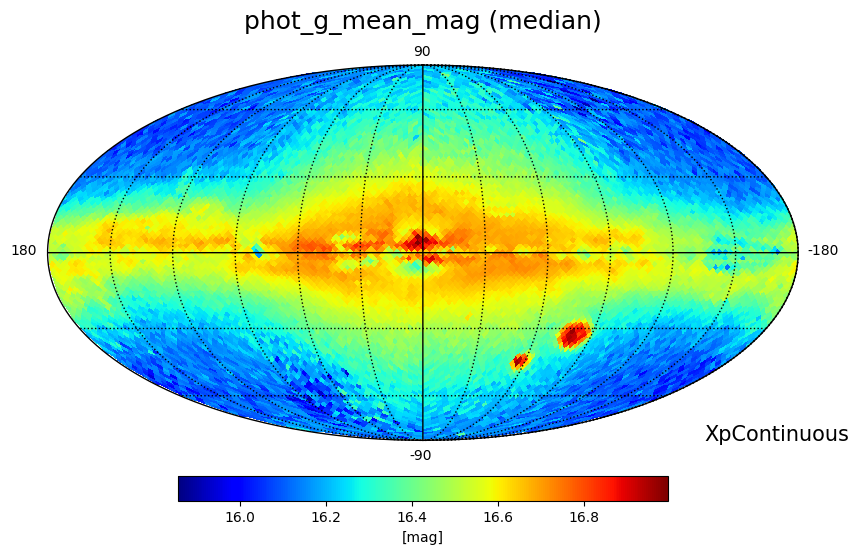
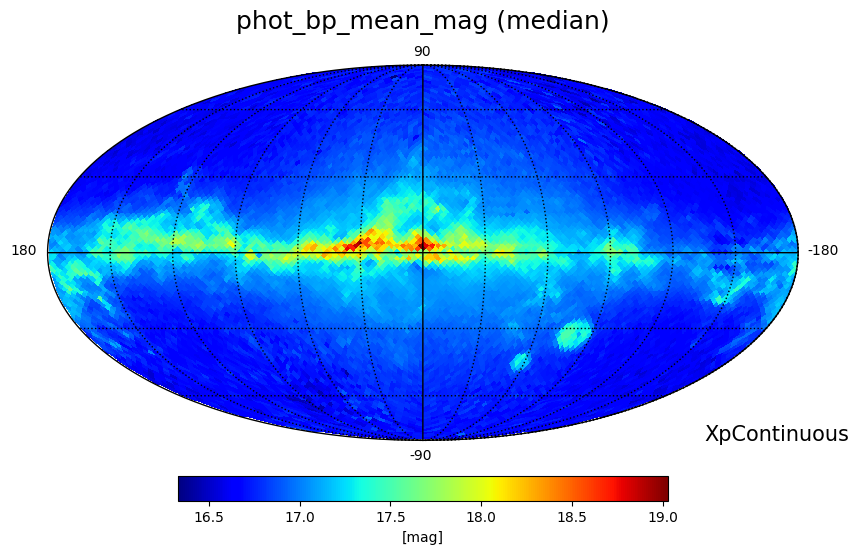
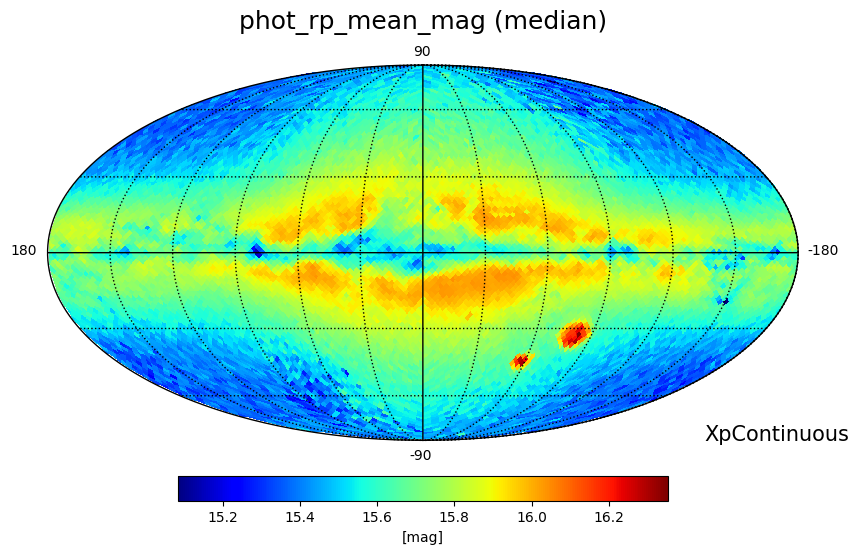
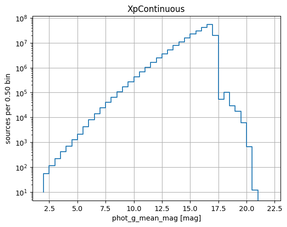
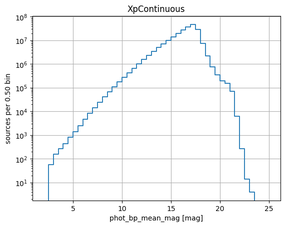
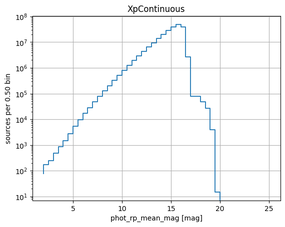
skip to main content

gaia data release 3 documentation

17.2 Catalogue plots

17.2.12 XP Continuous Mean Spectra

Figure 17.57: HEALPix map of the number of sources with XpContinuousMeanSpectrum (large image), 
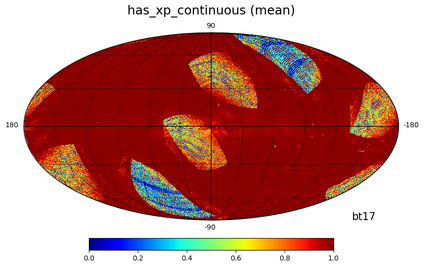
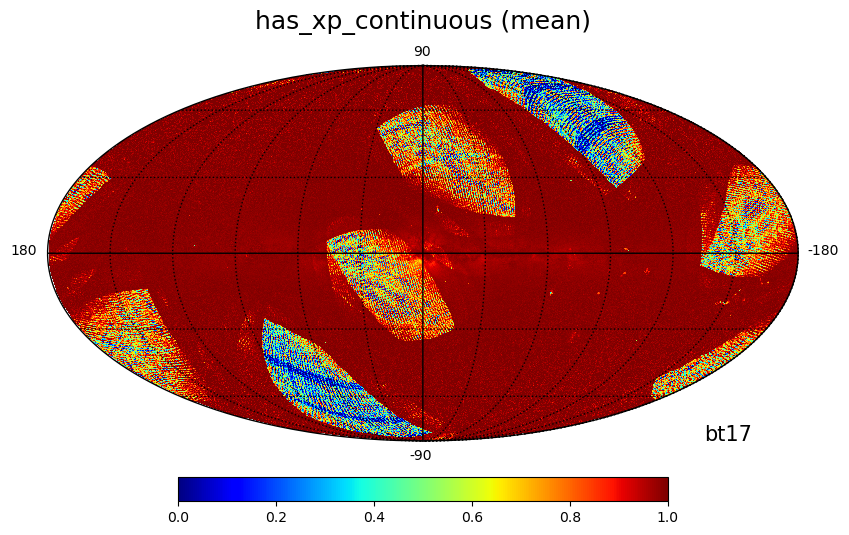
the mean of has_xp_continuous(large image) for sources brighter than magnitude 17, 
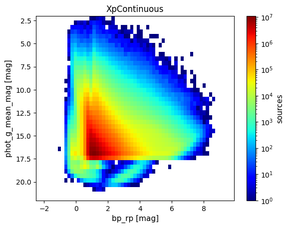
and 2D histogram (large image), using bins of 0.5 mag for G and 0.2 mag for GBP-GRP.

Figure 17.58: 2D histogram of the normalized BP (large image) and RP (large image) coefficients.

Figure 17.59: HEALPix map of median GBP-GRP magnitude (large image) and 1D histogram (large image) for sources with XpContinuousMeanSpectrum.

Figure 17.60: HEALPix map of median G (large image), median GBP (large image) and median GRP (large image) magnitudes for sources with XpContinuousMeanSpectrum.

Figure 17.61: Histogram of G (large image), GBP (large image) and GRP (large image) magnitudes for sources with XpContinuousMeanSpectrum.