skip to main content
→
European Space Agency
About ESAC
gaia data release 3 documentation
Show
Contents
Gaia Data Release 3
Documentation release 1.3
Gaia Data Release 3
Documentation release 1.3
I
Introduction to Gaia Data Release 3
II
Gaia data processing
III
Gaia data analysis
IV
Gaia catalogue
13
Consolidation
14
Validation
15
Cross-match with external catalogues
16
Cross-match with Gaia DR2
17
Catalogue statistics and plots
17.1
Catalogue statistics
17.2
Catalogue plots
17.2.1
Sky Density
17.2.2
Photometry
17.2.3
Positions
17.2.4
Parallaxes
17.2.5
Proper motions
17.2.6
Astrometric correlations
17.2.7
Observations
17.2.8
Radial Velocity
17.2.9
Radial Velocity Spectra
17.2.10
Other astrometric parameters
17.2.11
Astrophysical Parameters
17.2.12
XP Continuous Mean Spectra
17.2.13
Non Single Stars
17.2.14
Extragalactic Objects
V
Gaia archive
Miscellaneous
Bibliography
17.2
Catalogue plots
17.2.7
Observations
17.2.9
Radial Velocity Spectra
17.2.8
Radial Velocity
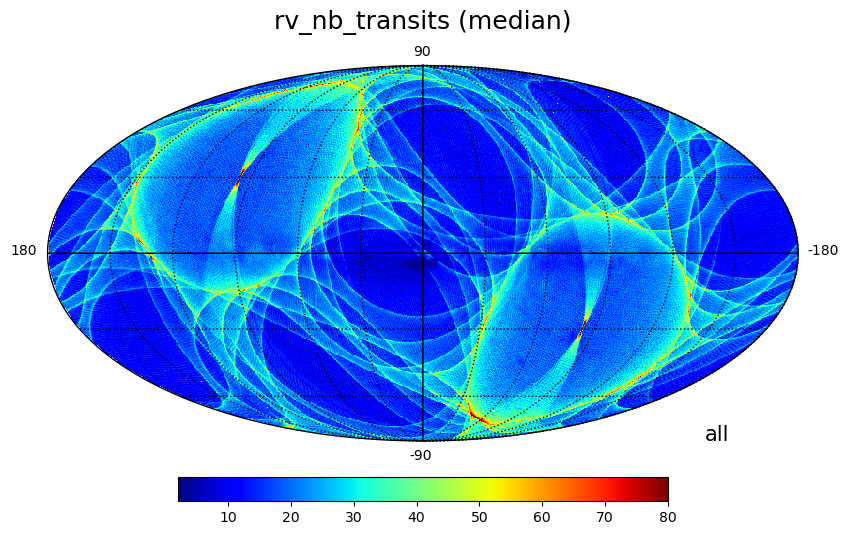
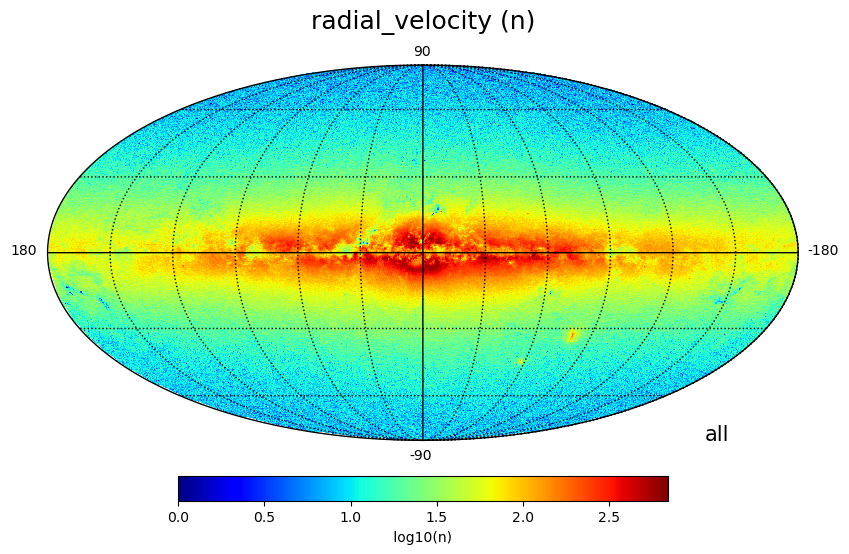
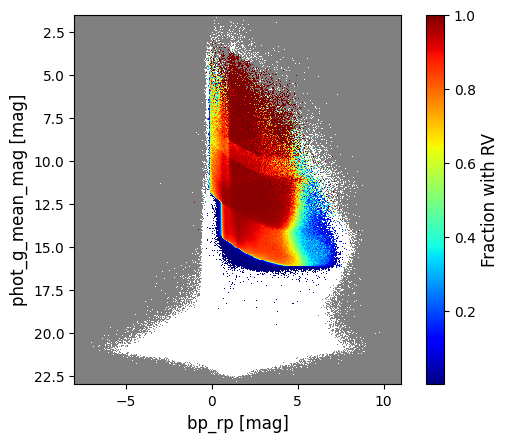
Figure 17.36:
HEALPix map of radial velocity transits per source (
rv_nb_transits
)
(large image)
, number of sources with
V
rad
(large image)
and the fraction of sources with
V
rad
(large image)
.
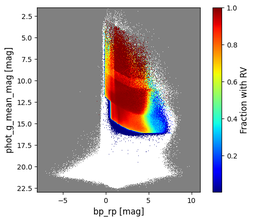
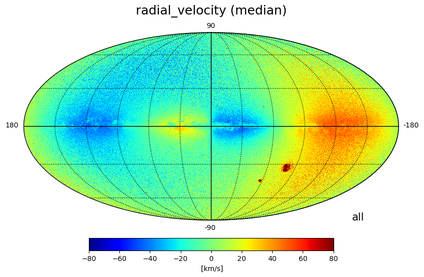
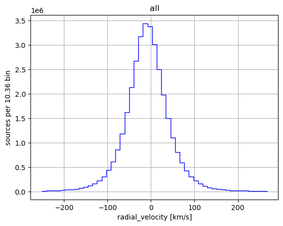
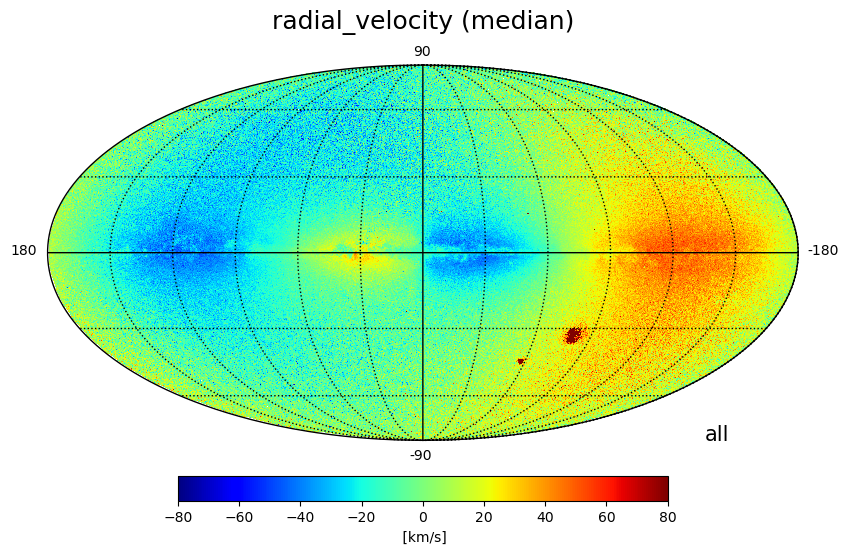
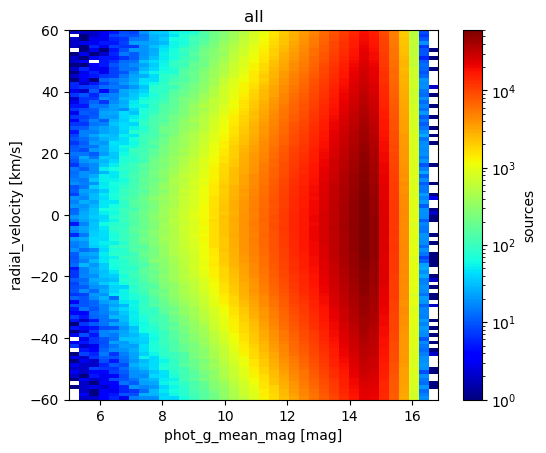
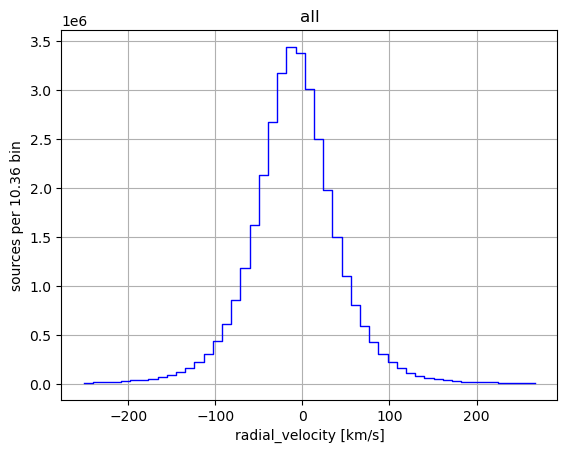
Figure 17.37:
HEALPix map of the median
V
rad
(large image)
, 2D histogram as a function of
G
magnitude
(large image)
, using bins of 0.32 mag for
G
and 1.2
km
s
-
1
for
V
rad
, and histogram of
V
rad
(large image)
.
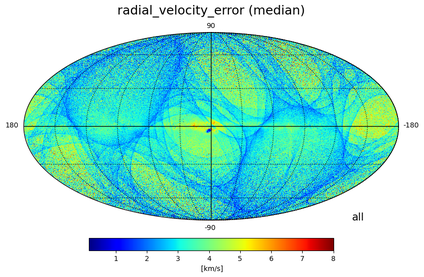
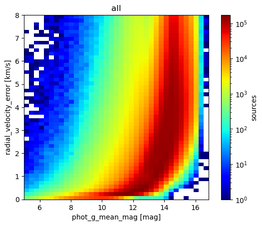
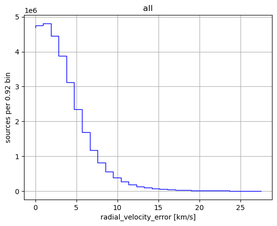
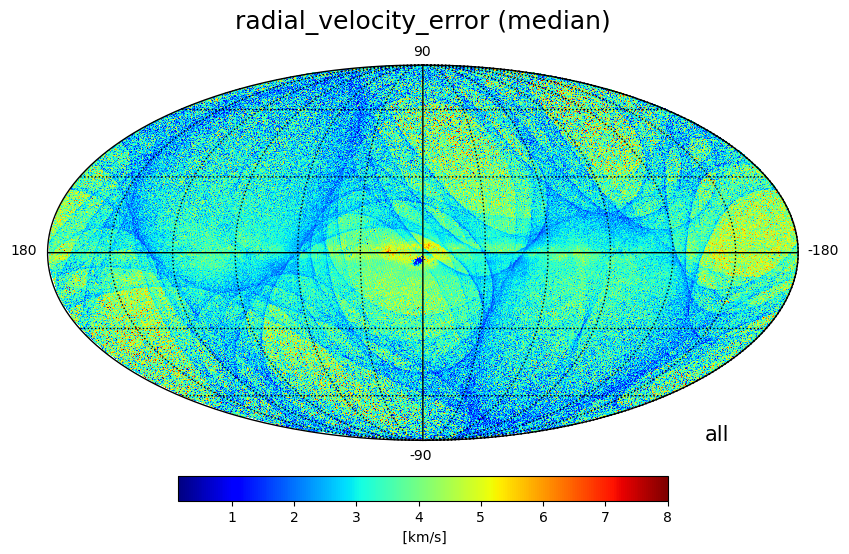
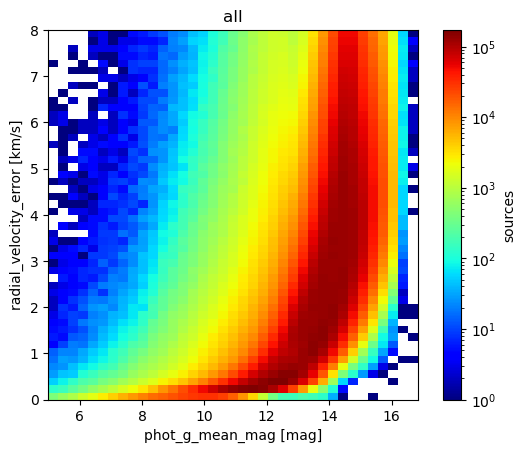
Figure 17.38:
HEALPix map of the median
V
rad
error (
radial_velocity_error
)
(large image)
, 2D histogram as a function of
G
magnitude
(large image)
, using bins of 0.32 mag for
G
and 0.16
km
s
-
1
for
V
rad
error, and histogram of error in
V
rad
(large image)
.
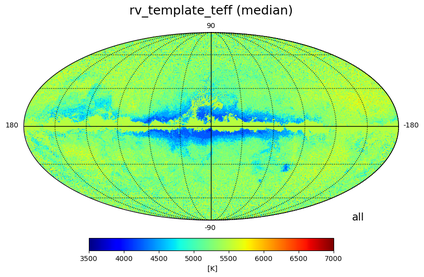
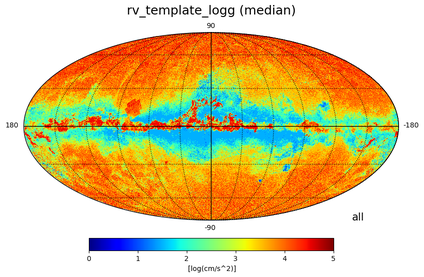
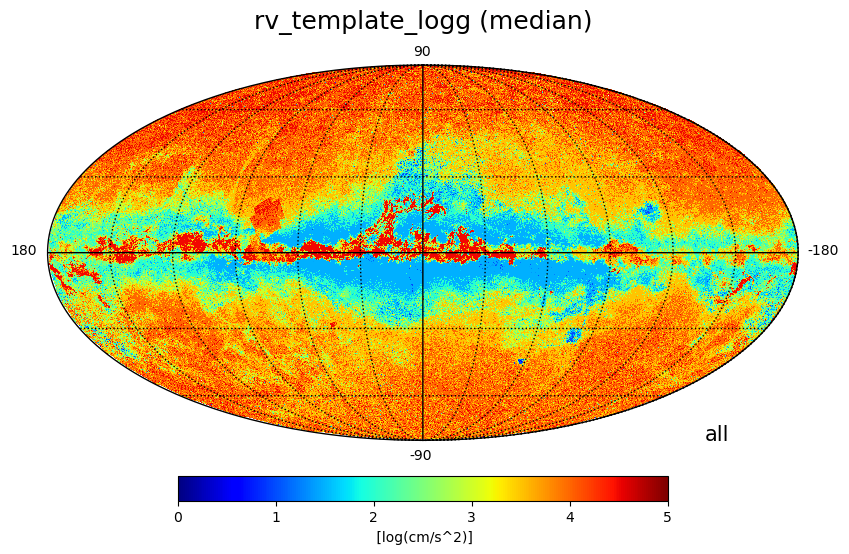
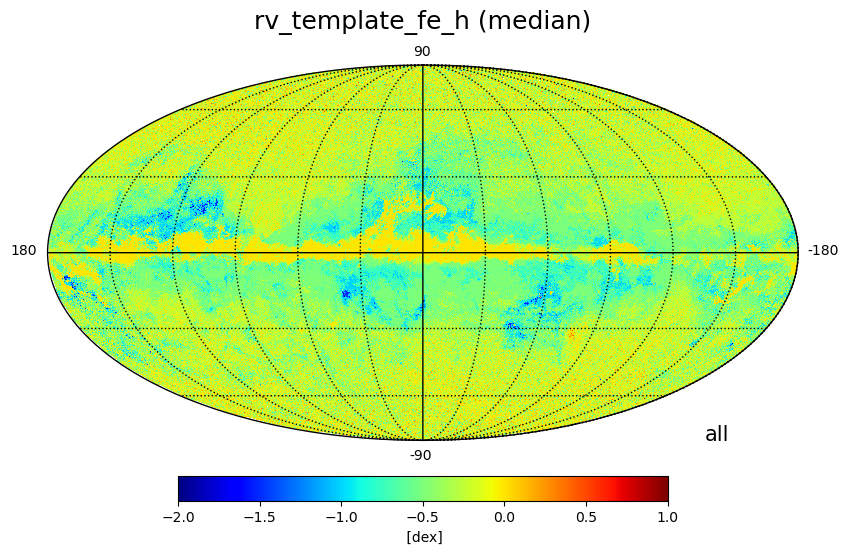
Figure 17.39:
HEALPix map of median
T
eff
(large image)
, median
log
g
(large image)
and median
[
Fe
/
H
]
(large image)
from the RVS templates.
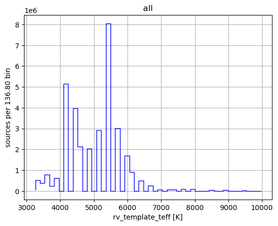
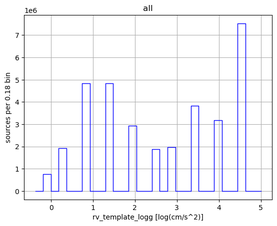
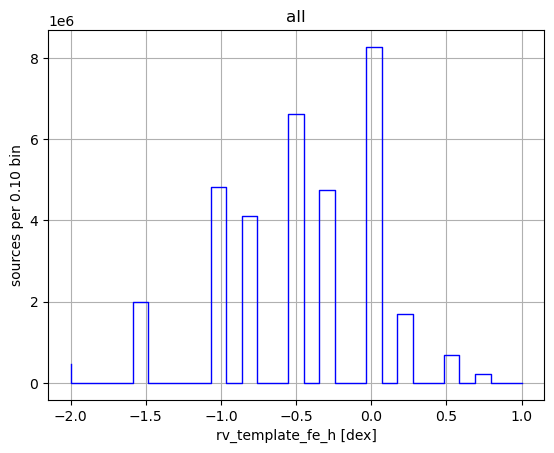
Figure 17.40:
Histogram of
T
eff
(large image)
,
log
g
(large image)
and
[
Fe
/
H
]
(large image)
from the RVS templates.


