17.2.6 Astrometric correlations


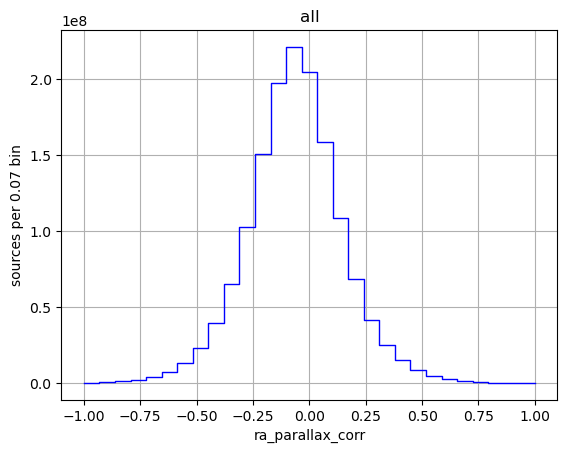
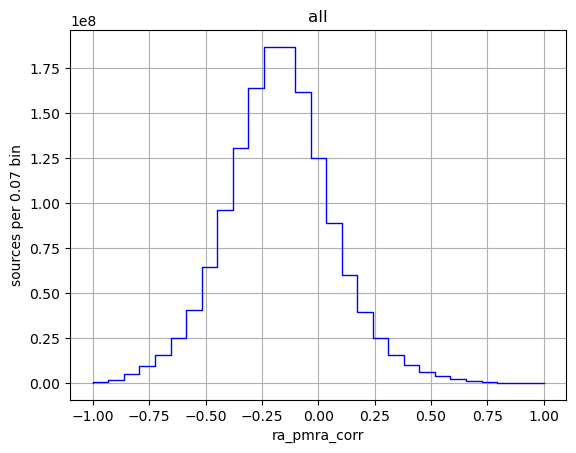
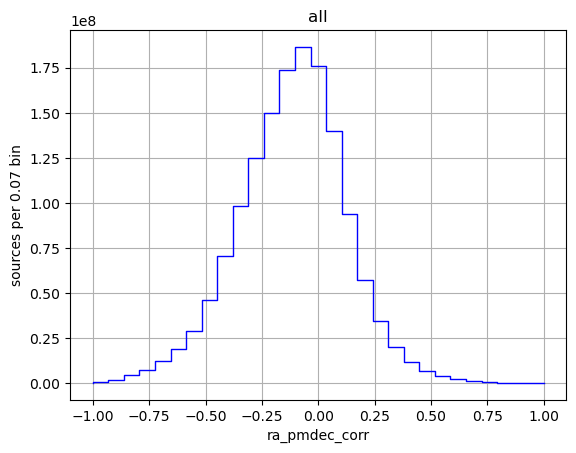
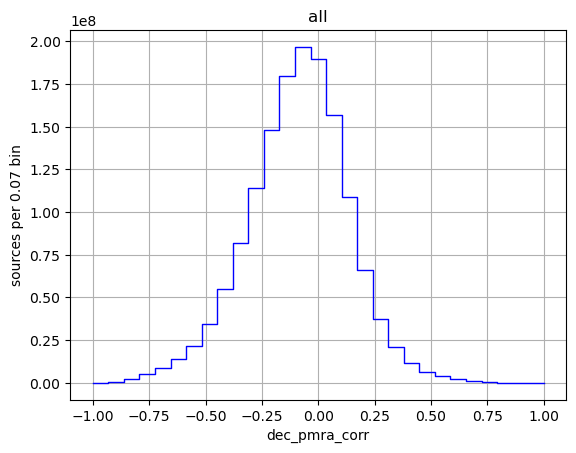
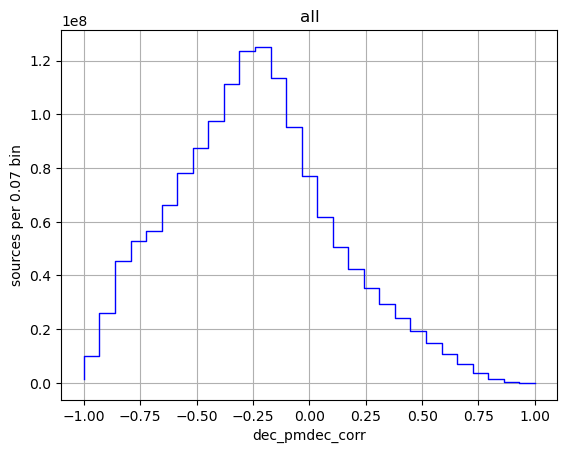
Figure 17.22:
Histogram of correlation between and (large image),
between and (large image),
between and (large image),
and between and (large image).


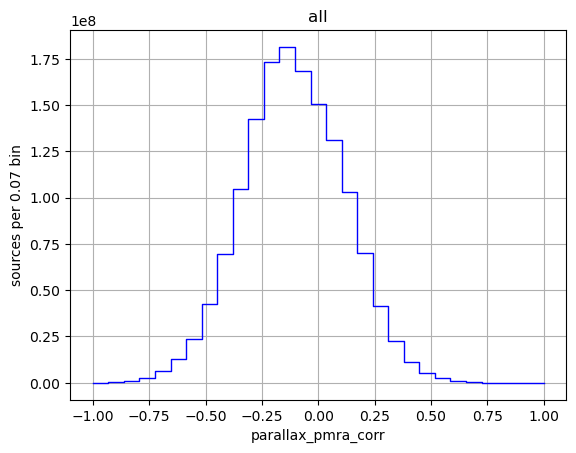
Figure 17.23:
Histogram of correlation between and (large image),
between and (large image),
and between and (large image).


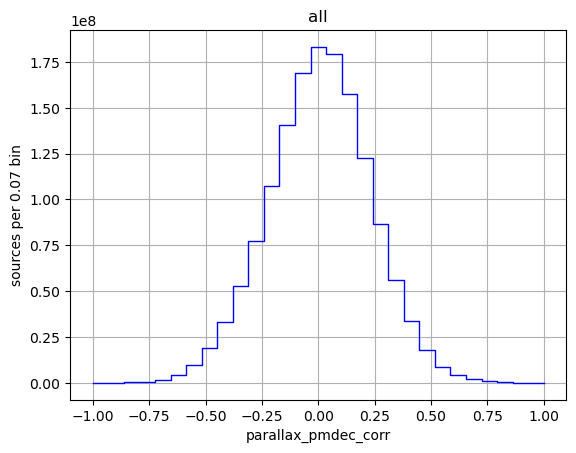
Figure 17.24: Histogram of correlation between and (large image),
between and (large image),
and between and (large image).


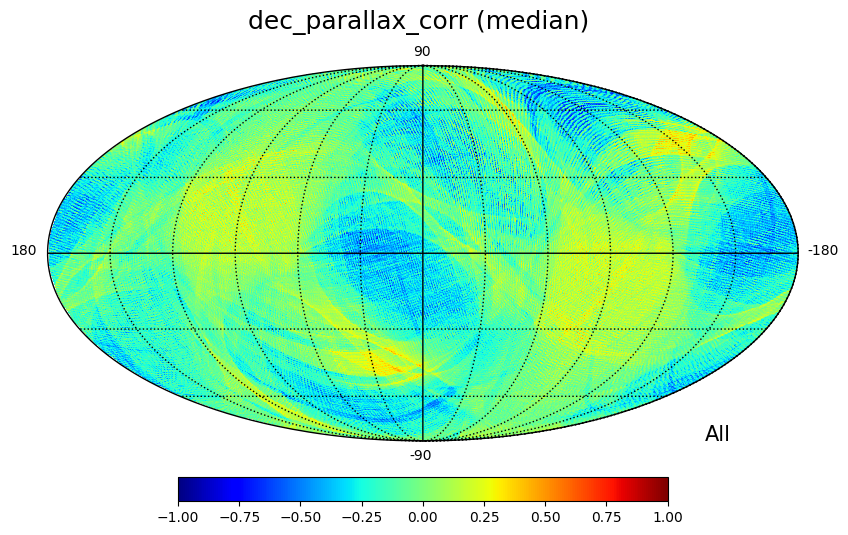
Figure 17.25:
HEALPix maps of the median of correlation between and (large image),
between and (large image),
between and (large image),
and between and (large image).


Figure 17.26:
HEALPix maps of the median of correlation between and (large image),
between and (large image),
and between and (large image).


Figure 17.27: HEALPix maps of the median of correlation between and (large image),
between and (large image),
and between and (large image).