6.4.3 Scatter Calibration
Scatter is the pipeline in charge of calibrating the background (dominated by the straylight) to subtract from each spectrum. It works per transit and per trending epoch. The object containing the background information is called ScatterMap, and it is used in the Calibration and FullExtraction pipelines. The functionality to produce the ScatterMaps was not integrated in the DR2 pipeline, where a single ScatterMap per CCD, was produced off-line, and used to treat all the data. The functionality to produce the ScatterMaps implemented in the DR3 pipeline is similar to the one already implemented off-line: first the Scatter objects are produced (carrying the background measurement), then the Scatters are combined to form a ScatterMap (see Sartoretti et al. 2018, Section 5.2); the major difference is that, in the DR3 pipeline, the Scatter objects are calculated using also the faint-star (on-board ) spectrum borders, in addition to the virtual objects (VOs; Section 1.1.3).
The pipeline includes two major tasks:
-
•
Create the Scatter objects:
-
–
SpectroObservation and SpectroObservationVo are selected in order to have non-truncated windows of size AC=10. Only the SpectroObservations of the faint stars with on-board magnitude 15 are kept. The data are reformatted into the objects used by the downstream steps of the pipeline. The transits of potential contaminants are identified.
-
–
Bias and bias non-uniformity is removed using appropriate calibration coefficients (see Section 6.3.1).
-
–
The fixed CCD gain that was measured on ground, is applied.
-
–
The dark current that was measured on ground, is subtracted (see Section 6.3.2).
-
–
The spectra presenting a saturated sample, a cosmic ray, a CCD defect (see Section 6.3.2), or having a nearby contaminant, are discarded, in order to remove other signal contamination from the background measurements.
-
–
The background flux level is calculated as the median flux of all valid samples in the VO spectra and in the borders of the Faint Star spectra.
-
–
-
•
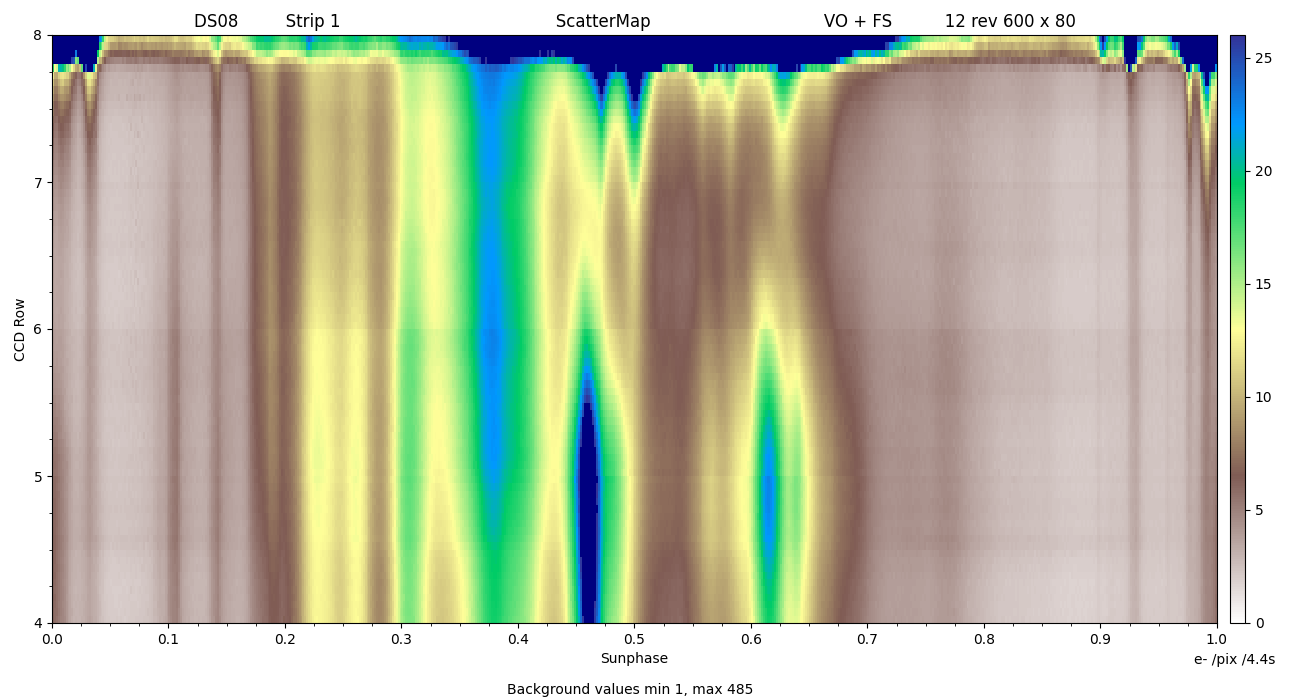
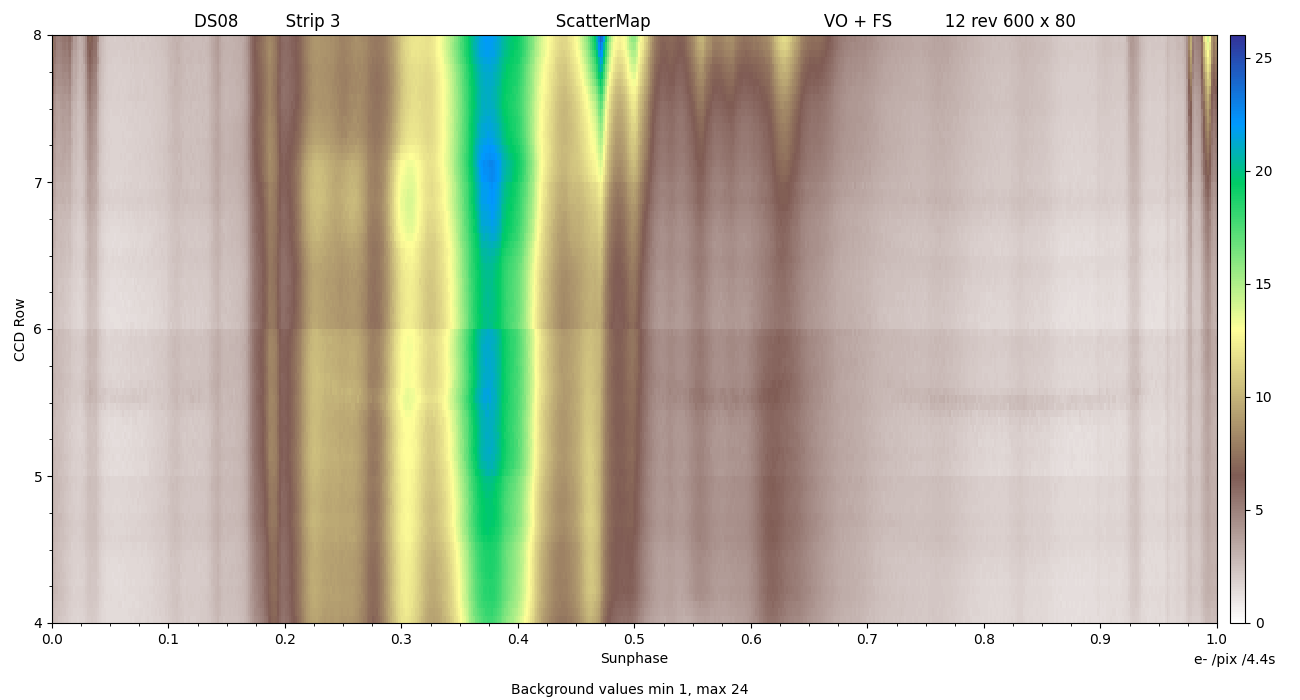
Create the ScatterMaps: The accumulated Scatter data are combined, based on their position and observation time, to create one 2D map. A map covers one revolution time on the X axis and all CCD AC positions on the Y axis. One ScatterMap is produced every 30 hours (5 revolutions) using 72 hours (12 revolutions). In fact, in addition to the transits falling in the 5 revolutions corresponding to the Calibration Unit (CaU) size, also the data falling in a border of 3.5 revolution at each side are used (overlapping with the data of the adjacent CaUs). The size of the ScatterMap cells has been fixed in order to have 600 (AL) x 80 (AC) cells. An example of ScatterMap is shown in Figure 6.5.