10.14.4 Quality assessment and validation
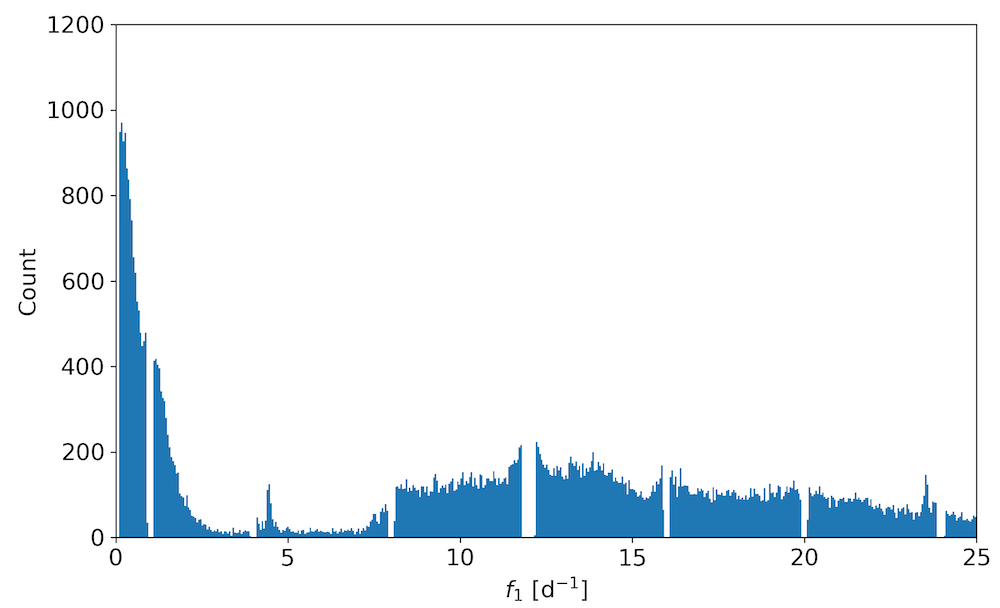
For the verification and validation we refer to the performance verification paper (Gaia Collaboration et al. 2023d) accompanying Gaia DR3. In Figure 10.35, we show the distribution of the frequency after applying the filters described in the previous subsection. The gaps are a direct consequence of the removal of all sources in unreliable frequency intervals (listed in item 2 of Section 10.14.3). Although small spurious features can still be seen (e.g., around 4.5 and 23.5 d), they clearly do not dominate the distribution.
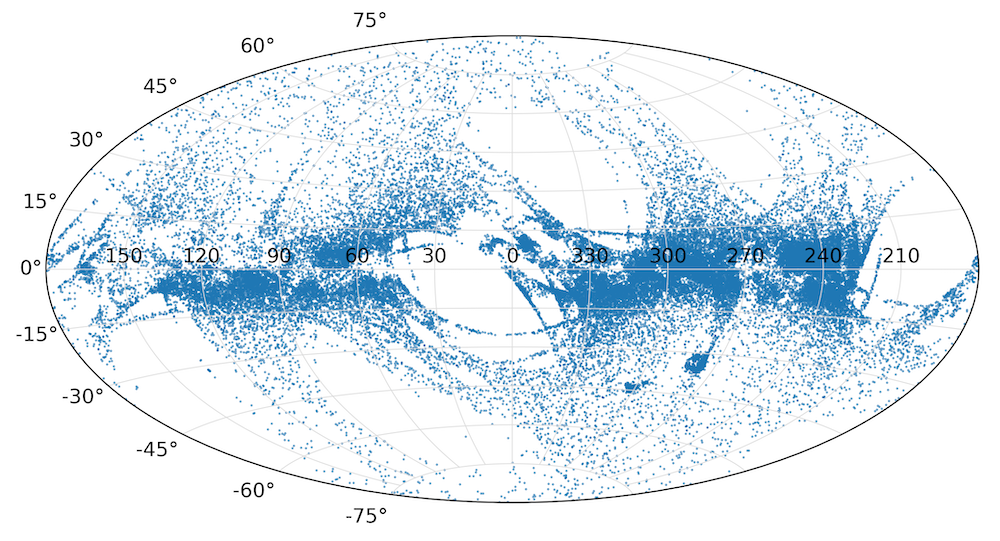
In Figure 10.36, we plot the distribution in the sky of the candidates in the catalogue using an Aitoff projection in Galactic coordinates. As expected, most of the sources are near the Galactic plane and in the Magellanic clouds. The large gaps are a direct consequence of limiting the sample to sources with at least 40 FoV transits in their -band time series.
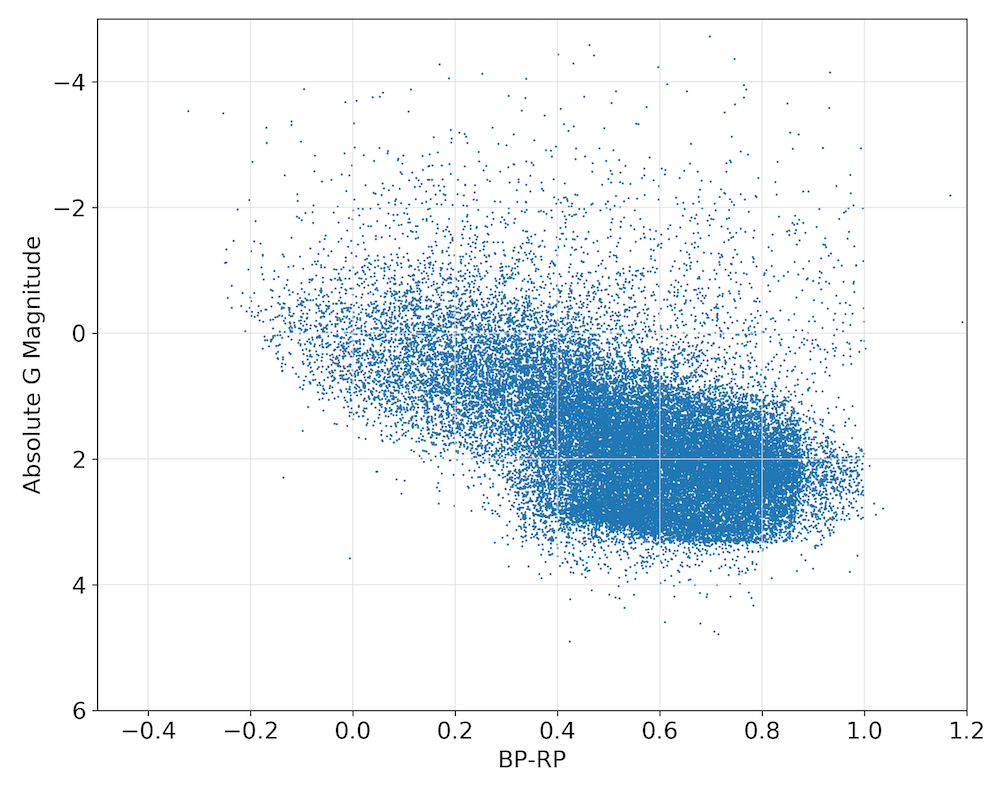
For sources with reliable parallaxes (/ ), we estimate their absolute magnitudes as and plot them in an observational Hertzsprung–Russell (HR) diagram with the colour as abscissa, in Figure 10.37. No filtering was done based on the position in the HR diagram, as explained in the previous section. The classifiers therefore succeeded in identifying the Scuti and the B-star instability strips in the HR diagram. Part of the scatter is caused by the fact that interstellar extinction is not accounted for.