8.4.5 Validation of Spectrophotometry
Author(s): Laurent Galluccio, Marco Delbó, Paolo Tanga, Alberto Cellino
In Section 8.3.7, it is described how the 16-band mean reflectance spectra were produced for 111 818 SSOs. However, visual inspection of some (thousands) of these spectra clearly showed that the SSOs of different magnitude classes display spectra of different quality, with the lowest quality, obviously, being associated with those SSOs that were observed at the faintest magnitudes. The average signal-to-noise ratio was considered as an initial parameter to assess the quality of the spectra:
| (8.39) |
Data at the wavelengths of 374, 418, 990, and 1034 nm were omitted from the computation, as they were often affected by large random and systematic errors (see below).
The histogram of the distribution of the value amongst the 111 818 SSOs shows a quasi-lognornal distribution (Figure 8.59) with a clear peak at = 13. The same figure also shows that reflectance spectra with values smaller than the peak value (13) are essentially due to the SSOs observed with magnitudes between 19 and 20 and due to those fainter than magnitude 20.
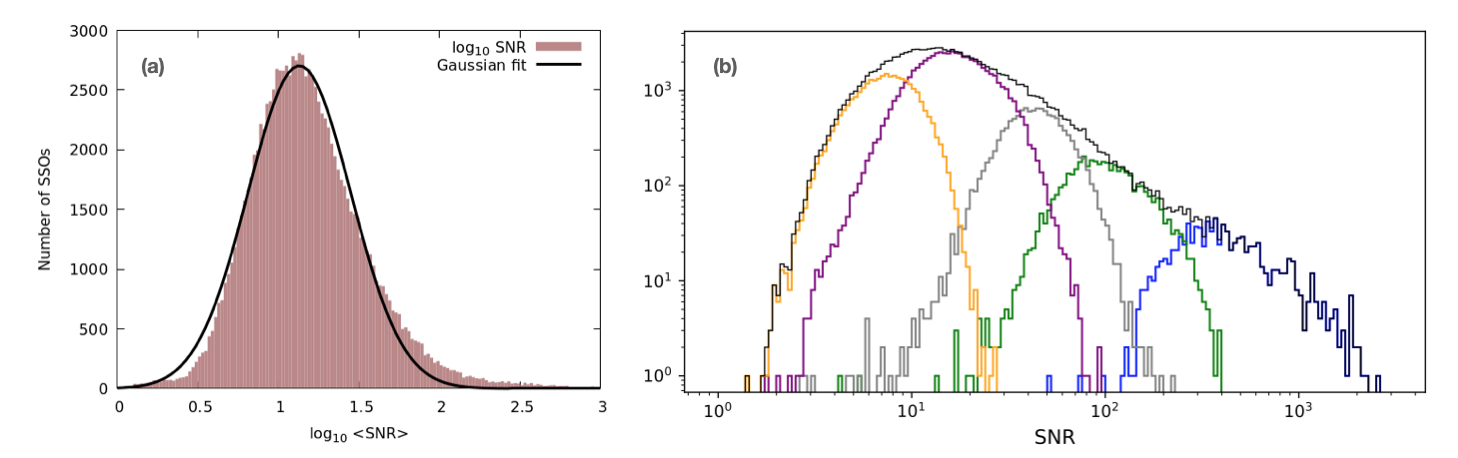
Visual inspection of randomly selected spectra with 13 and with 13 shows that the latter class is usually characterized by noisy spectra and the former by more accurate ones. The publication of spectra was limited to 13 in Gaia DR3. The remaining spectra are waiting to be published in Gaia DR4 based on 66 months of Gaia observations (to be compared to the 34 months of Gaia DR3 observations). More transits will thus be averaged for Gaia DR4. By applying the condition 13, a total of 60 522 SSOs receive valid 16-band reflectance spectra.
However, the condition of having 13 does not necessarily guarantee that the reflectance spectrum of a single SSO would be scientifically exploitable, whereas it could still be important for population studies. Therefore, it was decided not to reject additional reflectance spectra but to flag them on a wavelength-by-wavelength basis. Namely, an array of 16 integers, one for each wavelength of the spectral bands was created with the name of reflectance_spectrum_flag, hereafter indicated with RSF. A value equal to 0, 1, or 2 was assigned depending on whether the data at that band were validated, suspected of being poorer quality, or deemed compromised, respectively. A user of Gaia data can thus assess how many bands were not validated by counting the non-zero elements of the array. In addition, the positions of the values equal to 1 or 2 within the array indicates which bands were not validated and why.
The procedure to assign values to the RSF array consists of three steps:
-
1.
All the elements of the RSF array are set to zero.
-
2.
The values of the mean reflectances and their uncertainties are explored for unreliable or non-numerical values, namely:
-
–
The value of the RSF is set to 2 if the corresponding mean reflectance or its uncertainty are not numbers (NaN).
-
–
The value of the RSF is set to 2 if the corresponding mean reflectance is larger than 2.5 or smaller than 0.2.
-
–
The value of the RSF is set to 2 if the corresponding uncertainty of the mean reflectance is larger than 0.5.
-
–
-
3.
The values of the mean reflectances and their uncertainties are explored in order to identify large discrepancies from an average continuous curve that would fit the discrete data, namely:
-
–
A smoothing natural spline is fitted to the data points for which the corresponding RSF values are still zero after the previous step (see below for a description of how the spline was defined and implemented).
-
–
The values of the RSF array are set to 1 or 2 at those wavelengths, where the mean reflectance has a distance from the smoothing spline larger than twice or three times the corresponding uncertainty: if then RSF = 1; if then RSF = 2.
-
–
A value of spectral reflectance slope is calculated by fitting a straight line to those data with RSF = 0 and 450 nm 750 nm using weights equal to the inverse of the uncertainty squared. A smoothing natural spline is fitted to the data points for which their corresponding RSF is still zero after the previous step and the value where = 893.2 nm and = 748.0 nm is calculated.
-
–
Only asteroids with -10 % / 100 nm 40 % / 100 nm and are validated. These latter conditions reject only four asteroids with anomalously blue reflectance spectra, which we attribute to a flux loss of RP compared to BP.
We use the cubic spline approximation (smoothing) CSAPS Python3 module to implement the smoothing spline with a smoothing coefficient equal to . The latter was derived with a trial-and-error method and allows to reproduce the spectra of V-type asteroids within error bars (cf., Figure 8.60).
-
–
 |
 |