12.3.2 Sky distribution of source counts
Figure 12.5 and Figure 12.6 illustrate the sky distribution of the number of sources per HEALPix level 6 for the samples defined in the previous section, for the qso_candidates and galaxy_candidates tables respectively. These are shown for HEALPix level 6 in galactic sky coordinates.
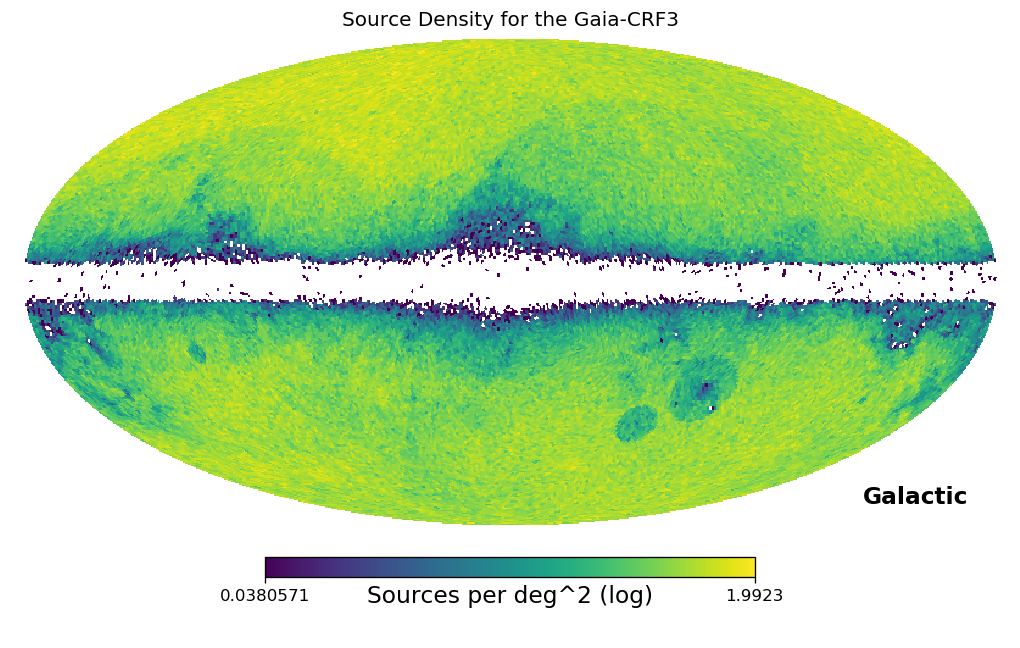
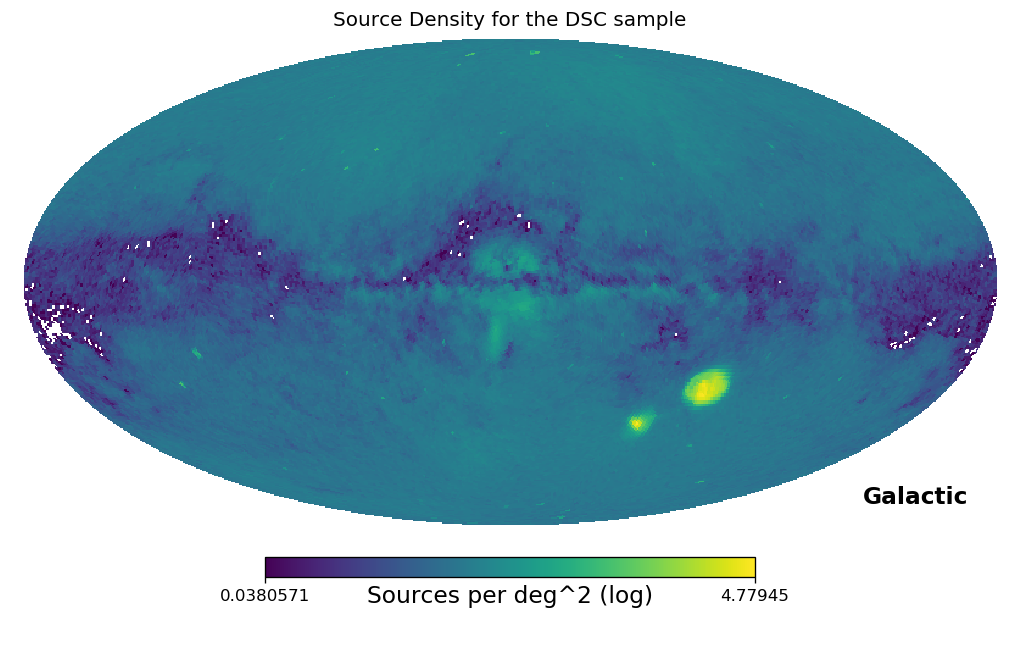
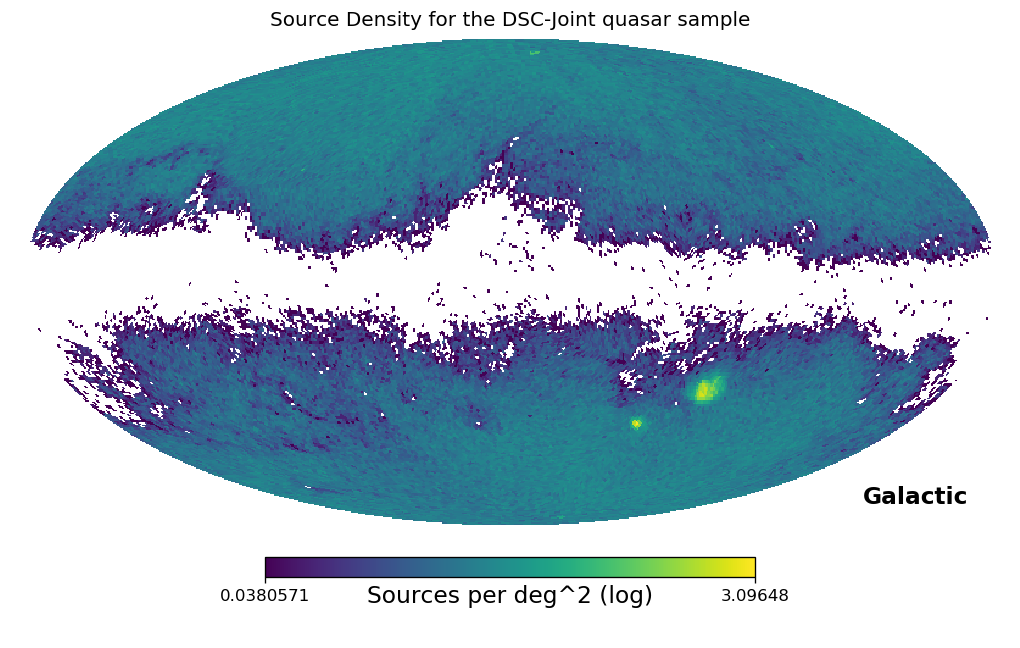
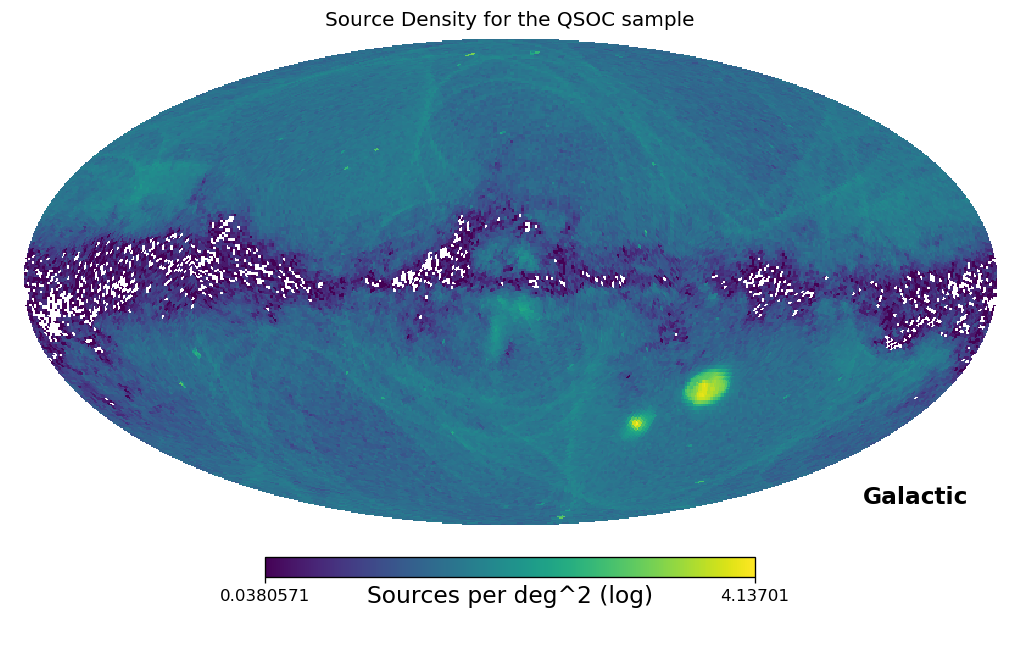
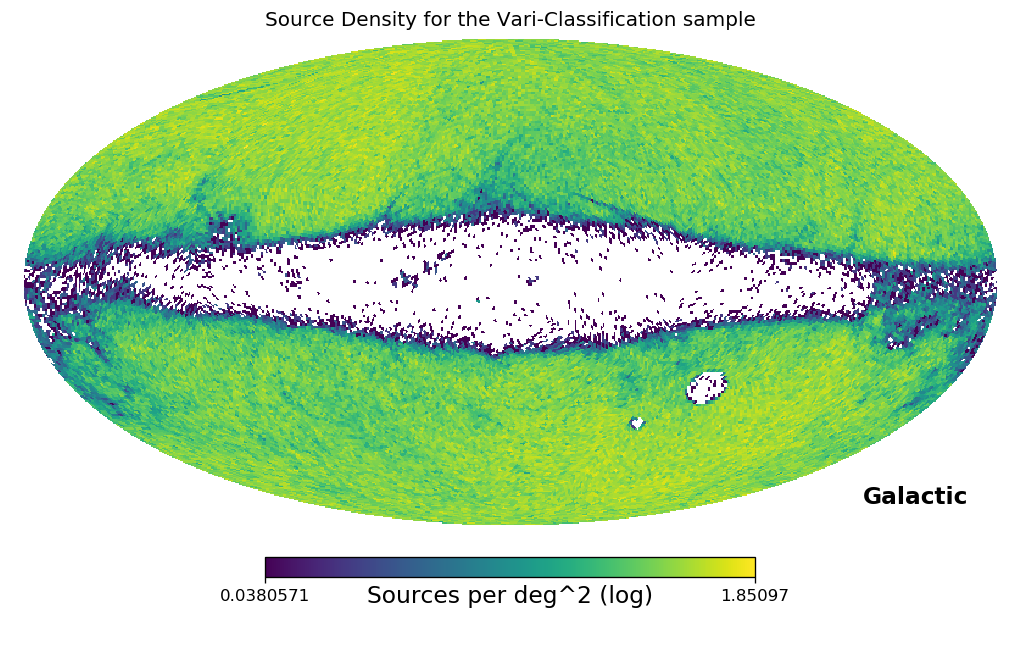
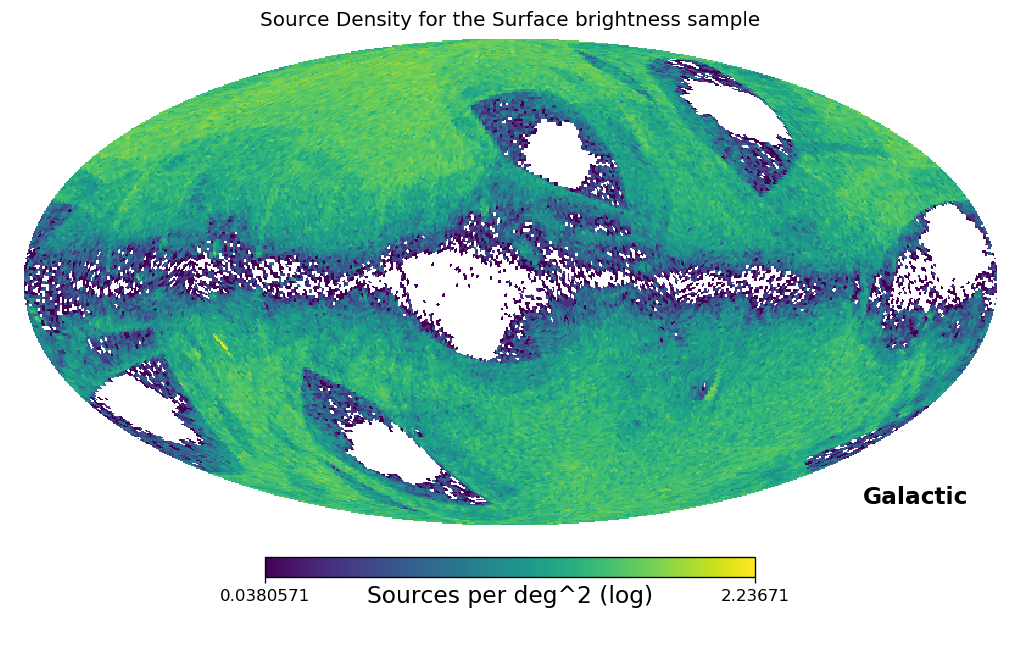
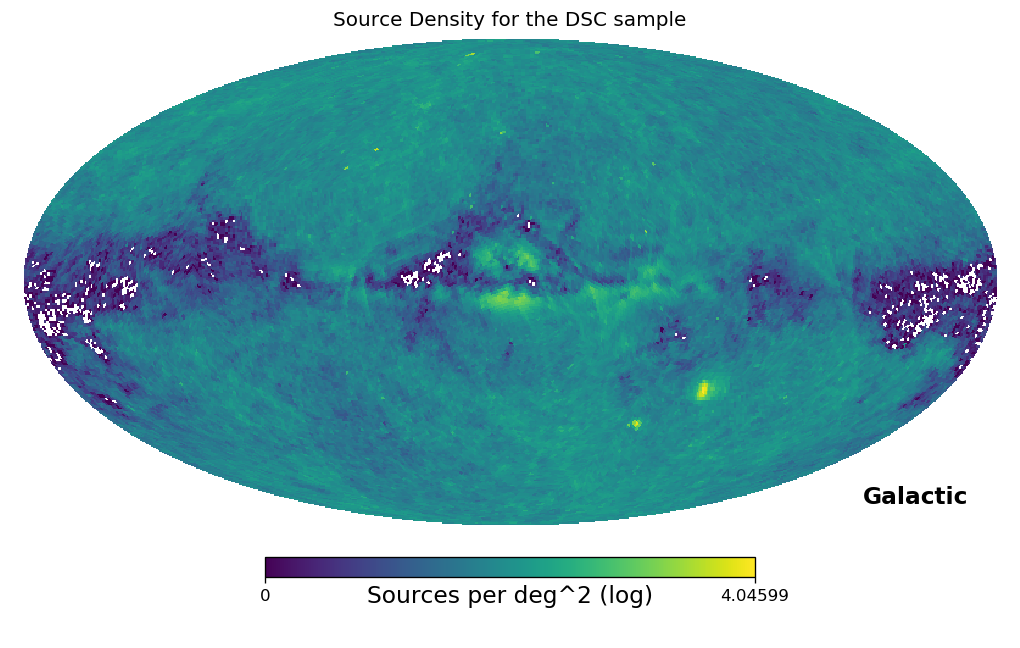
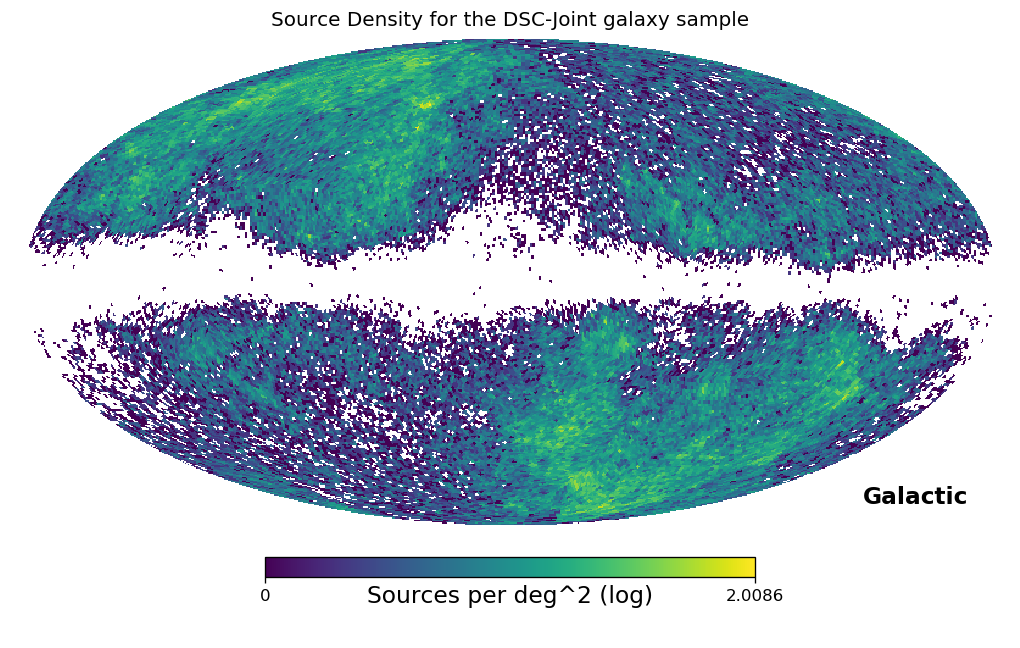
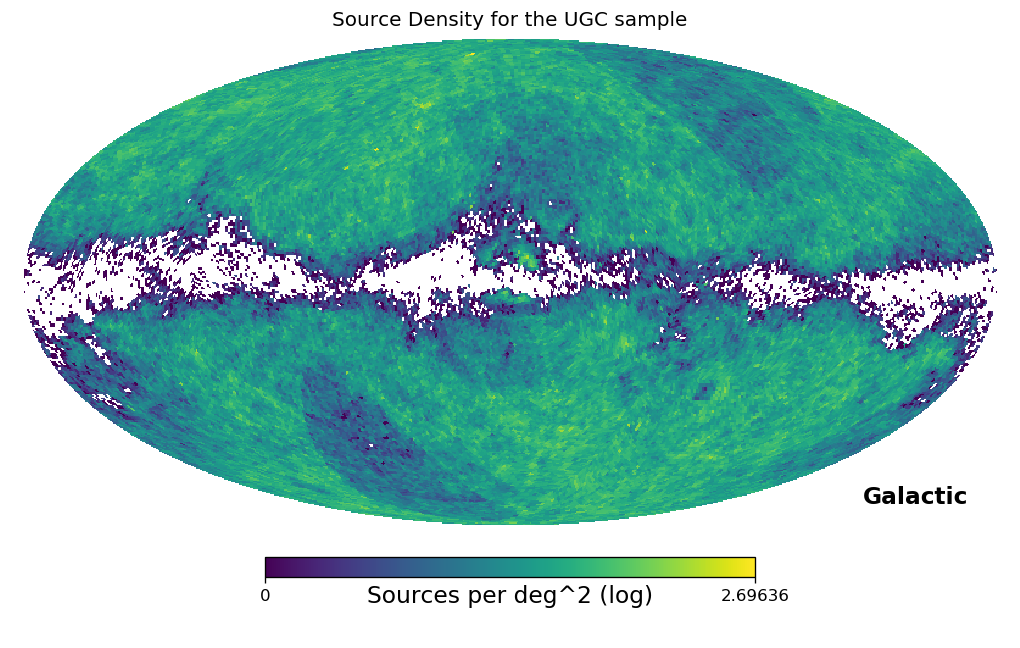
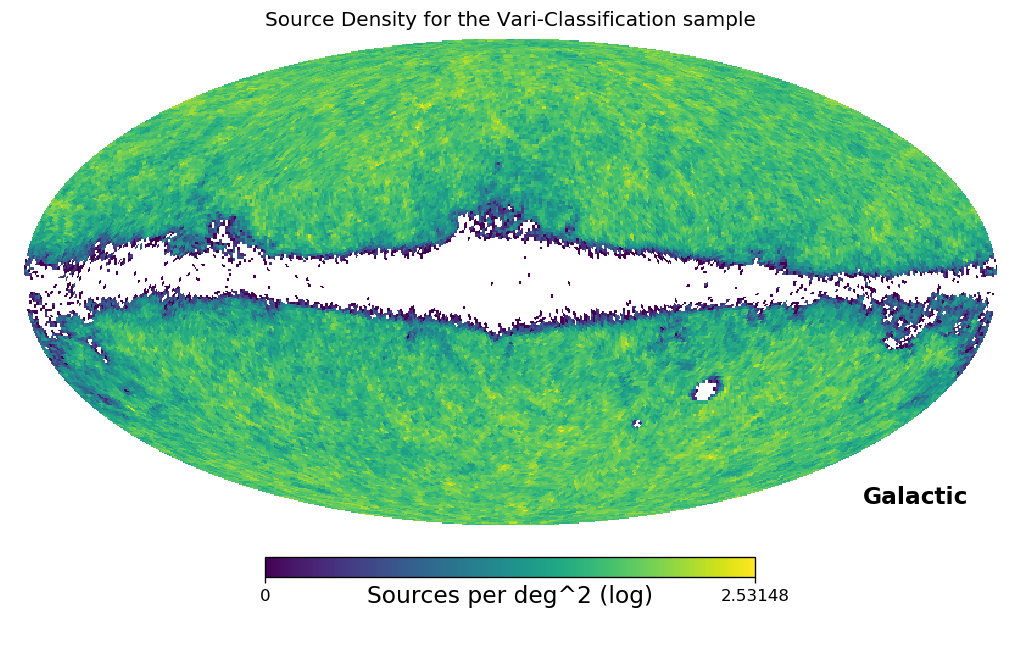
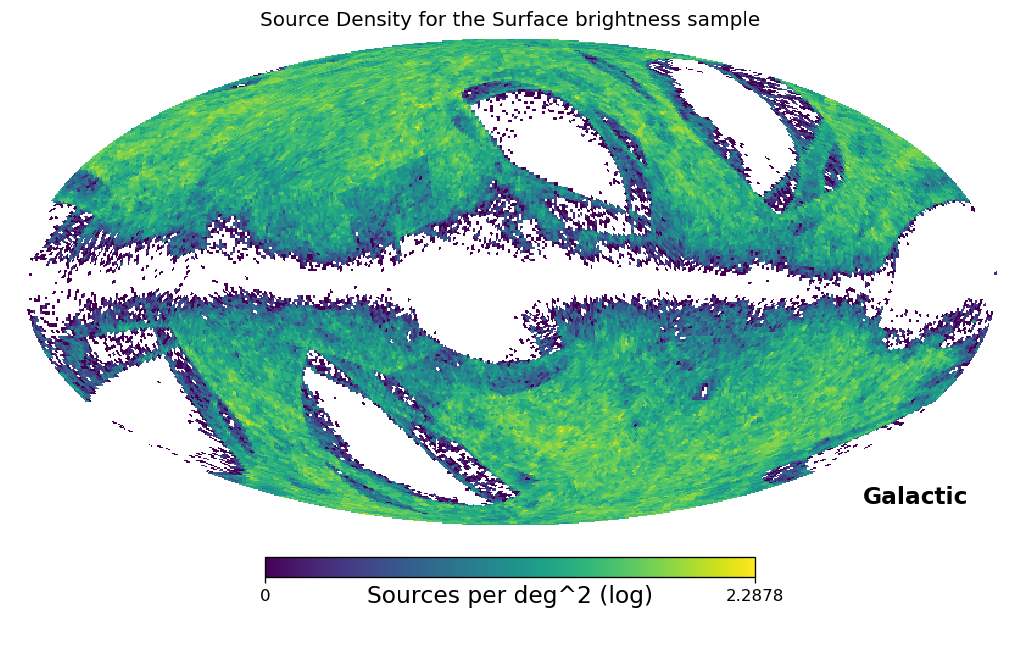
Both the DSC and QSOC samples show significant contribution of sources at low galactic latitudes, as well as over-densities in the area of the LMC and SMC. These are interpreted as stellar contamination of the sample, which is largely removed when considering the DSC samples optimised for class purity. The over-density in the LMC and SMC areas remains also for the purer DSC quasar sample, albeit at a lower level. This is not surprising as over-density of false positives (as well as true positives) will always show in denser sky region, i.e. there are more sources of any classification. Conversely, the UGC sample does not show noticeable over-densities in the LMC and SMC areas, although it still contributes a small amount of sources at lower galactic latitudes. Conversely, the samples stemming from Vari-Classification avoid these areas noticeably, which is due to specific selection rules applied in the final filtering applied to the consolidation process leading to this particular product. For the specific ‘AGN’ sub-set, it is interesting to still note the presence of some sources at low galactic latitudes at the anti-centre. These are shown to have lower values of vari_agn_membership_score, indicative of lower quality classification. See Section 10.3 for further details. Finally, the samples associated with the surface brightness analysis show additional holes in specific sky regions. They arise from the Gaia scanning law, that leads to certain sky area with less observations and poorer angular coverage – see also Section 9.2.