12.3.3 Source attribute distribution
magnitude
Figure 12.7 and Figure 12.9 show the magnitude distribution of the sources from each of the modules contributing to the respective extragalactic tables.
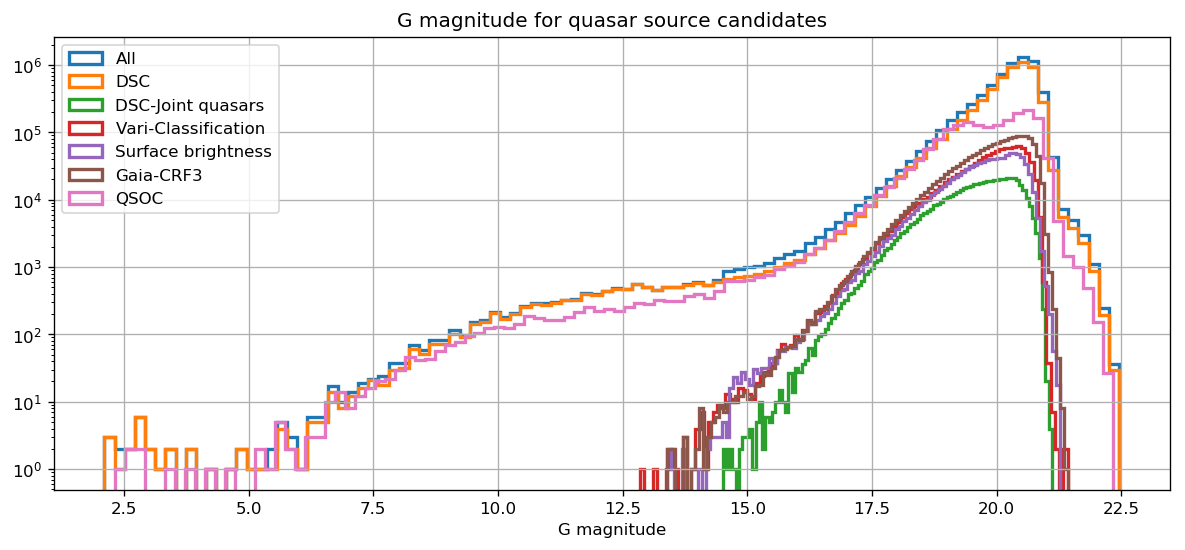
The magnitude distribution of sources in the qso_candidates table shows two main components. First, all modules but DSC and QSOC have their sources at magnitude fainter than 12.8 mag, and follow the typically log-like increase with magnitude, dropping after 20–21 mag. The DSC-Joint sample does not contain any source brighter than magnitude 14.5 because of a specific threshold applied in one of the classifier used to define this class (‘Allosmod’). Then, the DSC and QSOC sources distribution in the magnitude range 13–21 is similar to those of the other modules, augmented by a population of brighter sources all the way from 15 mag down to 2 mag, as well as a fainter population extending up to 22.5 mag. Both extra populations are most likely composed of stars, and are simply a consequence of the lack of hard cuts and filters compared to other classifiers, which results in a more complete but less pure sample. As explained in Section 12.2.1, a purer subset of the DSC sample is available through the DSC-Joint class.
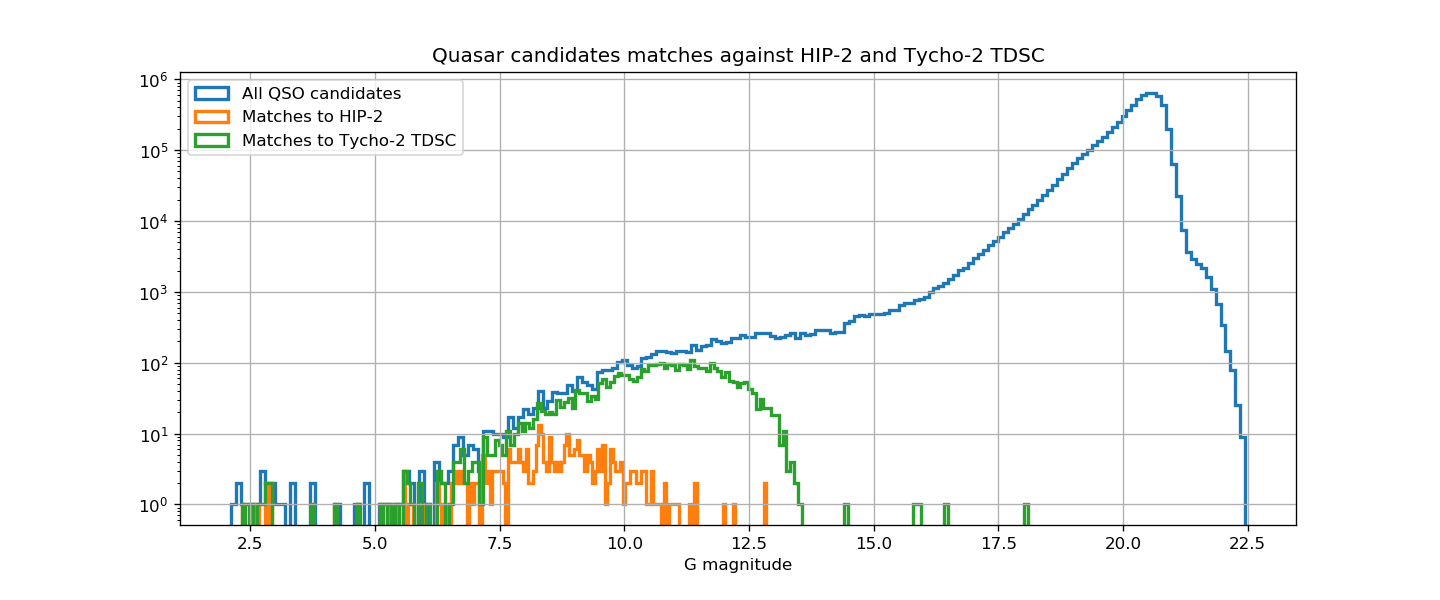
At the bright end, it is possible to check how many of the sources have a counterpart on the Gaia DR3 cross-match tables created against catalogues such as Hipparcos-2 or Tycho-2 TDSC (Chapter 15). This is illustrated in Figure 12.8. Most sources brighter than 11 mag can be matched to one source in Tycho-2, while all sources brighter than 7 mag can be matched to one source in Hipparcos, the bulk of which being reported as double by this catalogue or happen to only have a 2-parameter solution in Gaia DR3.
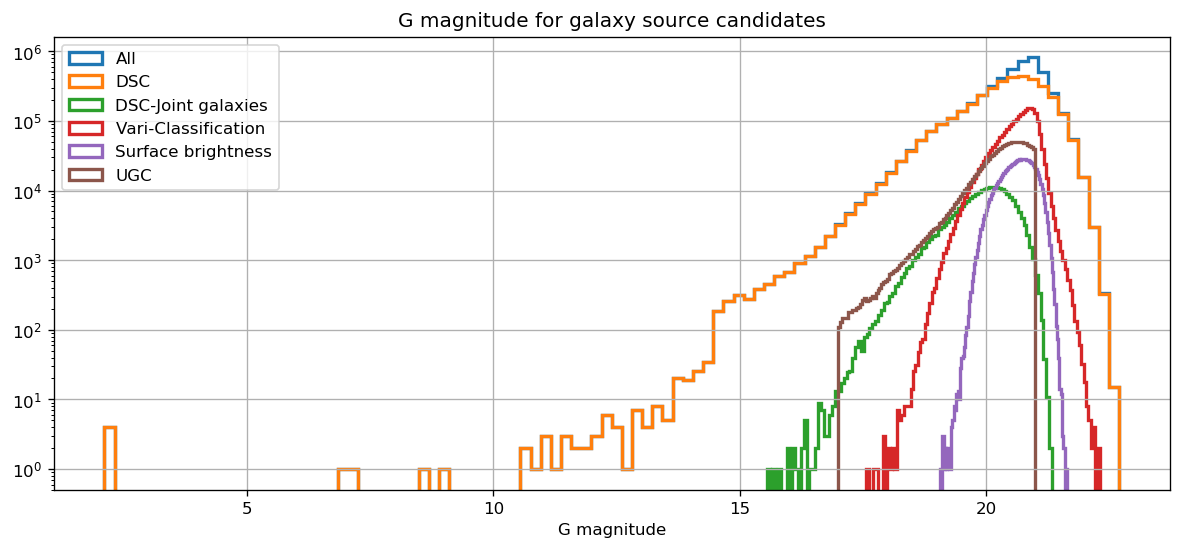
For sources in the galaxy_candidates table, a similar distinction exists between sources from DSC, and those from the other modules. For the latter, the magnitudes range from 16 mag to 22 mag and follow a typical log-like increase with magnitude, albeit with noticeably different magnitude coverage between modules. DSC-Joint corresponds to the ‘brightest’ range (15.6 to 21.3 mag), followed by the Vari-Classification (17.6 to 22.3 mag) and finally the Surface brightness sample (19 to 21.6 mag). For UGC, the straight cuts at 17 and 21 mag respectively are due to the training set used for the redshift determination (Delchambre et al. 2023). Complementary to this, and similar to the qso_candidates table, the completeness-driven DSC sample spans magnitude ranging from 22.7 mag, all the way down to 2.1 mag, and adds a significant fraction of sources at all magnitudes.
colour
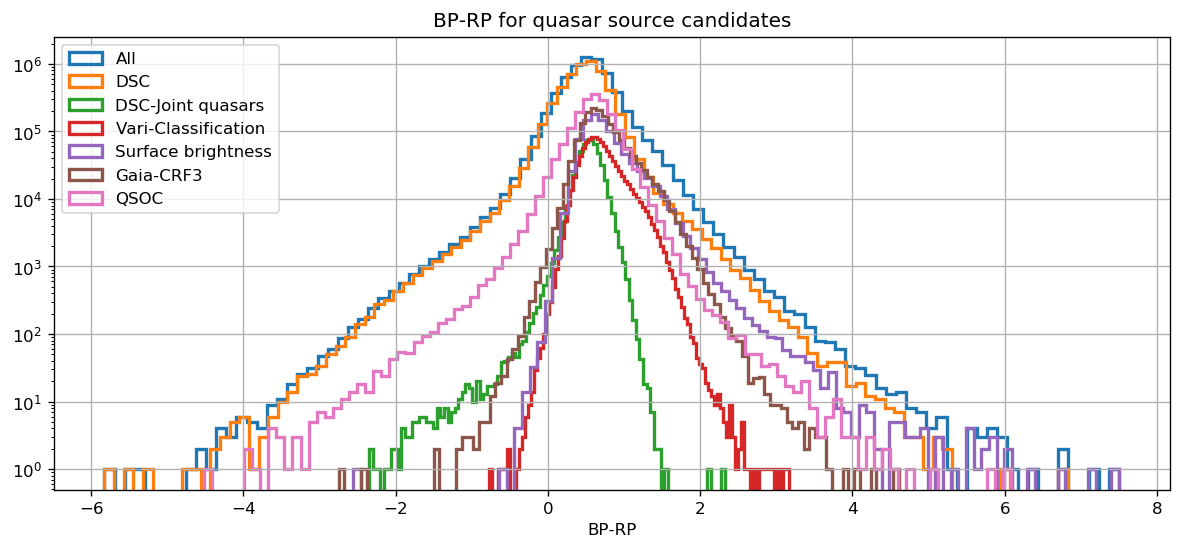
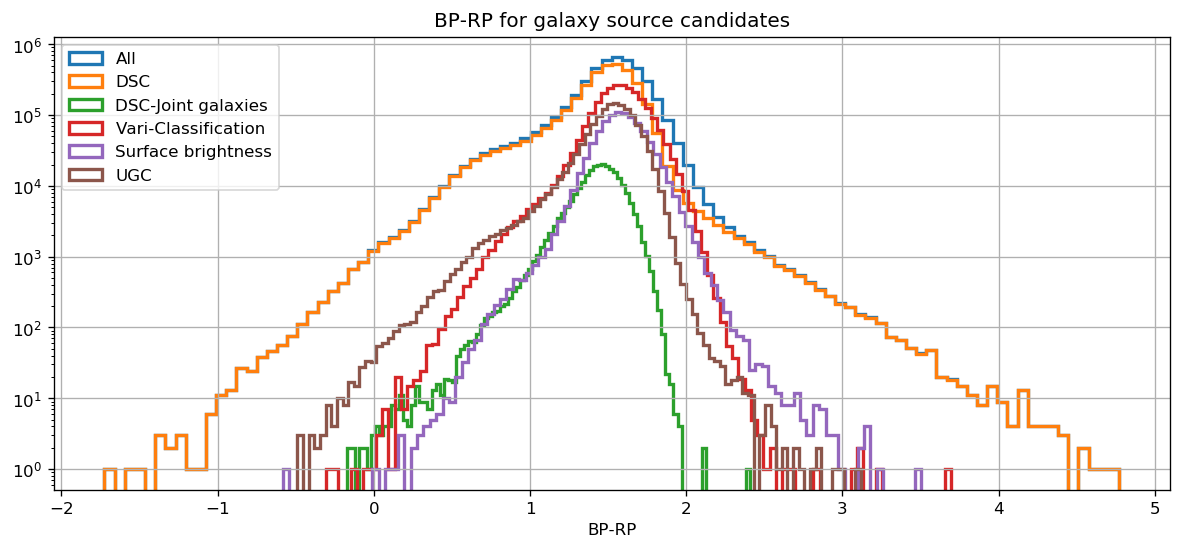
In the qso_candidates table, the DSC and QSOC samples span the largest colour range, indicative of the colour spread applicable to the significant stellar content of these subsets. Samples expected to be purer in terms of extragalactic content such as DSC-Joint, the Gaia-CRF3 or the Vari-Classification sample, show noticeably narrower and bluer colour distributions. Overall, all distributions peak around 0.5. A similar behaviour is observed in the galaxy_candidates table in all respects, this time with a distribution peaking around 1.5.
Re-calibrated flux excess factor
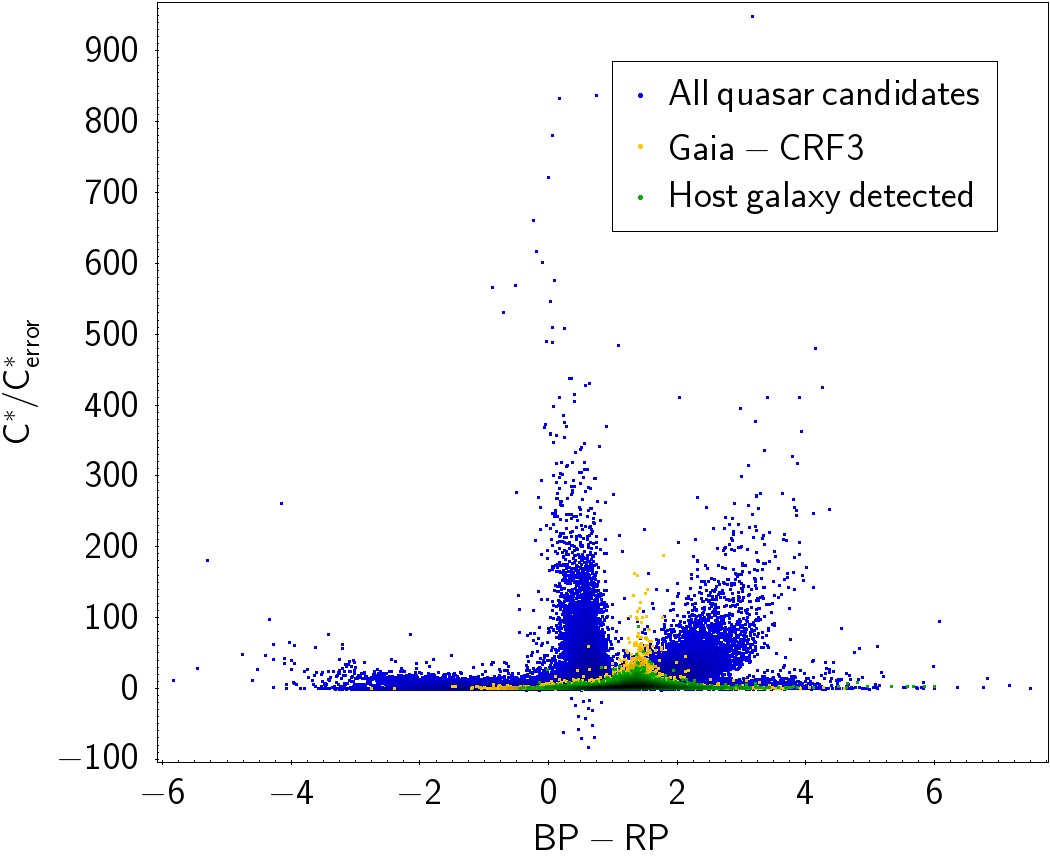
It is also interesting to consider the re-calibrated flux excess factor as introduced by Riello et al. (2021) as a measure of possible source extent, and check its behaviour depending on various attributes. In order to avoid any magnitude dependency of the uncertainty of this excess ratio, we use here its value normalised by its error, which we call , and plot it against the colour. Values of this ratio deviating noticeably from 0 are indicative of flux contamination from another object near the source, or of measurable source extent.
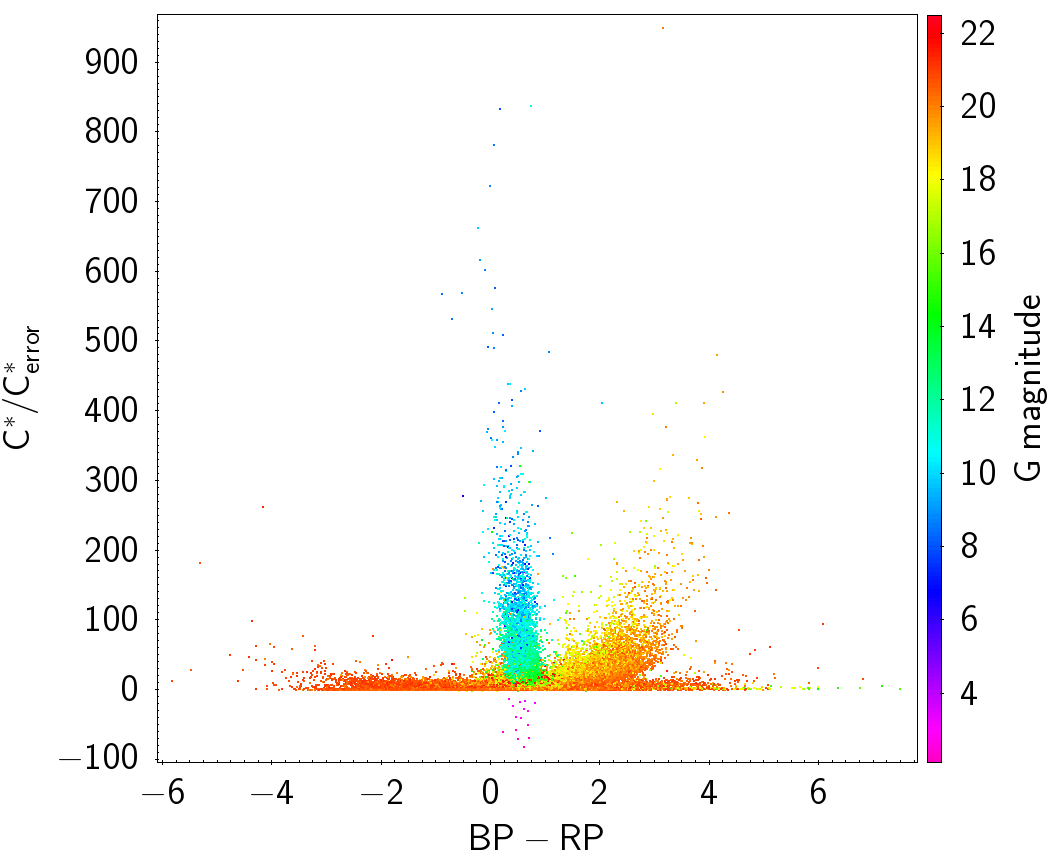
Figure 12.12 shows the distribution of the normalised flux excess factor against the colour for all sources in the qso_candidates table. The bulk of the sources exhibit small ratios distributed over the full colour range, but some vertical chimneys appear at certain colours. The left panel shows that the smallest of those chimneys at 1.5 coincides essentially with sources from the Gaia-CRF3, with a fraction of them reported as having a host galaxy detected by the surface brightness analysis. The right panel shows that the faintest sources are those with the smallest ratio, while the two largest chimneys tend to be composed of brighter sources. In particular, the one centred at 0.5 contains essentially all sources brighter than 13 mag (those brighter than 5 even exhibit negative value of the normalised excess factor), of which the majority are likely to be stellar.
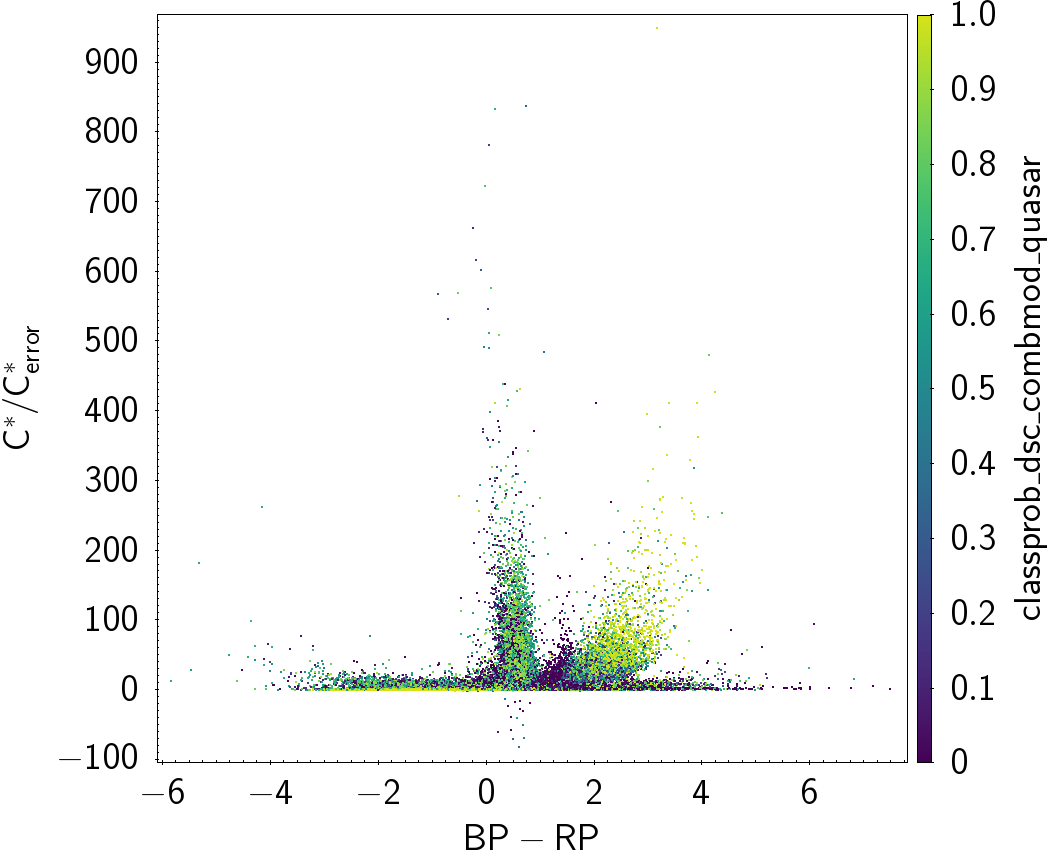
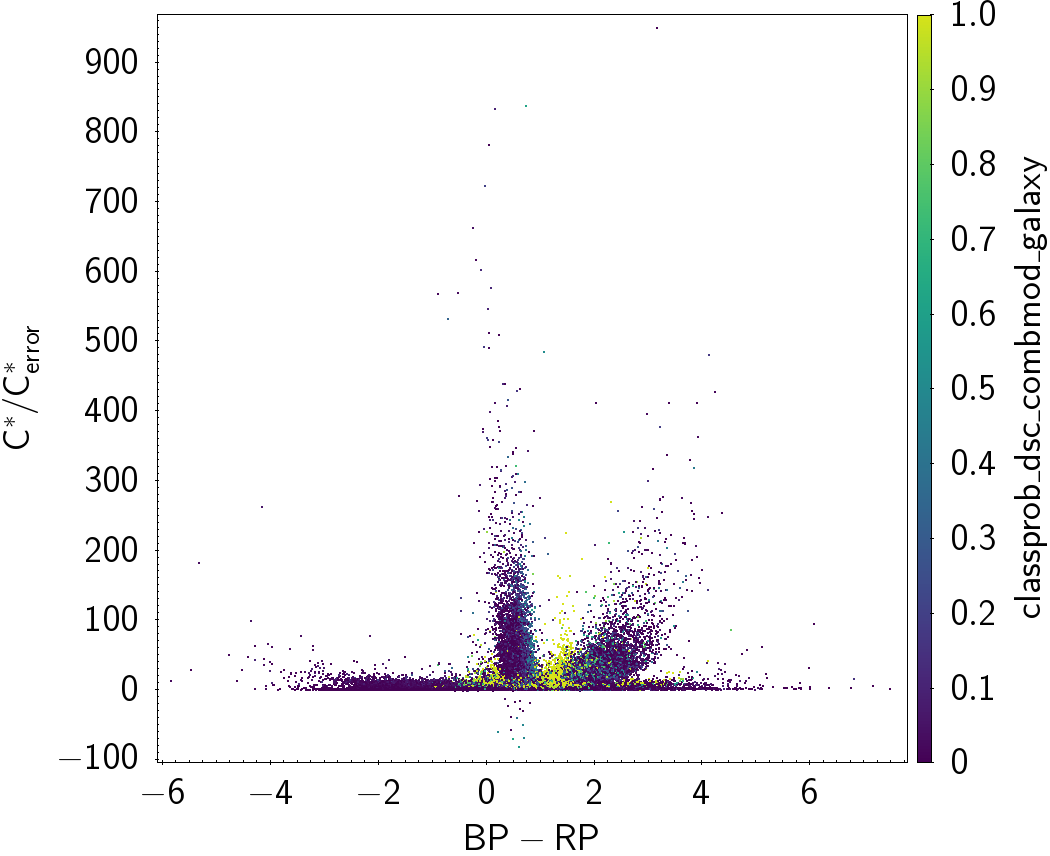
It is then interesting to further separate these sources following their DSC class probability. This is shown in Figure 12.13. The two largest chimney tend to have high probability to be a quasar, and a low probability to be a galaxy – in practice, a large fraction of those are believed to be genuine stars. Conversely, the small chimney containing the Gaia-CRF3 sources appears with high probabilities for the galaxy class.
The picture emerging from these plots is as follows:
-
•
The sources coinciding with the Gaia-CRF3 and detected host galaxies are interpreted as extended extragalactic sources, that DSC has classified as galaxy.
-
•
The sources coinciding with the largest chimneys are interpreted as stellar contamination made of stellar pairs, and/or stemming from dense area where the flux excess factor is higher. We propose that the brightest ones (bluest chimney at 0.5) correspond rather to binaries. This particularly applies to the brightest stars where the cross-match with Hipparcos (see above) confirms that many of them belong to double systems. On the other hand, the chimney hosting the faintest objects is mostly tracing dense areas, and it can be checked that they actually all lie at galactic latitudes below 10 degrees.
 |
 |
 |
 |