14.2.9 Extended objects
The main properties and caveats of the qso_candidates and galaxy_candidates tables, which contain lists of candidate extragalactic sources – as well as morphological measurements for some of them –, are described in Gaia Collaboration et al. (2023b) and Babusiaux et al. (2023), and here we simply provide further details on some of the points discussed.
Based on the contents of Section 5 of Babusiaux et al. (2023), we see that both qso_candidates (QSO) and galaxy_candidates (GAL) are tables of extragalactic candidates built from the results of several pipelines that are aimed for completeness. As such, it is important to note that the default purity of these samples is quite low. Instead, subsamples of these tables should be selected according to the scientific goal in mind, using the readily available boolean flags like, for instance, the vari_best_class_name which allows us to create a quite pure (and incomplete) sample of quasars. On the other hand, morphological parameters have been derived for those sources with the required amount of data available. These parameters are, in general, in good agreement with the values derived from dedicated surveys like the Dark Energy Survey (DES Tarsitano et al. 2018), despite the fact that the Gaia values present saturation in some quantities, as well as a larger spread and an over-estimation of the Sérsic index, which is most likely related to the smaller field of view of Gaia (i.e., the morphological parameters of Gaia are biased towards Galactic bulges, Gaia Collaboration et al. 2023b). Finally, these tables also contain estimates of the redshifts. In the case of the galaxies, these seem to be slightly over-estimated for the bright ( mag) galaxy candidates and also a peak can be observed at around 0.07 due to convergence issues. In the case of the quasars, we note that using the flags_qsoc to filter bad determinations helps reducing the number of outliers significantly.
 |
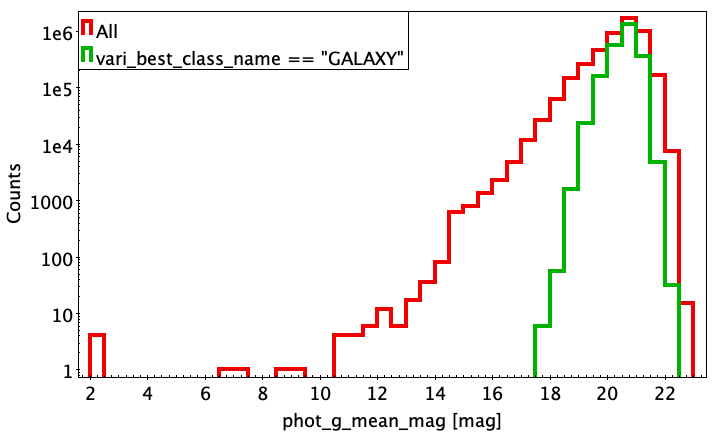 |
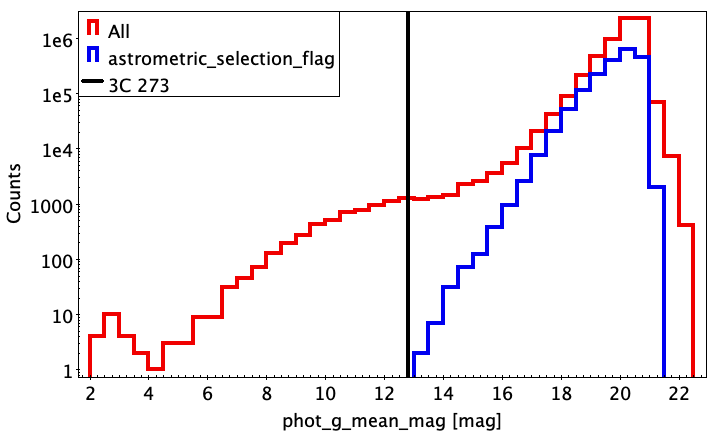
The aforementioned dichotomy between purer and more complete sub-samples is also apparent when looking at the distribution of the apparent magnitude phot_g_mean_mag. In Figure 14.35 we show these distributions for both the QSO (top) and GAL (bottom) tables, where a striking tail of bright sources can be observed. If, instead, we select purer sub-samples this tail is no longer there.
When analysing the results of the usual tests we note that the only ones to fail are related to the redshifts, as both redshift_qsoc and redshift_ugc have values that fall outside the expected 0 to 6 range, in the case of quasars, and 0 to 0.6, in the case of galaxies. However, the deviations are always very small ( for quasars, and for galaxies) and are therefore deemed negligible.
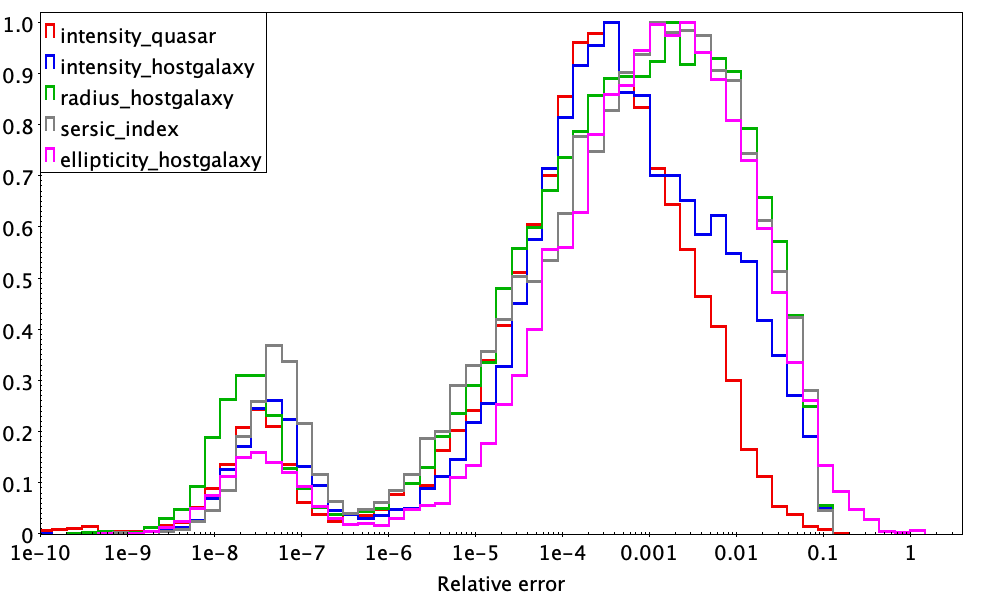
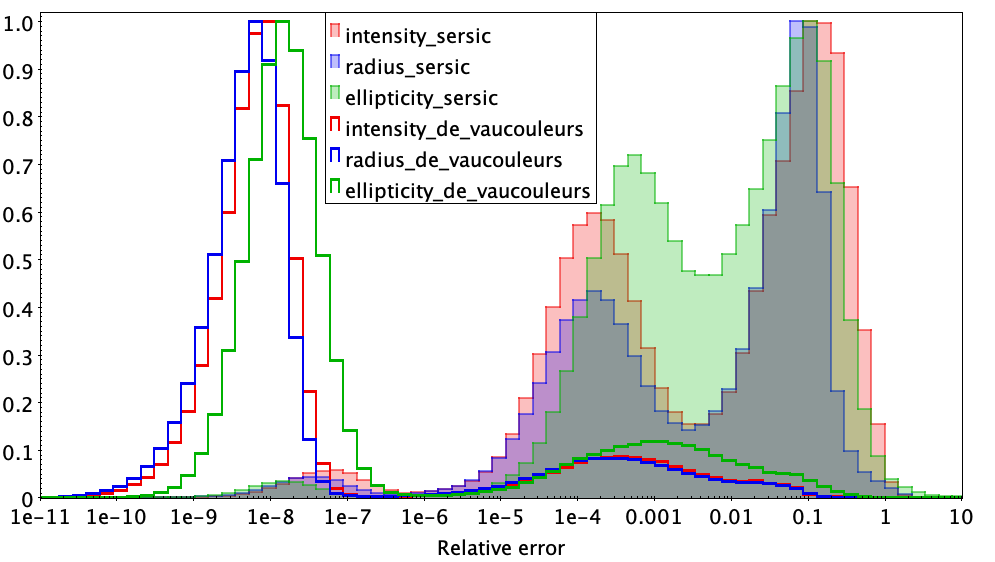
When looking at the uncertainties reported for the morphological parameters derived we noticed a bimodal (sometimes even trimodal) distribution of the relative errors (i.e., radius_hostgalaxy_error over radius_hostgalaxy, for instance). This is observed in both extragalactic tables, with values reaching relative errors as small as 10, as can be seen in Figure 14.36 and Figure 14.37 for quasars and galaxies, respectively. The uncertainties are in fact related to the speed of convergence to the solution and are therefore a measure of the quality of the fit rather than a formal error in the derived quantities.
We also note that, probably due to numerical problems, the covariance matrices of the sources with extremely small uncertainties will most likely not be positive semi-definite (i.e., some eigenvalues will be ).