14.2.1 Global tests
Several tests of the global properties of the catalogue are already discussed in Fabricius et al. (2021) and we here just report some additional tests.
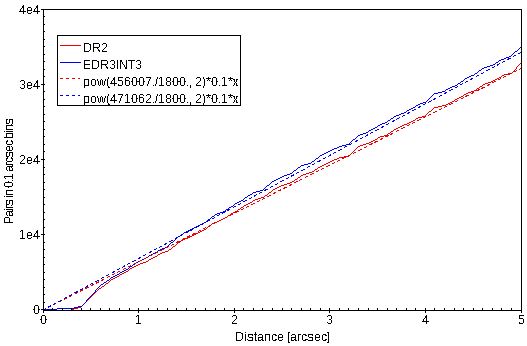
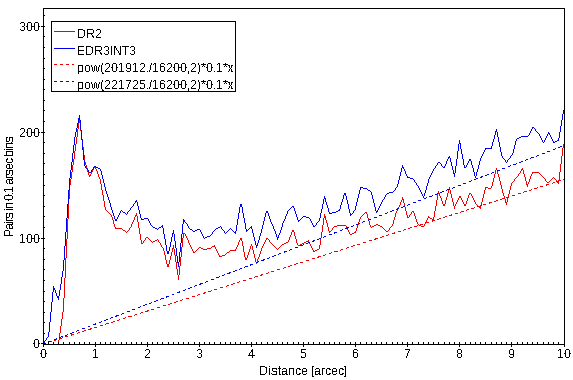
The angular resolution of the catalogue is illustrated in Figure 14.1 for a dense field and in Figure 14.2 for a sparse field. The figures compare Gaia DR2 and Gaia EDR3, and we notice that there are now more sources, but the resolution is basically unaltered. The only difference is a tiny population of source pairs separated between 018 and 04. Such very close pairs, that are only resolved if they have similar brightness and a favourable position angle, were not accepted in Gaia DR2, so their presence now simply reflects a revised criterion for removing duplicated sources. The sparse field shows a population of binaries with separations of a few arcseconds. A similar population is not immediately seen in the dense field which is dominated by much more distant sources.
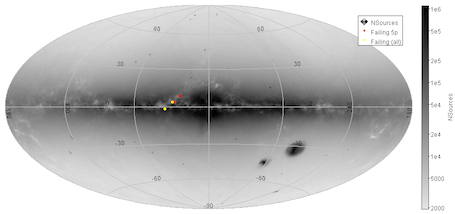
In order to catch certain kinds of processing problems, we are checking the sky for holes in the data. This is done at HEALPix level 6, testing if the number of sources in a pixel is more than five time smaller than the median of its neighbours. Only two pixels show such a dip. They are marked in yellow in Figure 14.3 and fall in a part of the Galactic plane where large star-count variations are normal. Two other pixels, marked in red, have very few astrometric 5-parameter solutions. We interpret these as pixels where relatively few sources had colours in Gaia DR2 and therefore the astrometric solution for Gaia EDR3 had to rely on pseudo-colours.
All sources in the catalogue carry a unique identifier, the source_id, giving the level-12 HEALPix where the source is located and various other subfields. It is in general maintained from one release to the next, but as explained in Torra et al. (2021) this is in practice not always the case.
We here wish to call attention to two issues. First, that some sources have drifted away from the HEALPix given in their source_id, and that 1976 sources (one in a million) are more than 53.8 arcsec from the centre of their pixel and up to 144 arcsec from the pixel boarder. Second, that even if an identifier is repeated from the previous release, there is no guarantee that it represents the same source in both releases, although this is generally the case! The identity should therefore always be confirmed by an astrometric criterion.
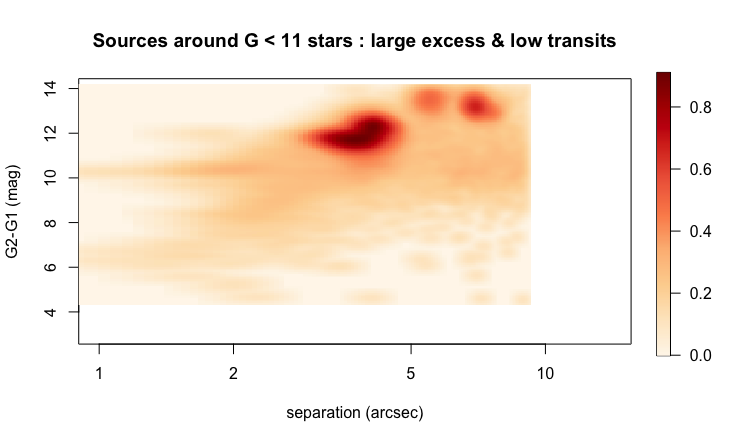
A population of faint, spurious sources has been found near stars brighter than 11 mag as illustrated in Figure 14.4. They have typically at least five times fewer observations than the bright source and astrometric_excess_noise above 30 mas, and separations below 9.