5.4.2 Validation
Author(s): Giorgia Busso
Extensive verification has been carried out on the outputs of the photometric processing. Here only a summary of the validation is given. More details can be found in Riello et al. (2020). Also a section on the known issues found during the validation process can be found in Section 5.4.2.
The results of the calibration process, in particular the calibration coefficients and quality statistics for the Large Scale and Small Scale calibrations were analysed and compared with the previous ones from Gaia DR2, showing an overall improvement and consistency between the median standard deviation values of the Large and Small Scale calibrations for comparable magnitude ranges.
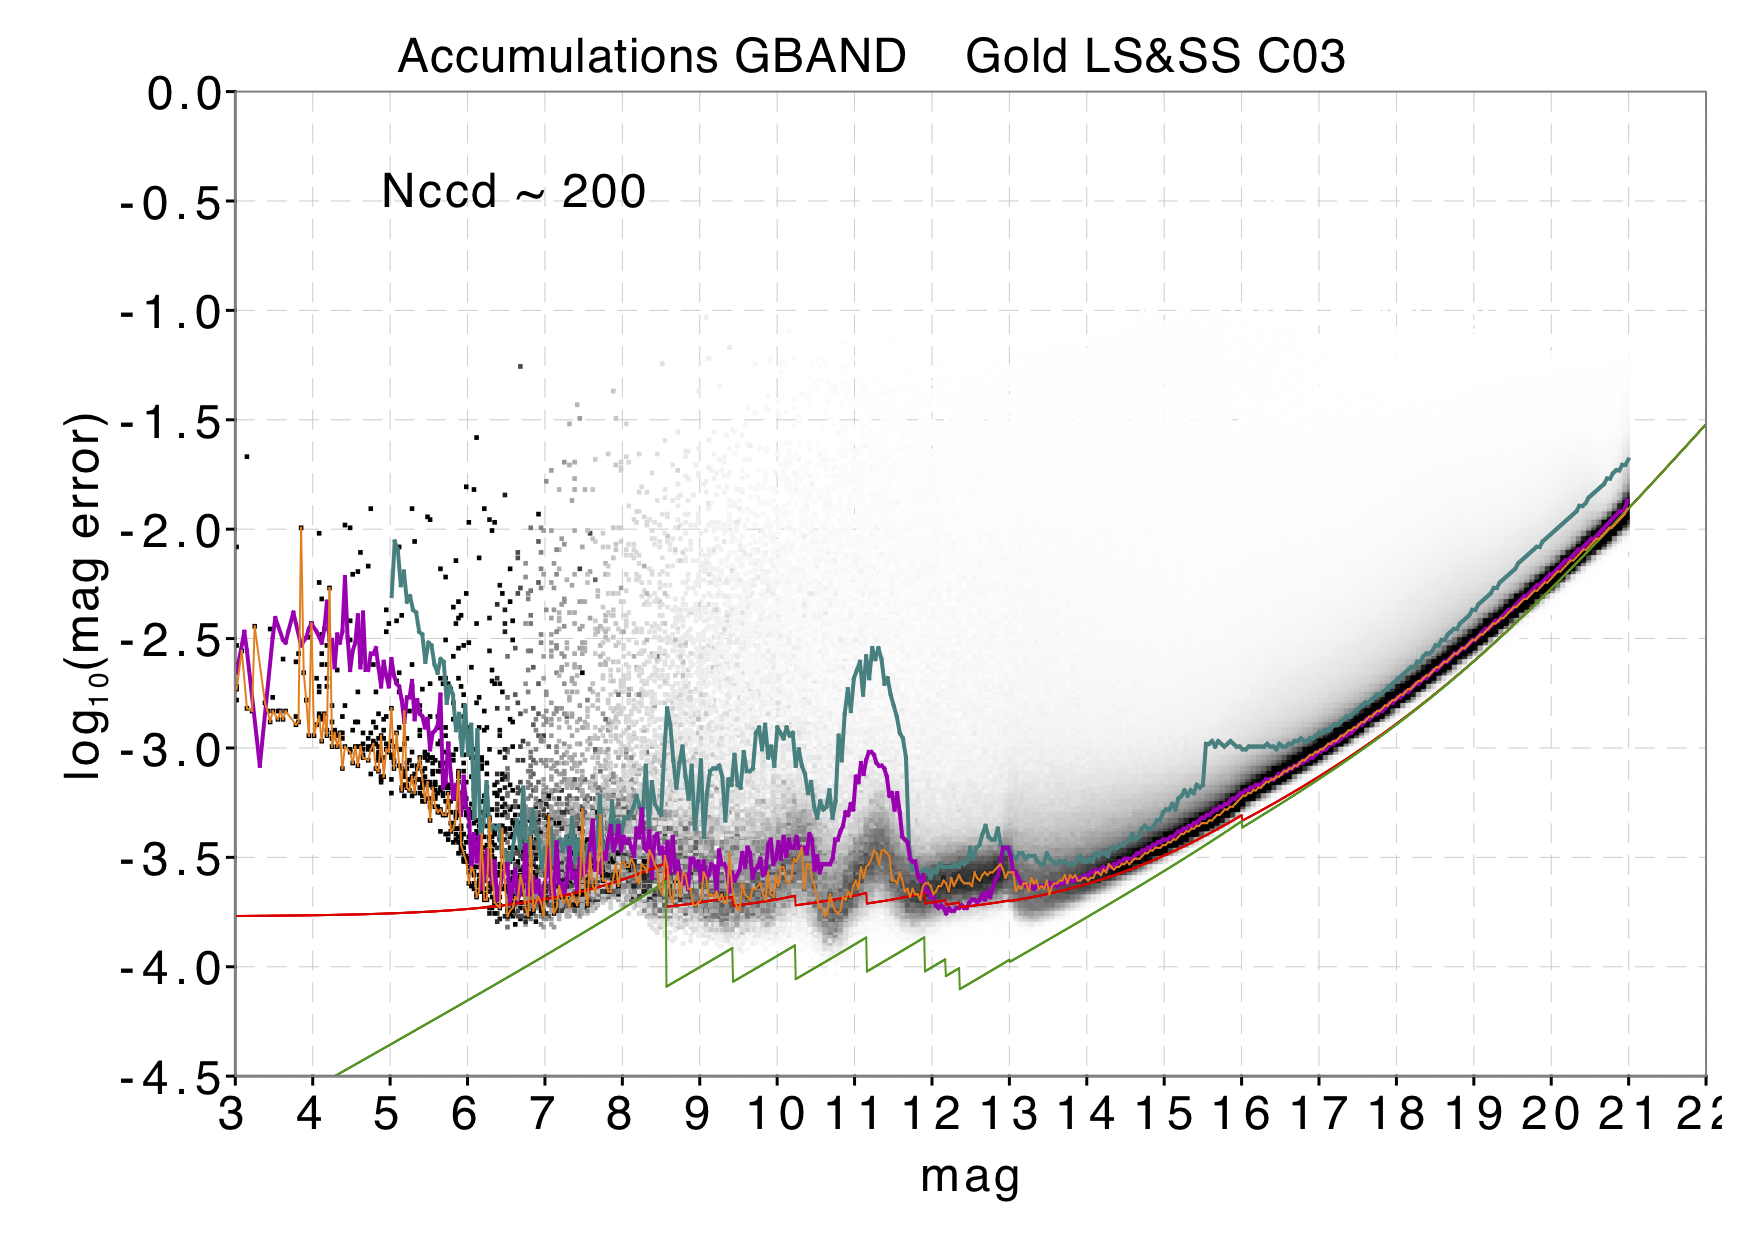
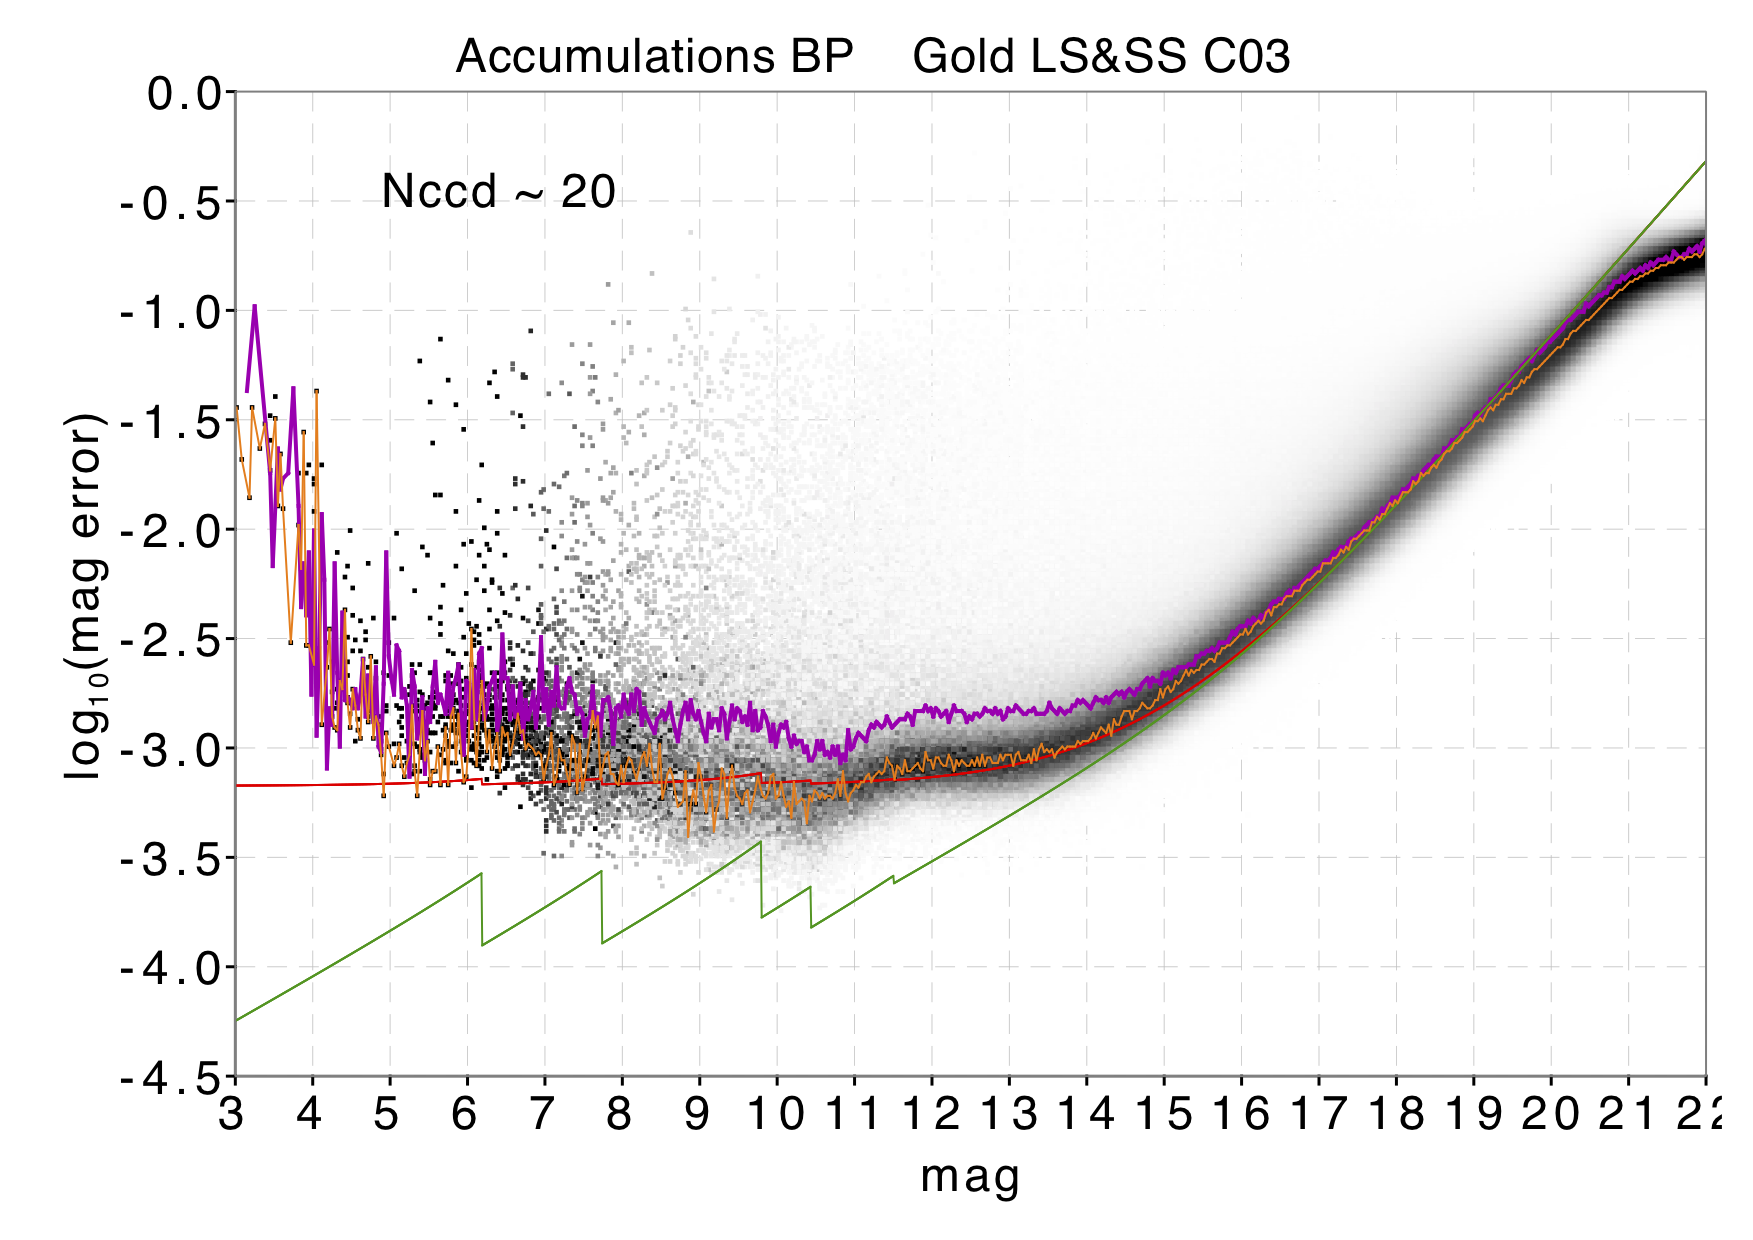
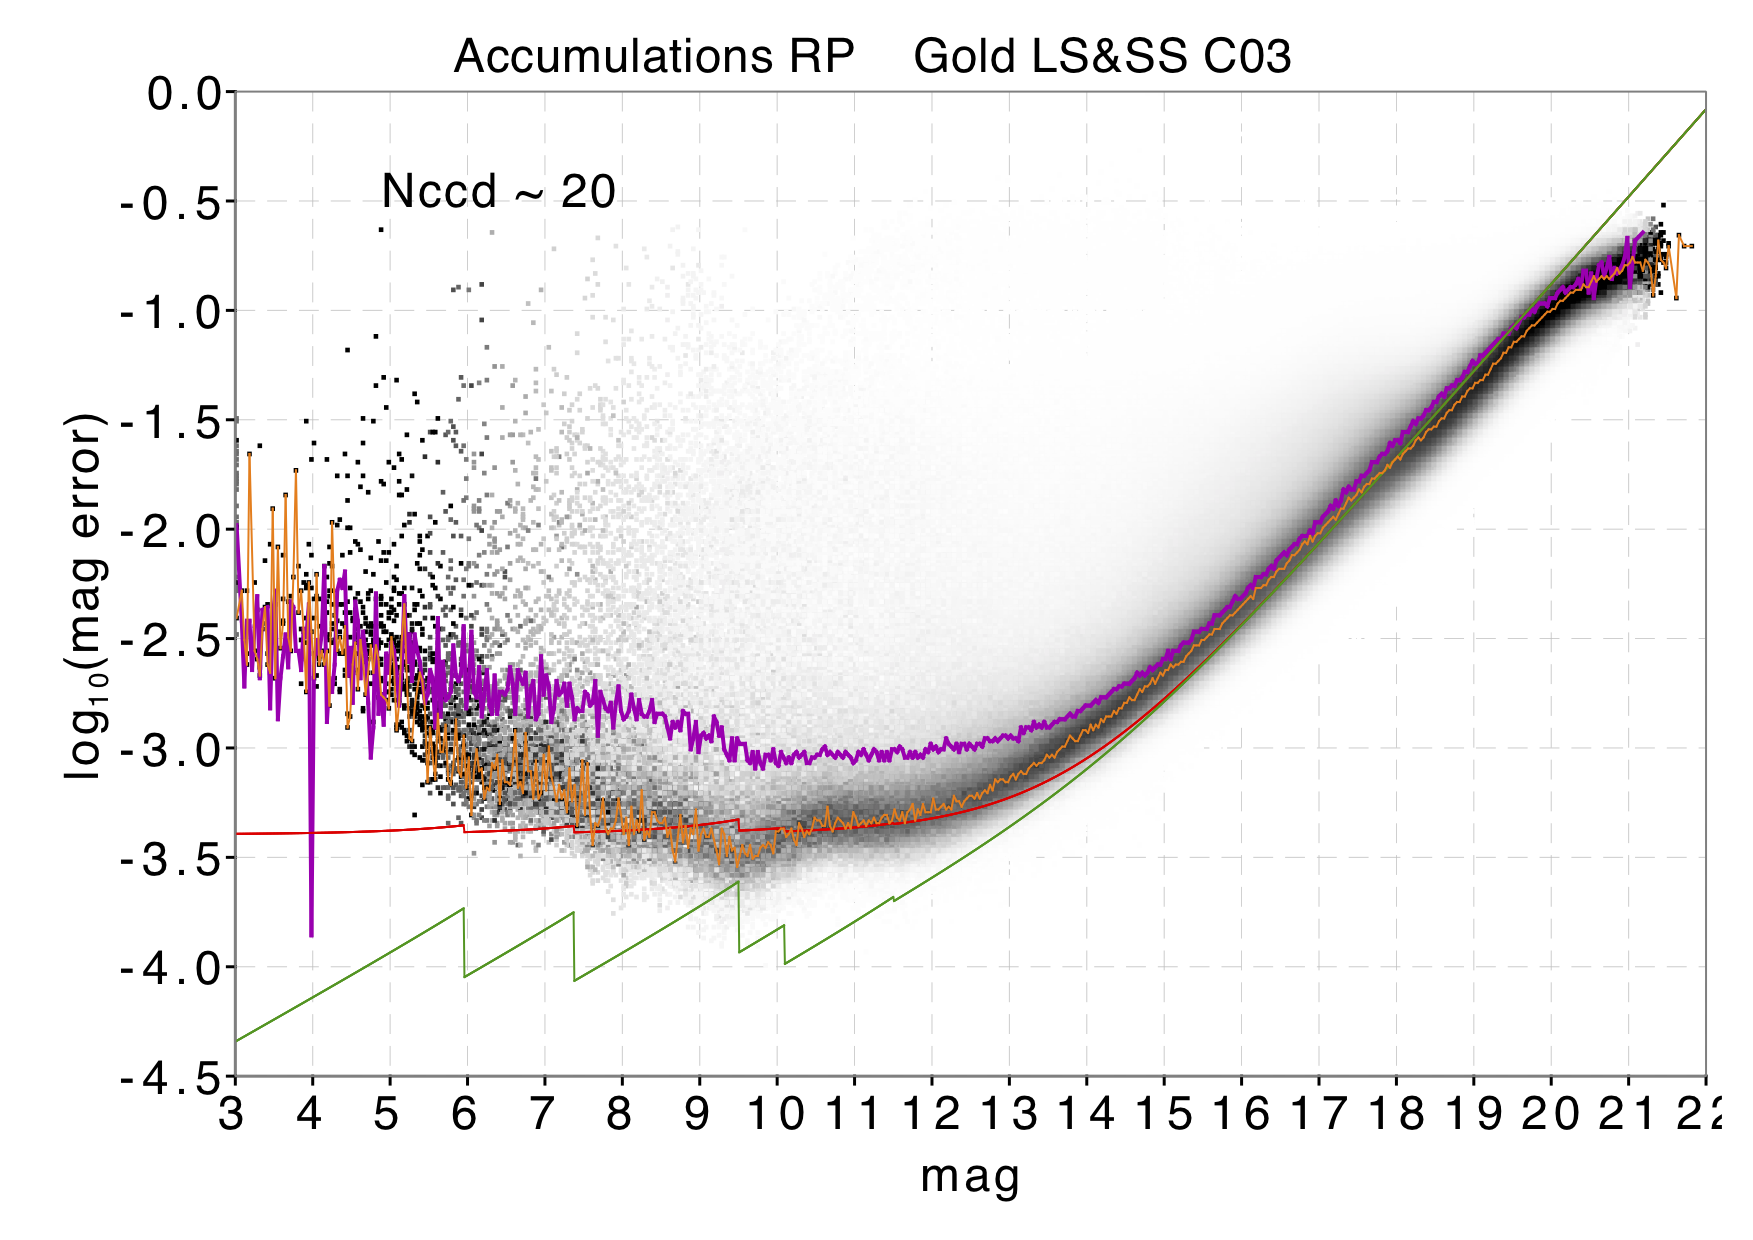
Also the statistical analysis of the source photometry confirms the improvement in comparison to Gaia DR2, caused by better calibrations and Image Parameter Determination results. Top of Figure 5.15 shows the distribution of uncertainty on the weighted mean G-value as a function of the same G magnitude, with the mode of the distribution in orange, clearly below the same for Gaia DR2 in magenta.
BP/RP flux excess
Author(s): Carme Jordi, Claus Fabricius
To a first approximation the sum of and fluxes is expected to exceed the flux by only a small factor (due to the shapes of the passbands with a small dependency on colour).
The flux is determined from profile-fitting to a narrow image, while the and fluxes, and , are obtained as aperture photometry, collecting the total flux inside the transit window, corresponding to a field of arcsec. Because the BP/RP windows are much bigger, these fluxes are therefore much more susceptible to being affected by nearby sources than the flux. Additionally, sources that are not point-like, e.g. galaxies, will be affected in G rather than in BP/RP and hence the BP/RP flux excess will be non-nominal for these sources. For Gaia EDR3 no correction was applied in the case of blending (two or more sources in the same window) or contamination (some flux from a source outside the window) and the expectation is that the colour information for sources affected by these issues might not be accurate, especially when they differ in colour. If the contaminated and contaminating sources have similar colours this is a less of a problem. Also the difference in magnitude can play a role: in the case of blending, a large magnitude difference causes a much reduced effect as in principle the window is assigned to the brighter source; in the case of contamination instead the target source of a given window can be faint and the contaminating source be much brighter, so the larger the magnitude difference the worse the effect, however statistical analysis of the transit crowding status shows that only 0.005% of transits are affected by contamination. Depending on the scientific investigation, the user is recommended to check this consistency metric.
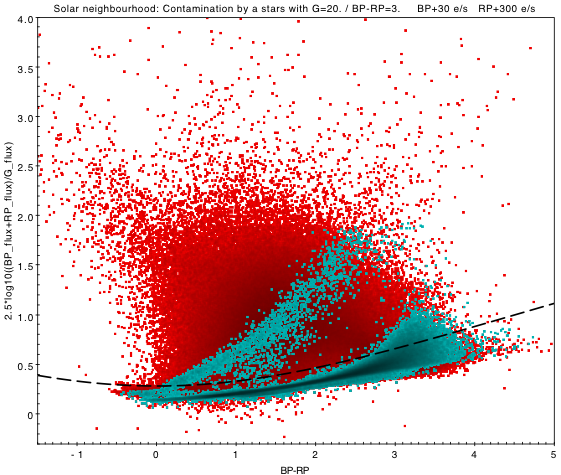
Gaia EDR3 includes the phot_bp_rp_excess_factor parameter computed as the flux ratio , like in Gaia DR2. This metric assesses more the consistency of the photometry more than its quality. Top panels in Figure 5.16 show the flux ratios from the mean fluxes for a random set of 10 million sources. The left and right panels show the gold and silver subsamples respectively. The locus of nominal sources is approximately given by log. Bottom panels show the excess factor towards the direction of the Galactic centre and in the Sirius neighbourhood. The excess factor values are smaller than in Gaia DR2. This is due to a better background estimation in BP/RP, as also the imprint of zodiacal light seen in Gaia DR2 is no longer present. The excess flux ratio is large preferentially in crowded areas. The effect of contamination can be larger on faint sources which therefore show larger deviations from nominal flux excess values. Most of the sources in the clump at and excess flux ratio larger than 4 are classified as galaxies when cross-matched with SIMBAD. In an analysis using SDSS data, 94% of high Galactic latitude sources with flux excess larger than 4 are classified as galaxies.
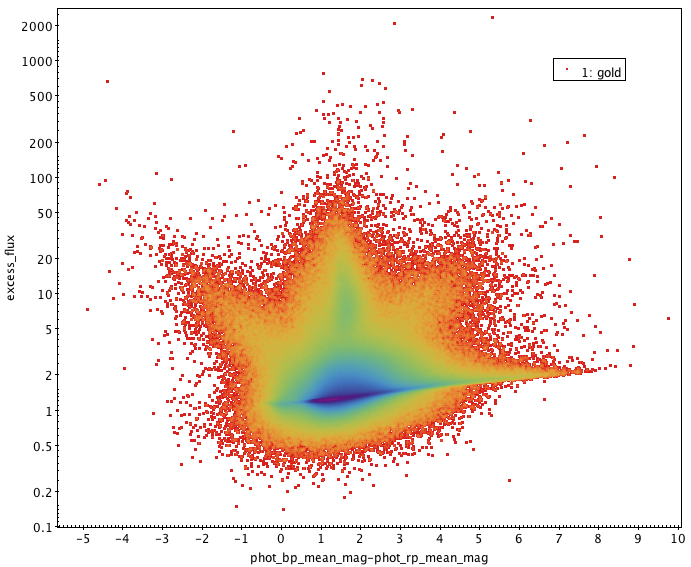
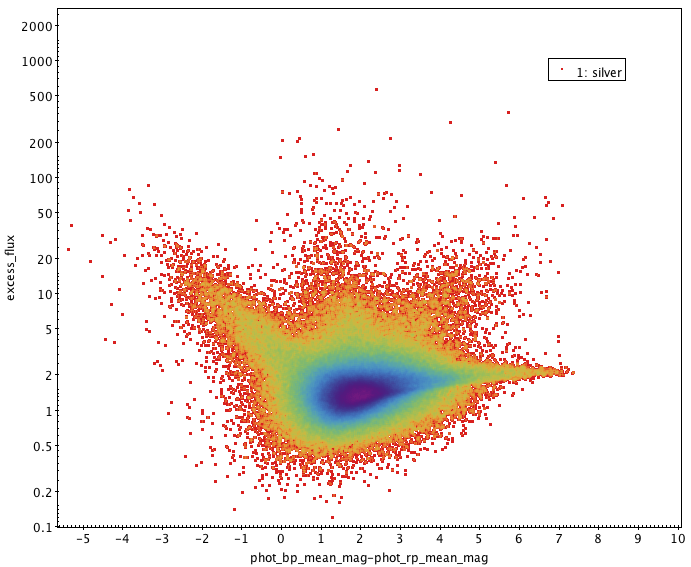
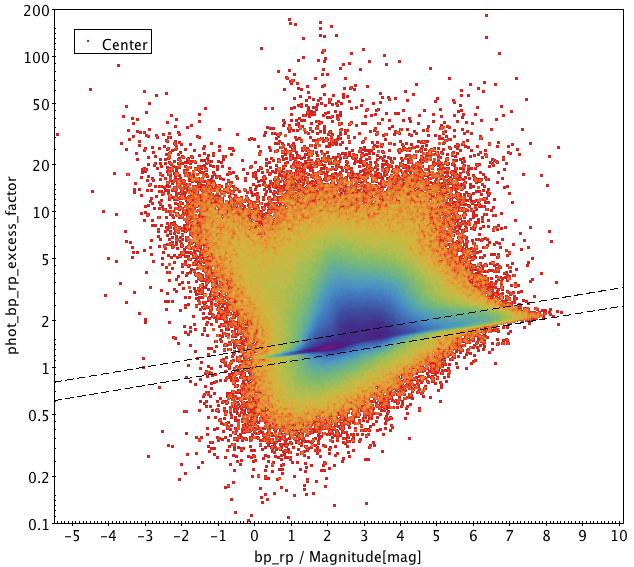
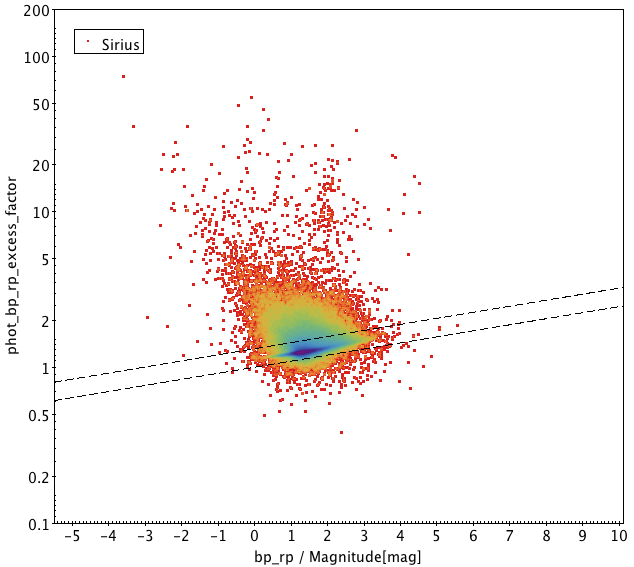
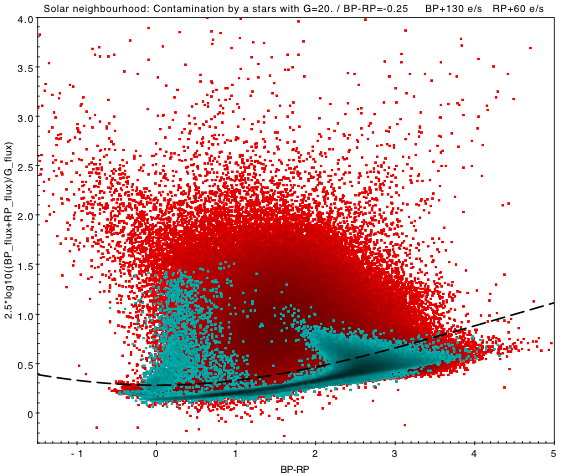
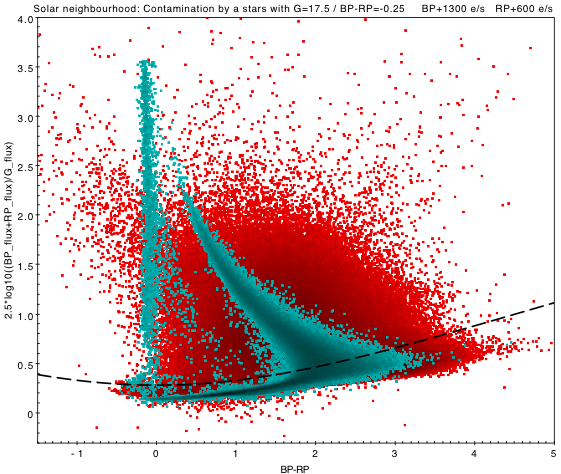
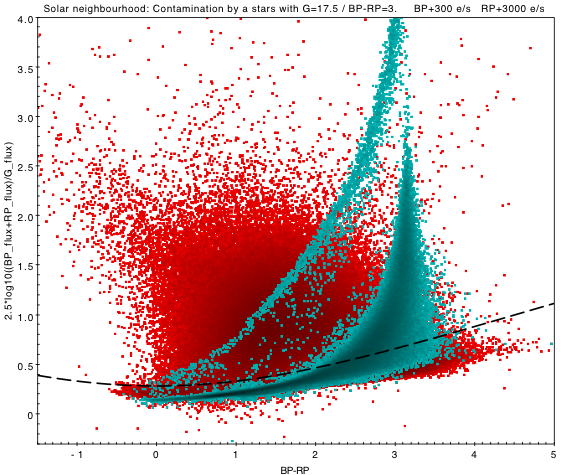
Figure 5.17 shows how well-behaved sources are shifted in the excess flux vs colour diagram when a blending source is added. The purpose of this simple simulation is to illustrate that (a) the colour does not change much when the blending source and the blended source have the same colour, (b) the red sources become bluer when the blending source is of blue colour, and (c) the other way around, the blue sources become redder when the blending source is of red colour. Note that a faint star should not normally be blended by a brighter star, since the transit is usually allocated to the brighter source and therefore the changes in flux excess due to blending shown in the bottom two panels are not expected.
Known Issues
Author(s): G. Busso, Carme Jordi, Claus Fabricius
This section lists the issues found in the photometry that were discovered during the validation. These issues are inconspicuous, but they are documented for the benefit of the user.
Overestimated mean for faint red sources
In Gaia DR2 a lower limit in the flux of epoch observations was introduced, to avoid issues in the accumulation process caused by extreme outliers: calibrated fluxes lower than 1 were excluded by the calculation of the mean flux. The main effect is in , where it can generate an overestimated mean flux for red faint sources, which have a much lower flux in than in . There is a visible effect for for faint blue stars but it is much smaller than in . For more details see Riello et al. (2020).
Sources with poor SSCs
Unrealistic faint sources down to mag were detected. Such faint magnitudes can only arise from processing problems and from investigations in PhotPipe, the root cause was traced to sources with poor SSCs values. In certain cases, when the source is blended with another source or the BP or RP spectra are very faint, the SSCs are not reliable and can result in a magnitude that is too low to be observed by Gaia. This has led to the exclusion of , and for more than 5 million sources in the final catalogue. Details can be read in Section 8.2.3. These sources were consequently calibrated as bronze sources (Section 5.4.1) using default SSCs and are available as an external table on the Gaia EDR3 known issues page. For more details see Riello et al. (2020).
Systematics caused by using a default colour in IPD
To obtain a precise position and flux for an epoch observation in , the correct LSF/PSF needs to be selected for the Image Parameter Determination (Section 3.3.6). This choice is based on the colour of the source by using the value calculated by the BP/RP spectra. When this is not possible, a default value is adopted. This causes a systematic effect in the photometry that nevertheless can be corrected following the procedure described in Riello et al. (2020).
Sources with Zero error
A handful of sources have the error on the integrated mean flux equal to zero in the and photometry ( phot_bp_mean_flux_error and phot_rp_mean_flux_error). All these sources have only two observations in the relevant passband that are identical within the seventh/eighth decimal place, hence the error on the mean flux is zero. In this case the value corresponding to the integrated mean flux divided by its error ( phot_bp_mean_flux_over_error and phot_rp_mean_flux_over_error is then null. The user should be then careful when selecting sources based on this value.
The affected sources have the following SourceIds:
-
•
4110033292835338880
-
•
5598418539525022720
-
•
6182038628644141440
-
•
4129676549067824384
-
•
6744092651890568704
-
•
4086904275433421824
Offset between observed and synthetic magnitudes in the G band
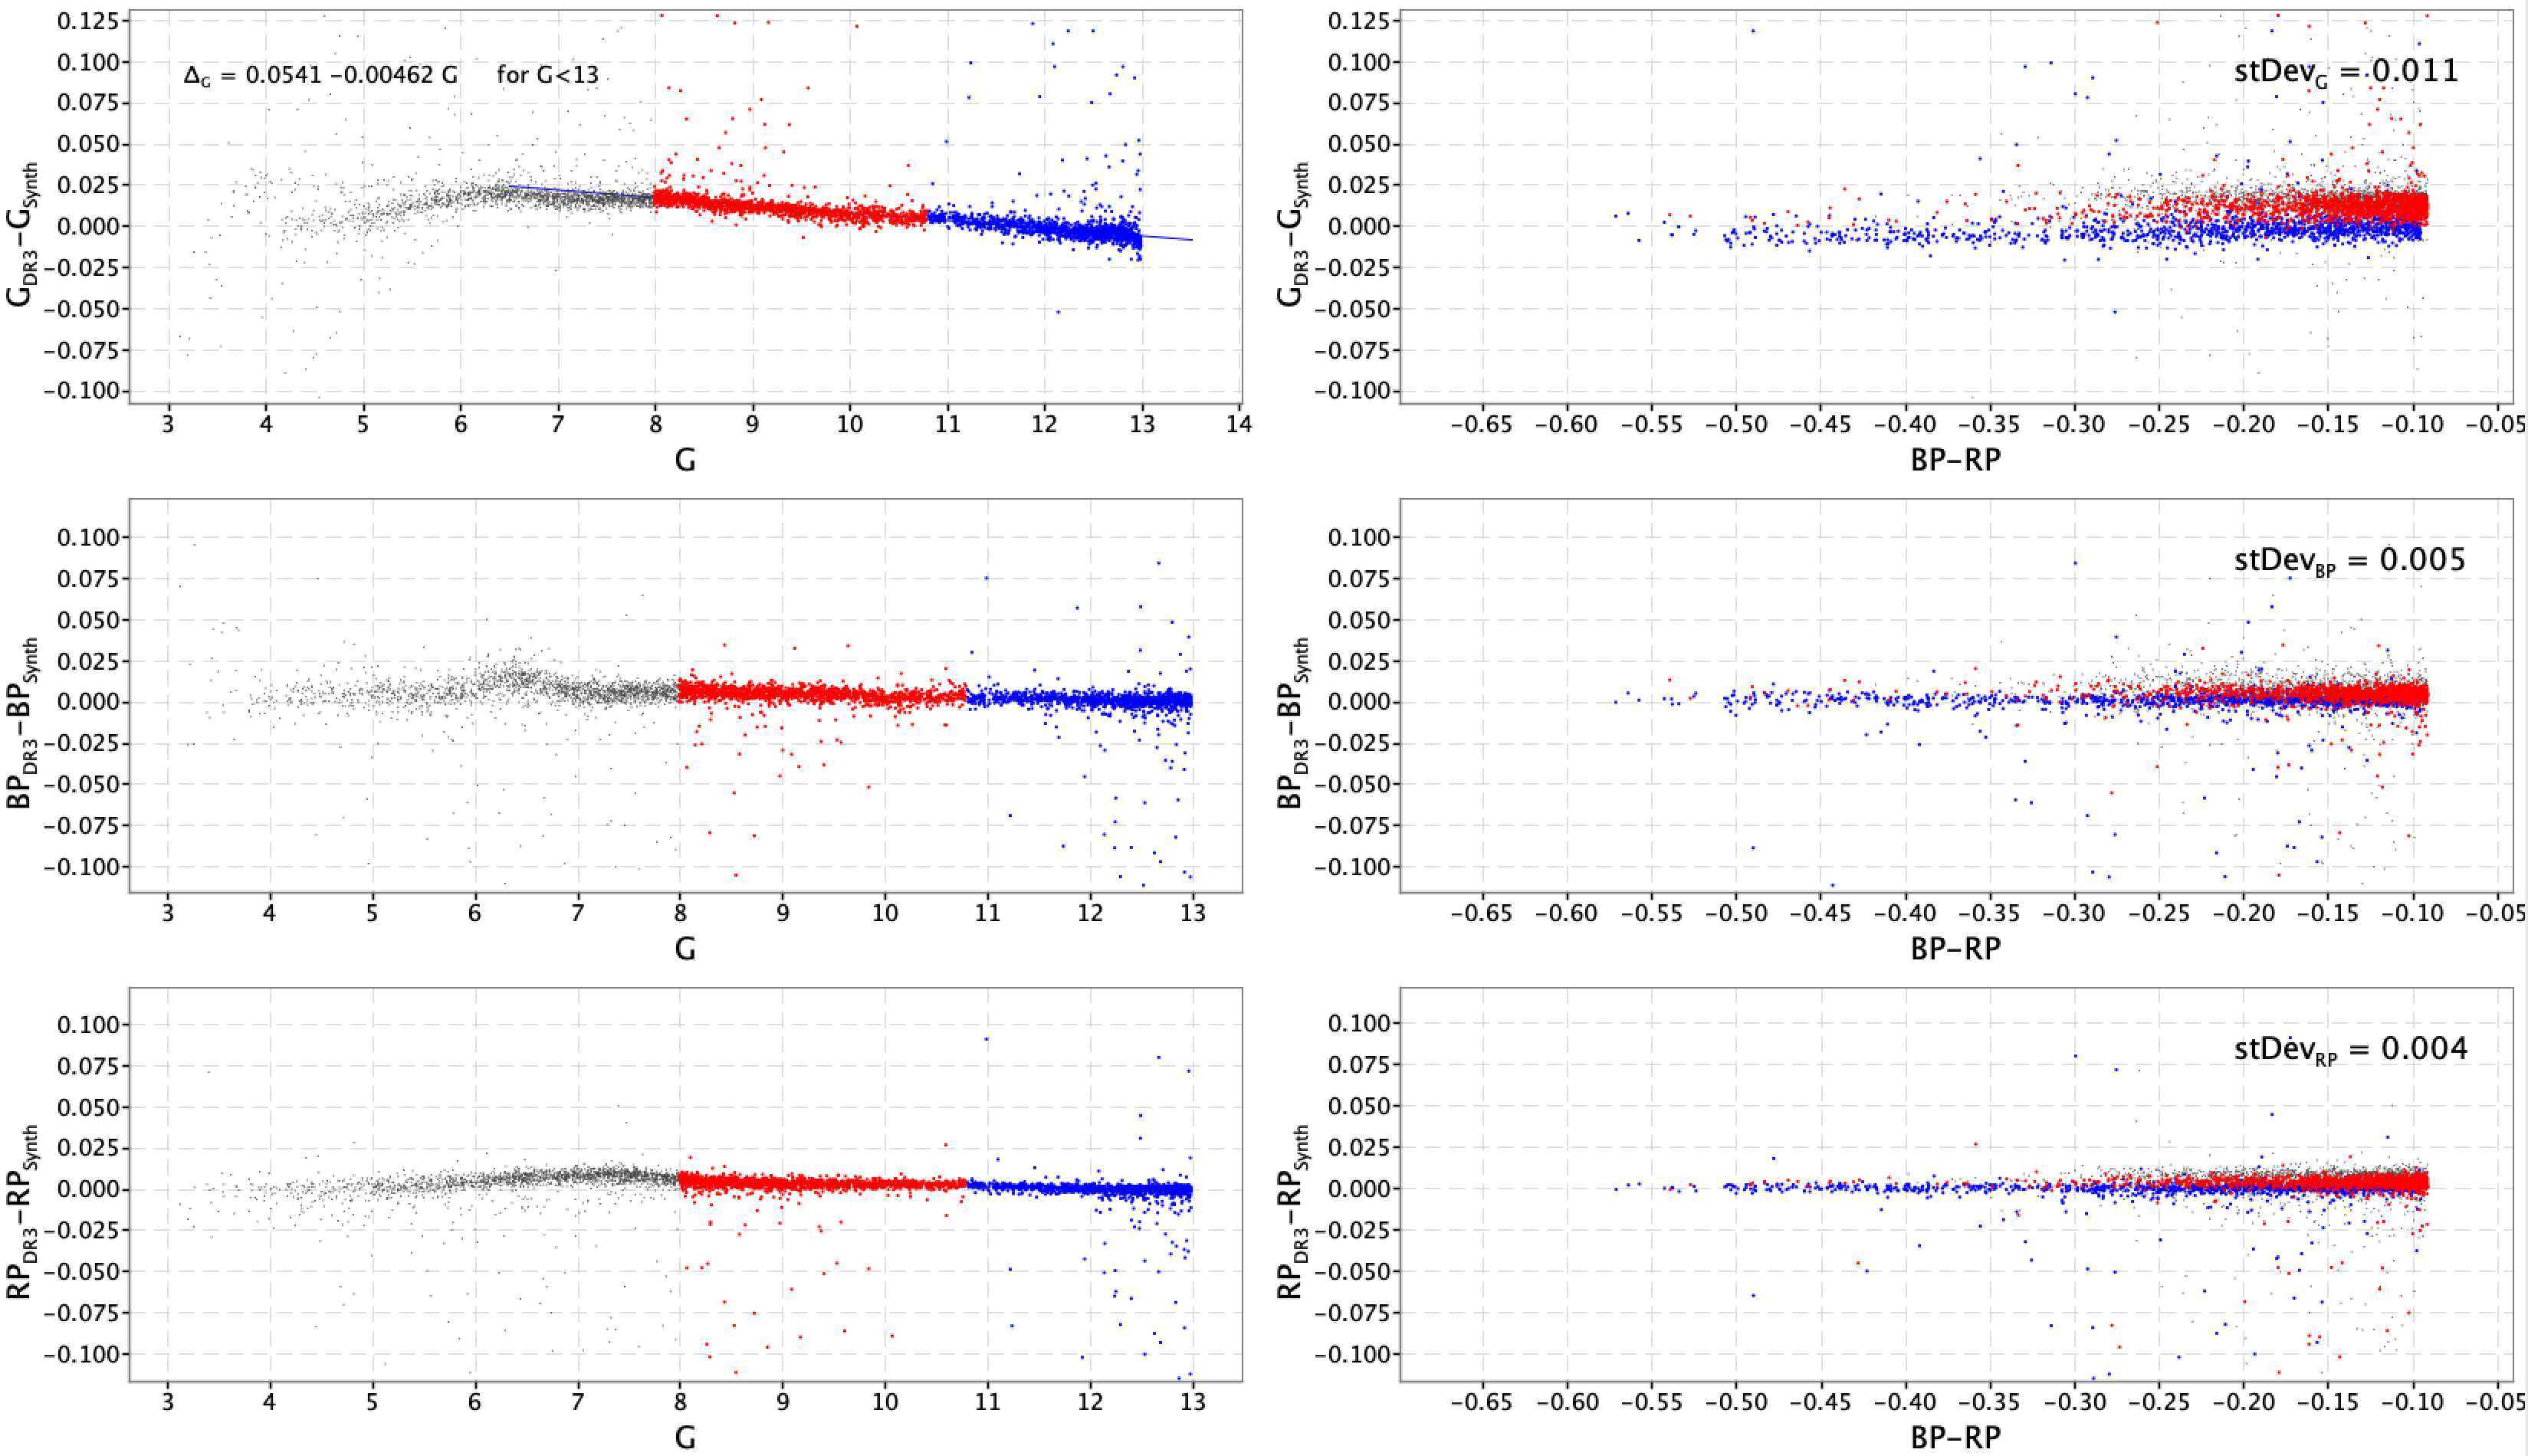
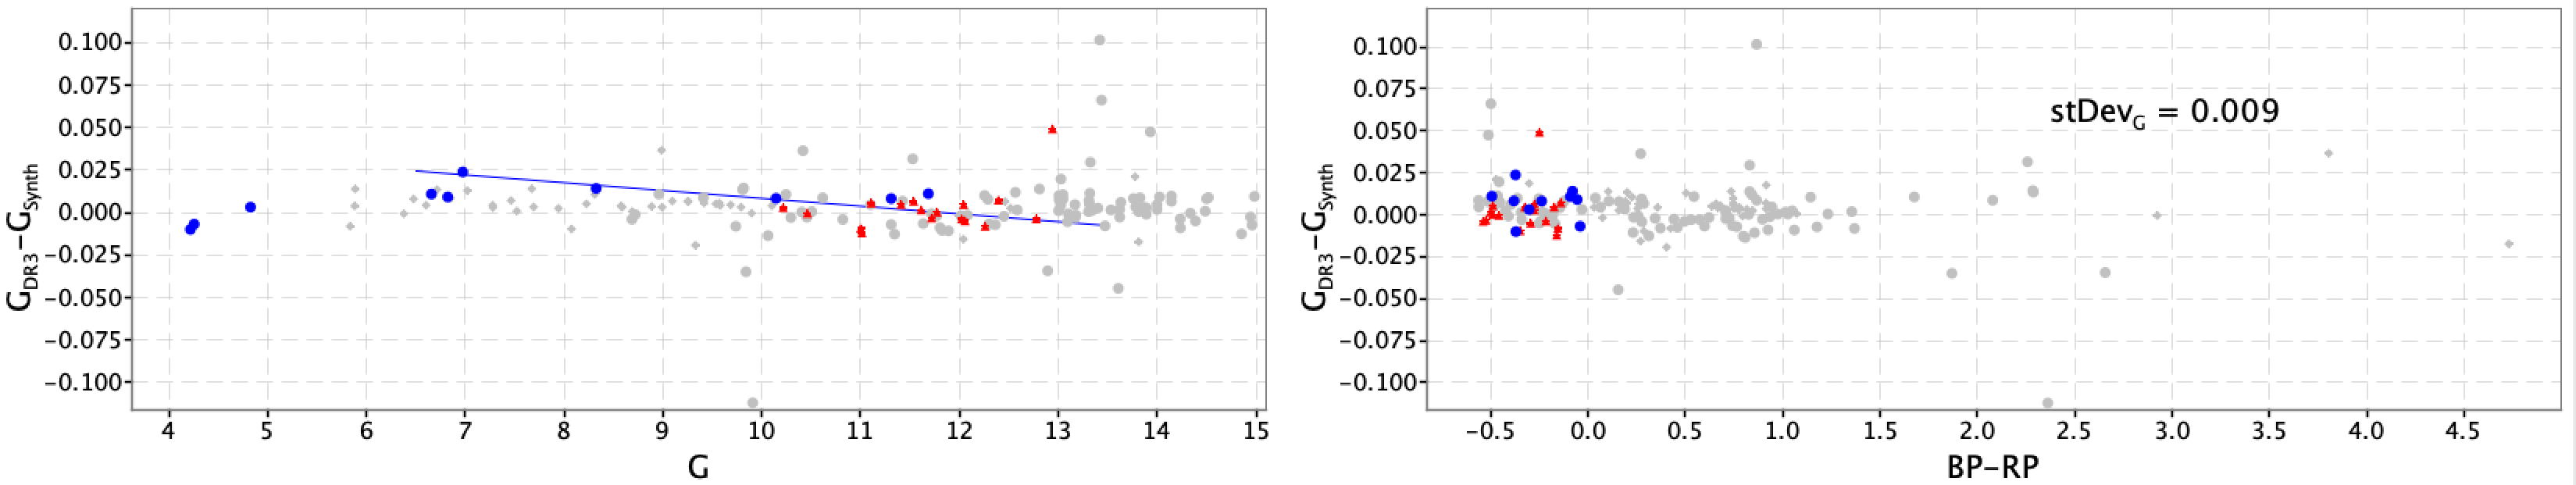
An anomaly has been discovered in the data while looking at the residuals between observed and synthetic magnitudes derived from XP spectra for an all sky sample of sources with colour and magnitude . These residuals are shown in Figure 5.18 and the top-left plot shows a clear trend with magnitude that is not seen in and : the blue line fitting the data shows a loss of about 5 mmag per magnitude interval. This effect can be barely revealed in the residuals of SPSS and PVL sources when greying out sources with colour bluer than and with as done in Figure 5.19: the blue line is the same fitted to data of Figure 5.18. The origin of this effect can be found in the ELSF calibration (see Section 3.3.5) were problems are known to exists with the PSF model for long gates (specifically the lack of modelling the joint AC/AL rate effects).