14.7.1 Astrometry
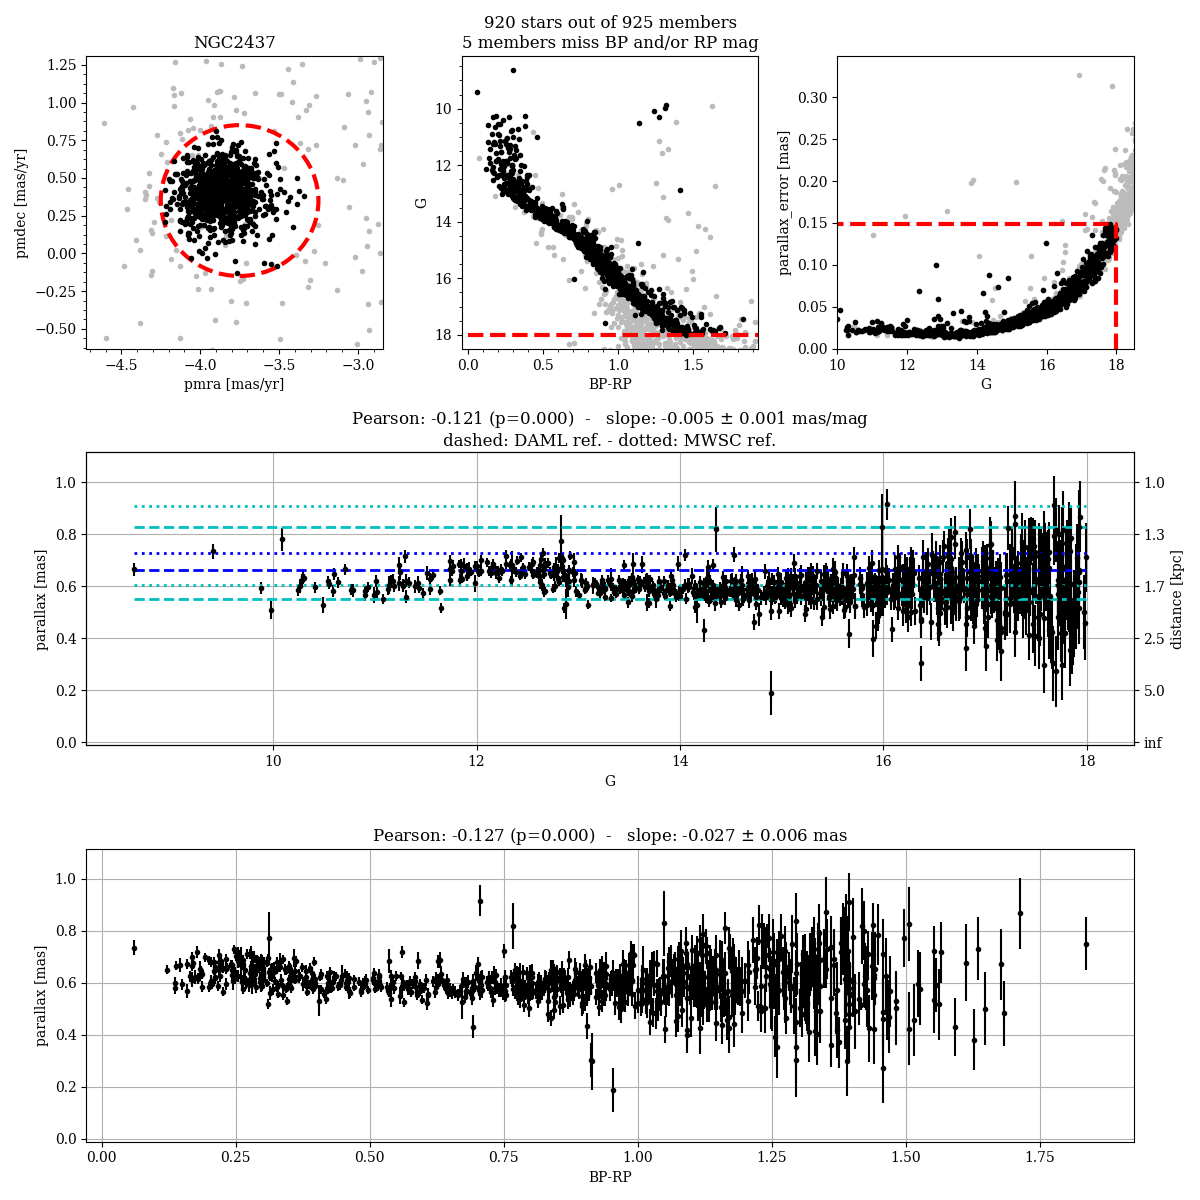
When we use clusters located farther than 1000 pc, we derive an average zero point difference with MSWC mas for MWSC and DAML respectively, but with a large . However, looking at the trends with colour and magnitude, we find a complex pattern. This is also evident looking at individual clusters, whose members are selected on the basis of the proper motions (see for instance Figure 14.70).
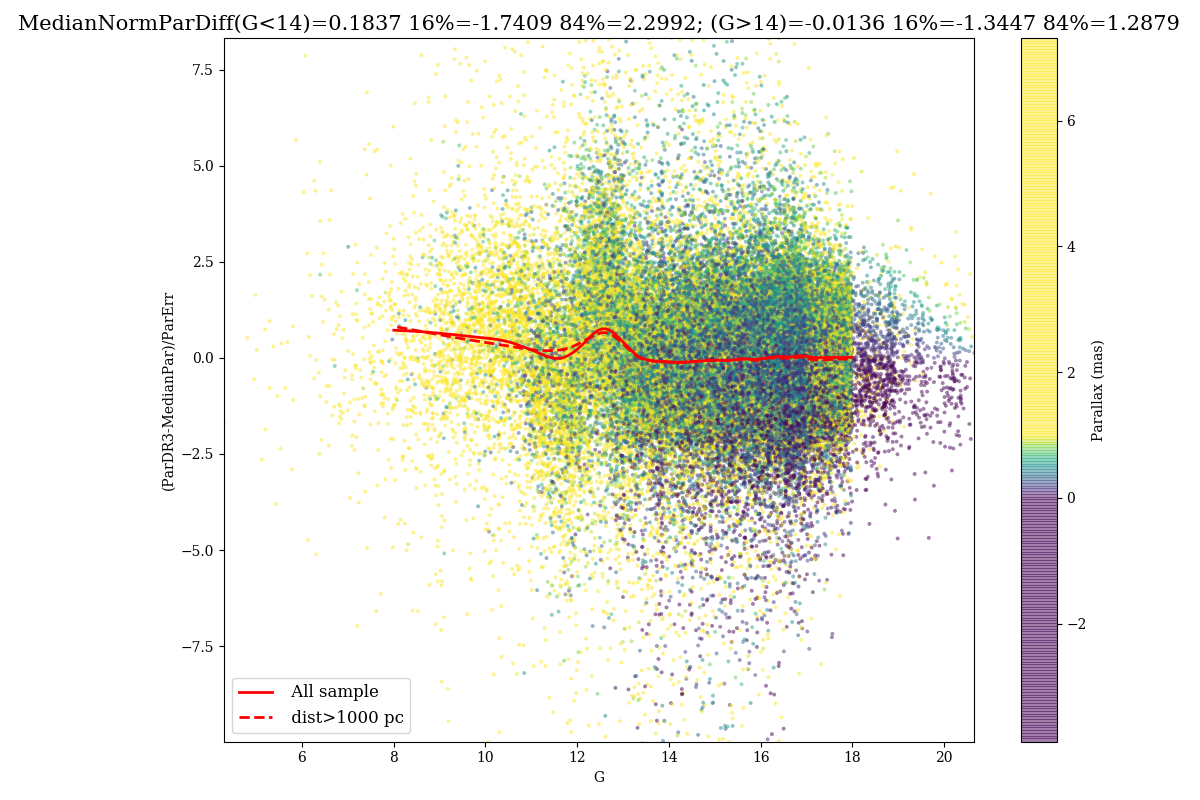
Looking at differential parallax to the cluster median , for the whole sample of clusters located farther than 1000 pc, we get indication about zero point changes. When plotted versus jumps in the zero point at =11.5,13,14 are evident. Strong variations are evident for stars bluer and redder than . When divided by the nominal uncertainty, these patterns are still present, with reduced amplitude, implying that nominal uncertainties on the parallax do not account for the zero point variation, i.e. nominal uncertainties are underestimated. More detail can be found in Fabricius et al. (2021).
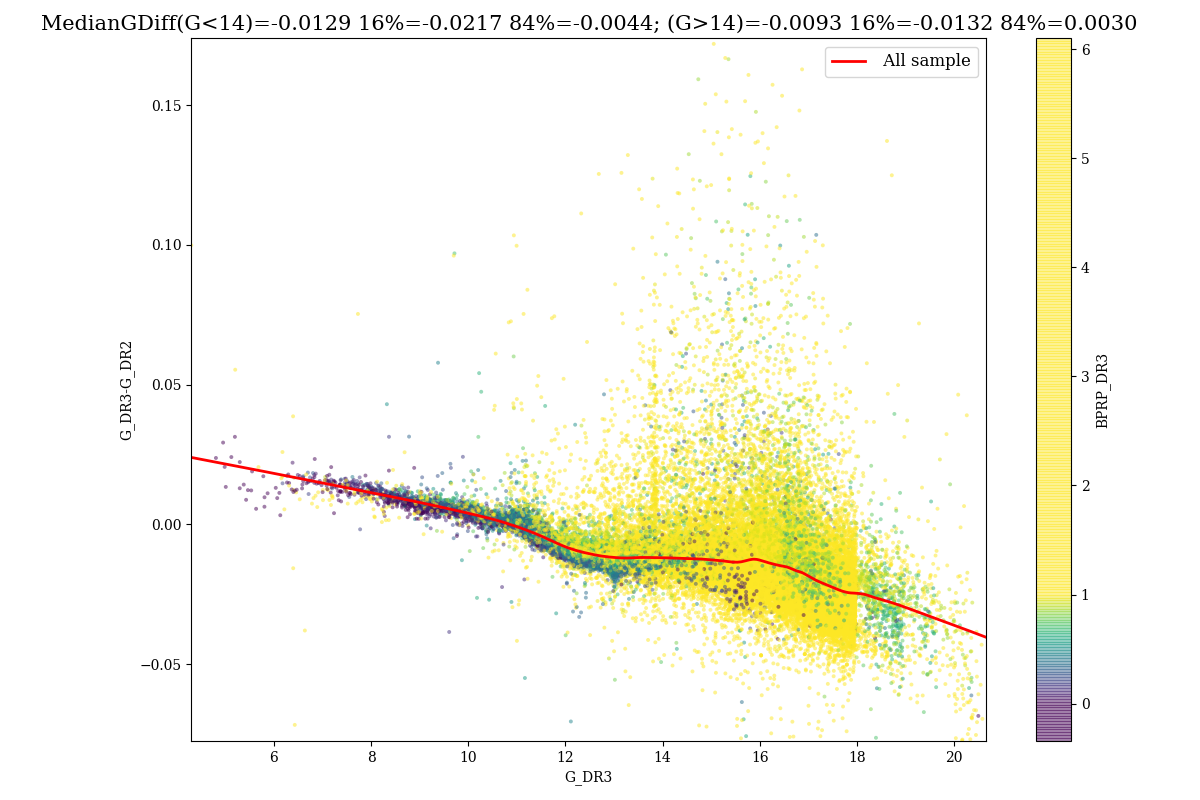
Finally, we compare the parallaxes of single stars in Gaia DR2 and Gaia DR3. The median difference is ( mas, ( with mas; mas) on the whole sample, with a dependence on the magnitude.
Astrometric precision of parallaxes
In Figure 14.71 we analysed the uncertainties on the parallax for clusters more distant than 1000 pc. We analyse the difference between Gaia DR3 parallaxes for single stars and the median parallax of the cluster normalised to the Gaia DR3 nominal error. The sigma of the distribution is larger than 1 () i.e. the uncertainties are underestimated. In particular, formal uncertainties underestimate the errors mainly for stars brighter than . The distribution shows a bump at .
Proper motions
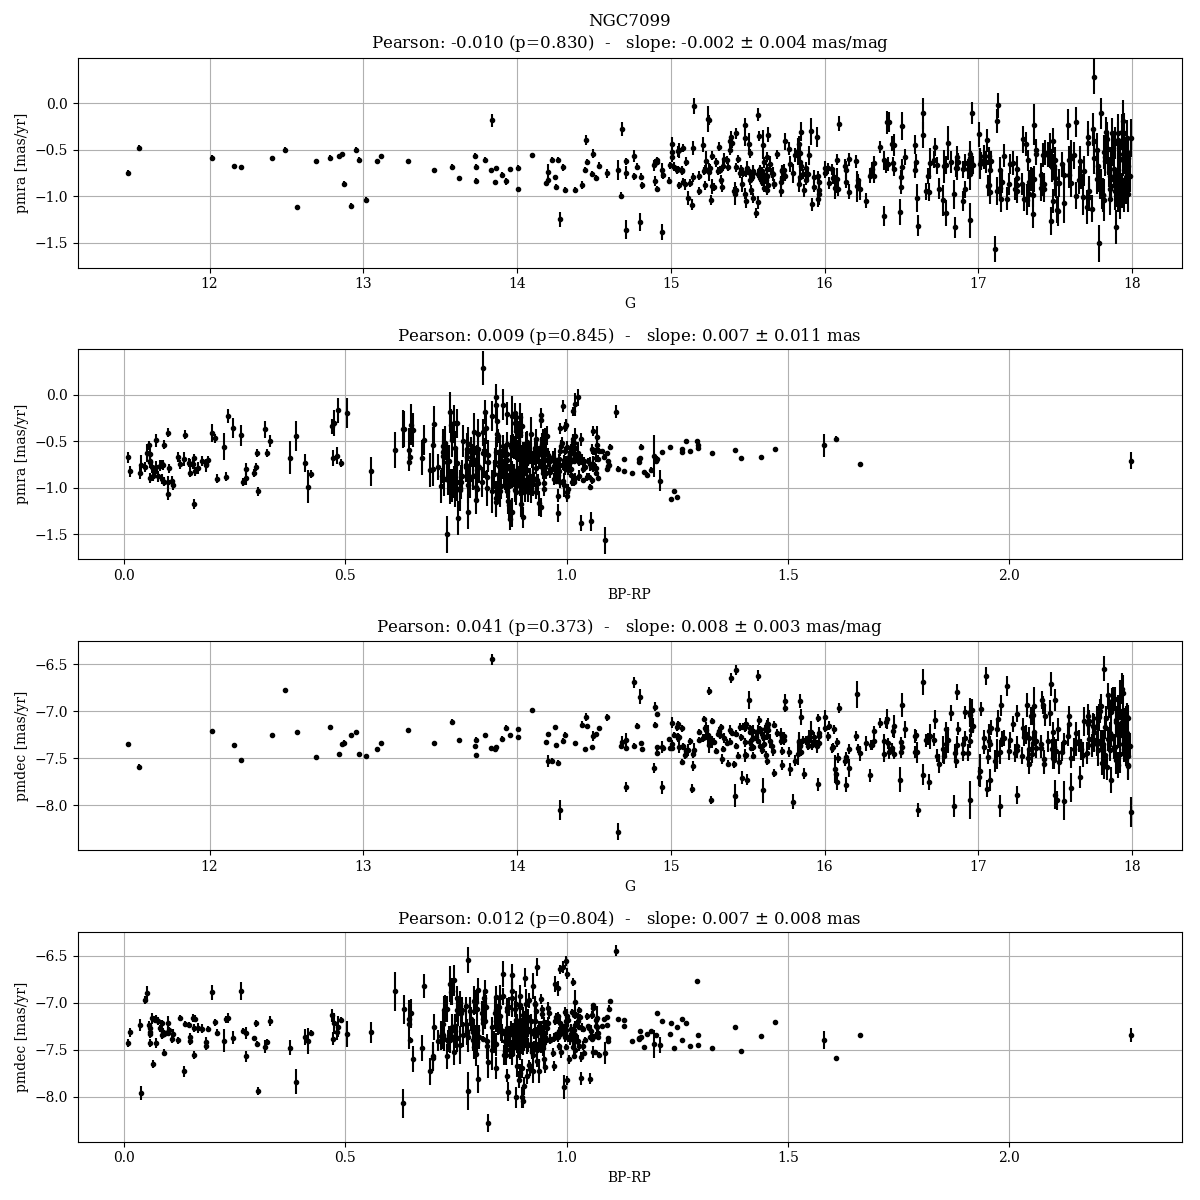
Figure 14.72 shows the case of NGC 7099 compared with literature values. The zero point of proper motions presents a complex dependence on magnitude and colour. Similar patterns are evident for all the clusters. The dispersion of the proper motions is not accounted by the nominal uncertainties, i.e. nominal uncertainties are underestimated, mainly at the bright end ( ).
We calculate the proper motion differences (median) between Gaia DR3 and Gaia DR2 for the best cluster sample. The zero point median difference is in right ascension and in declination on the whole sample.
Proper motion precision in crowded areas
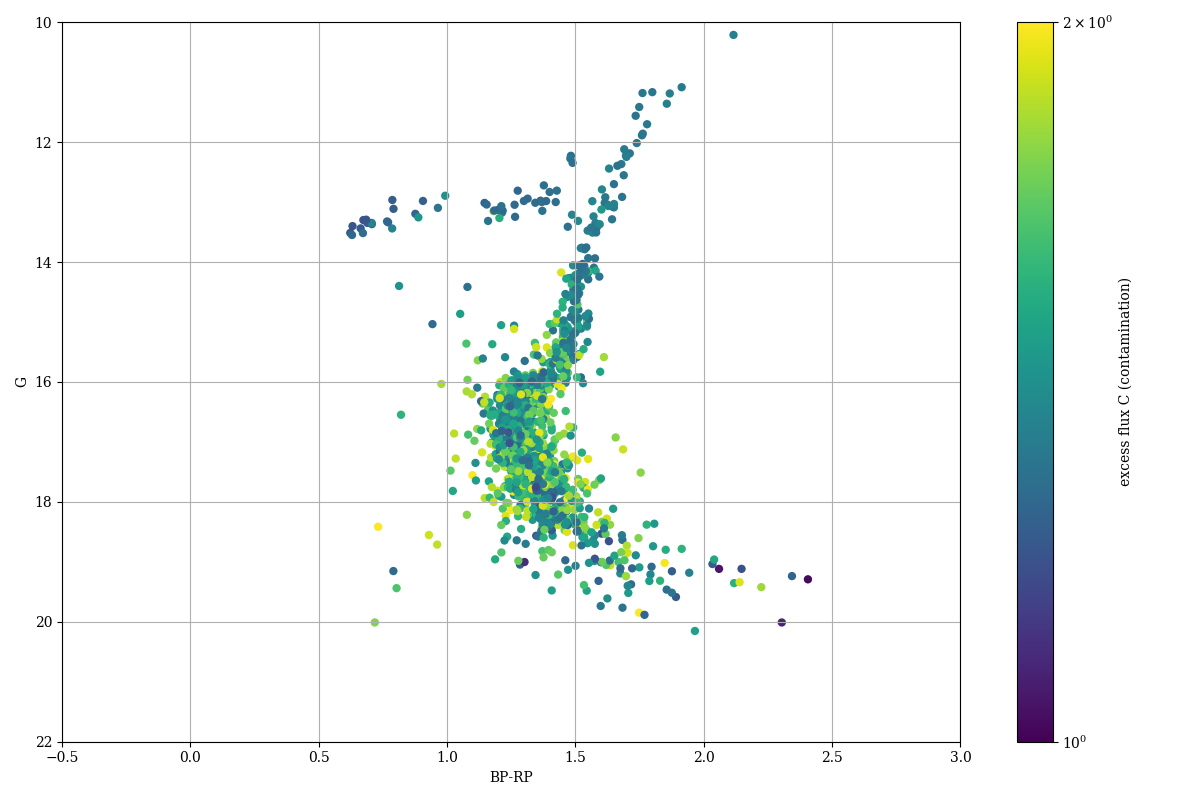
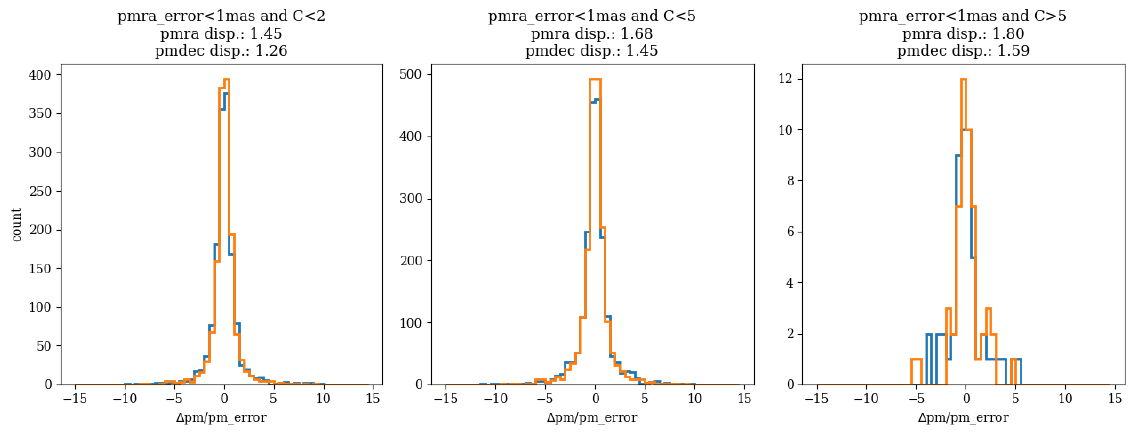
We compare the proper motions in the centre of M4 with external HST data (Nascimbeni et al. 2014) , where high quality relative proper motions are available. The precision of HST proper motions is of the order of 0.33 . M4 stars are affected by crowding already at bright magnitudes ( 16-17) (see Figure 14.73) In Figure 14.74 we present the scaled dispersion of the difference between Gaia and HST proper motions for the stars having different Gaia nominal uncertainties, and a moderate (c=2) to high () colour excess. The colour excess is taken as a proxy for the level of contamination. The scaled dispersion is very close to 1 for both and for bright stars with little contamination, but it gets to 1.6-1.8 for faint stars with a high contamination level. This indicated that the nominal uncertainties are correctly estimated only for bright stars.
Integrated Photometry
CMD features
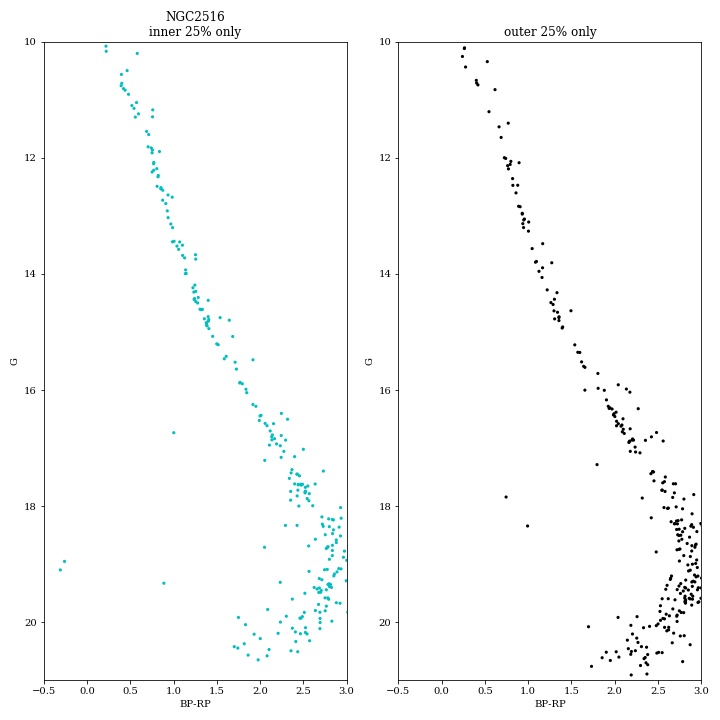
In Figure 14.75 we show the CMD of NGC 2516 where stars are selected on the basis of the pms. A hook is visible from and where a number of stars have a too blue colour for their location in the main sequence. This behaviour is found in all the clusters where the photometry reaches this magnitude (see for details: van Leeuwen 2021; Riello et al. 2021).
Photometry in crowded clusters
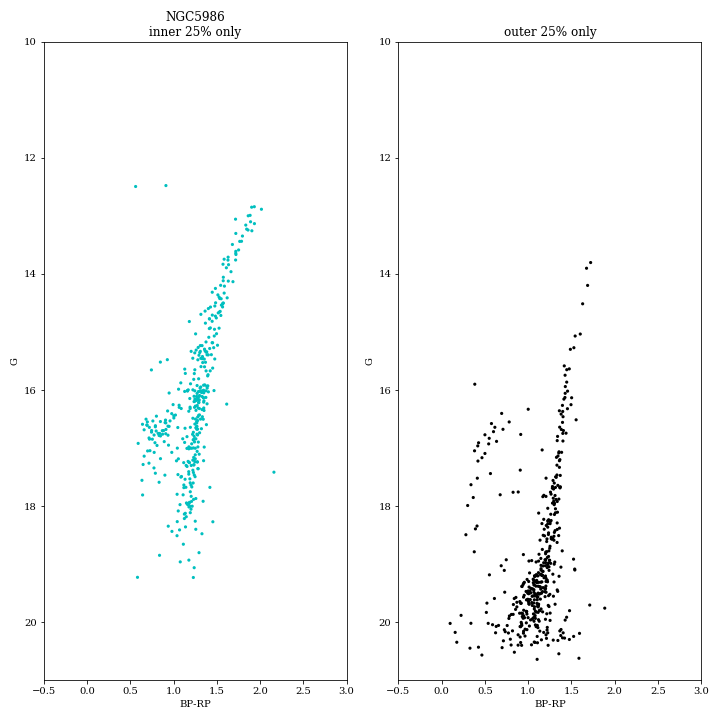
Photometry in crowded areas is still worse than in non-crowded regions. This is the case for all the globulars, where the photometry in the inner regions is shifted in colour and magnitude as an effect of crowding, with a large dispersion. See for instance Figure 14.76 showing the quality of the photometry in NGC 5986.
Comparison with Gaia DR2 photometry
The photometry of Gaia DR2 and Gaia DR3 are on different photometric systems. Median differences are very small, i.e. 0.0087 (), 0.0027 (), 0.0074 (), 0.0074() with dispersions of the order of 0.01-0.02 in , , , and lower in . However, for a small sample of stars differences can be higher than 1.5-1.7 mag in and , possibly related with the small number of observations (30). The difference shows a bump at 11.5 as an effect of the different calibrations (see Figure 14.77)
Completeness in crowded areas
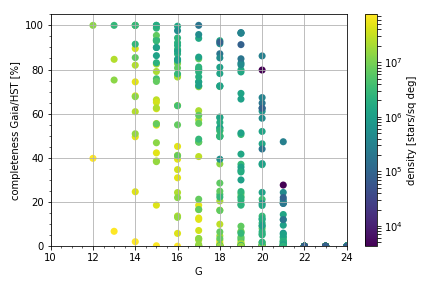
We derive the completeness for 26 globular clusters comparing Gaia DR3 data with HST completeness Sarajedini et al. (2007). The procedure and the sample are the same already used for Gaia DR2. We remember that the completeness of HST data is derived using crowding experiments and is higher than 90% in the whole Gaia range. Completeness table for all the clusters can be found in Fabricius et al. (2021). In Figure 14.78 we present the completeness as function of .
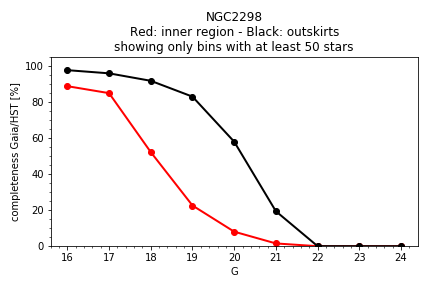
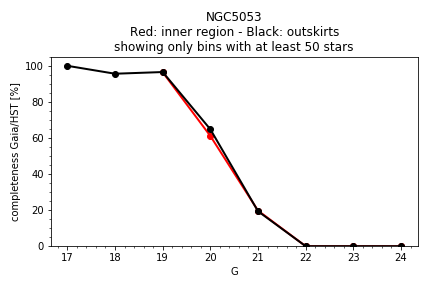
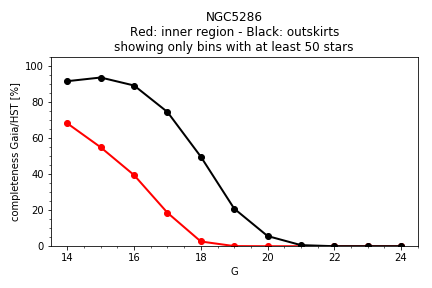
A few significant cases are shown in Figures 14.79, 14.80, 14.81. In NGC 5053, the completeness in the inner and outer regions are very similar and quite high (60% at =20), in NGC 2298 the inner and outer regions have very different level of completeness. In the inner region, the completeness is about 10% at =20, and 60% in the outer region. In NGC 5286 the completeness in the inner region is 20% at 17.
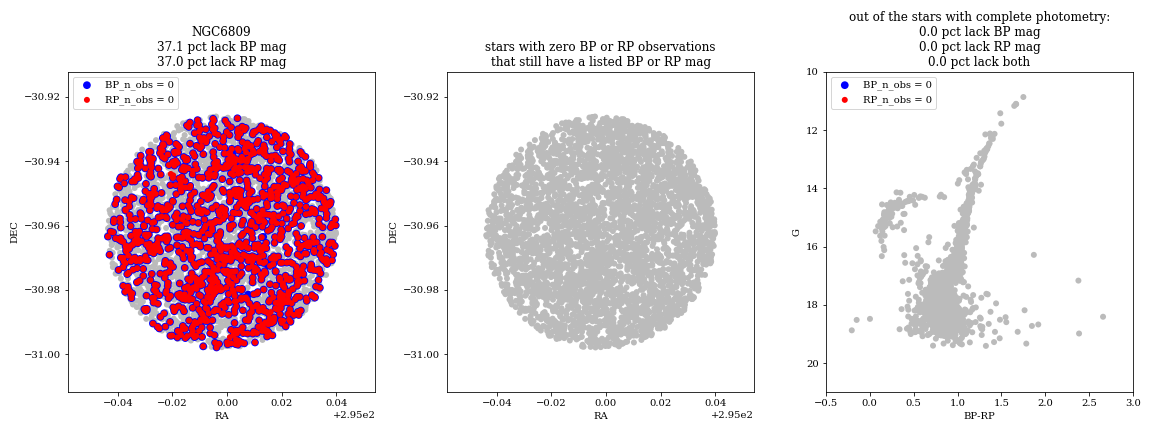
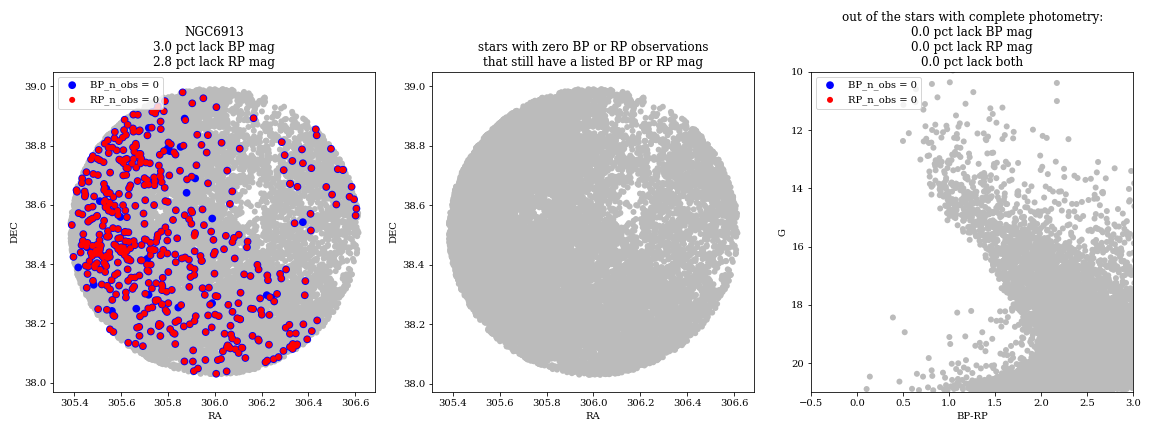
It should be mentioned that the completeness of the astrometry only is generally higher. This is not an issue, but a feature of the data that depends on the processing. In globular clusters a percentage of about 20%-30% of stars have astrometry, but do not have colour. In NGC 6809 the percentage if of 37% (see Figure 14.82). Open clusters are more favourable cases. In general the percentage of stars missing is of the order of 1%-3% (see Figure 14.83). Some artefacts on the completeness showing the effect of the scanning law are visible (see Figure 14.83), but the number of cases is reduced in comparison to Gaia DR2.