14.7.4 Astrophysical Parameter Validation: GSP-Phot
The results of the validation using clusters can be found in Gaia DR3 accompanying papers and in Chapter 11. Here we point out a few issues.
mh_gspphot
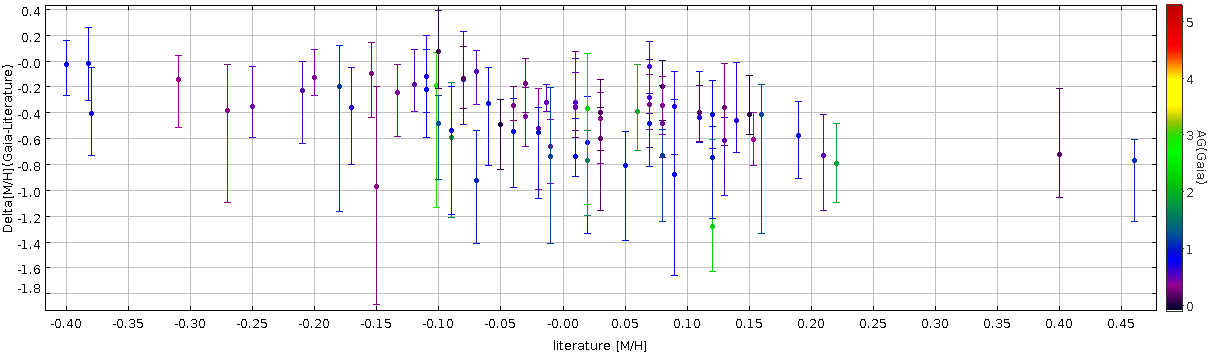
We compare for each cluster the median mh_gspphot distribution with literature values for open clusters (various sources). No calibration is applied to the output of GSP-Phot.
The main results are:
-
•
A zero point systematics of (median, , ) is found. A large scatter is present
-
•
The difference increases going towards supersolar metallicities (see Figure 14.92
distance_gspphot
We compare for each cluster the distance distribution with literature distances. The main results are:
-
•
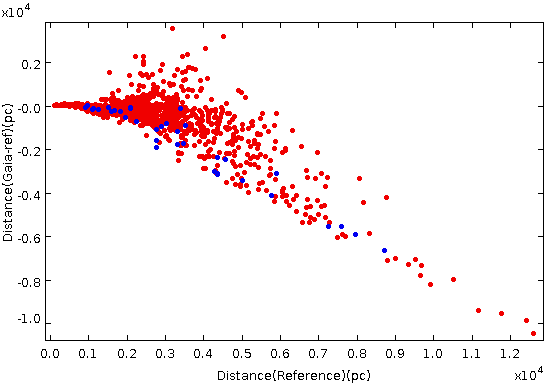
The distribution of the distances is within one sigma for clusters inside 1-2 kpc, while it is skewed towards overestimated distances for distant clusters. The median distance_gspphot of the stars in each clusters is compared with the cluster distances derived by Cantat-Gaudin et al. (2020) based on Gaia DR2 data using maximum likelihood. The zero point on parallaxes is included.
-
•
to test the dependency on the reference data and on Gaia DR2 data, we used distances form the Kharchenko Catalog and the BOCCE project Catalog (Bragaglia and Tosi 2006; Cantat-Gaudin et al. 2018). Both include only photometric distances, derived from CMD fits. The trend is still present, i.e. it is not dependent on Gaia DR2 distances (see Figure 14.93.
-
•
Systematics are present. Results for hotter stars and giants have larger overestimation
-
•
The uncertainties are under-estimated.
Absolute magnitude, mg_gspphot
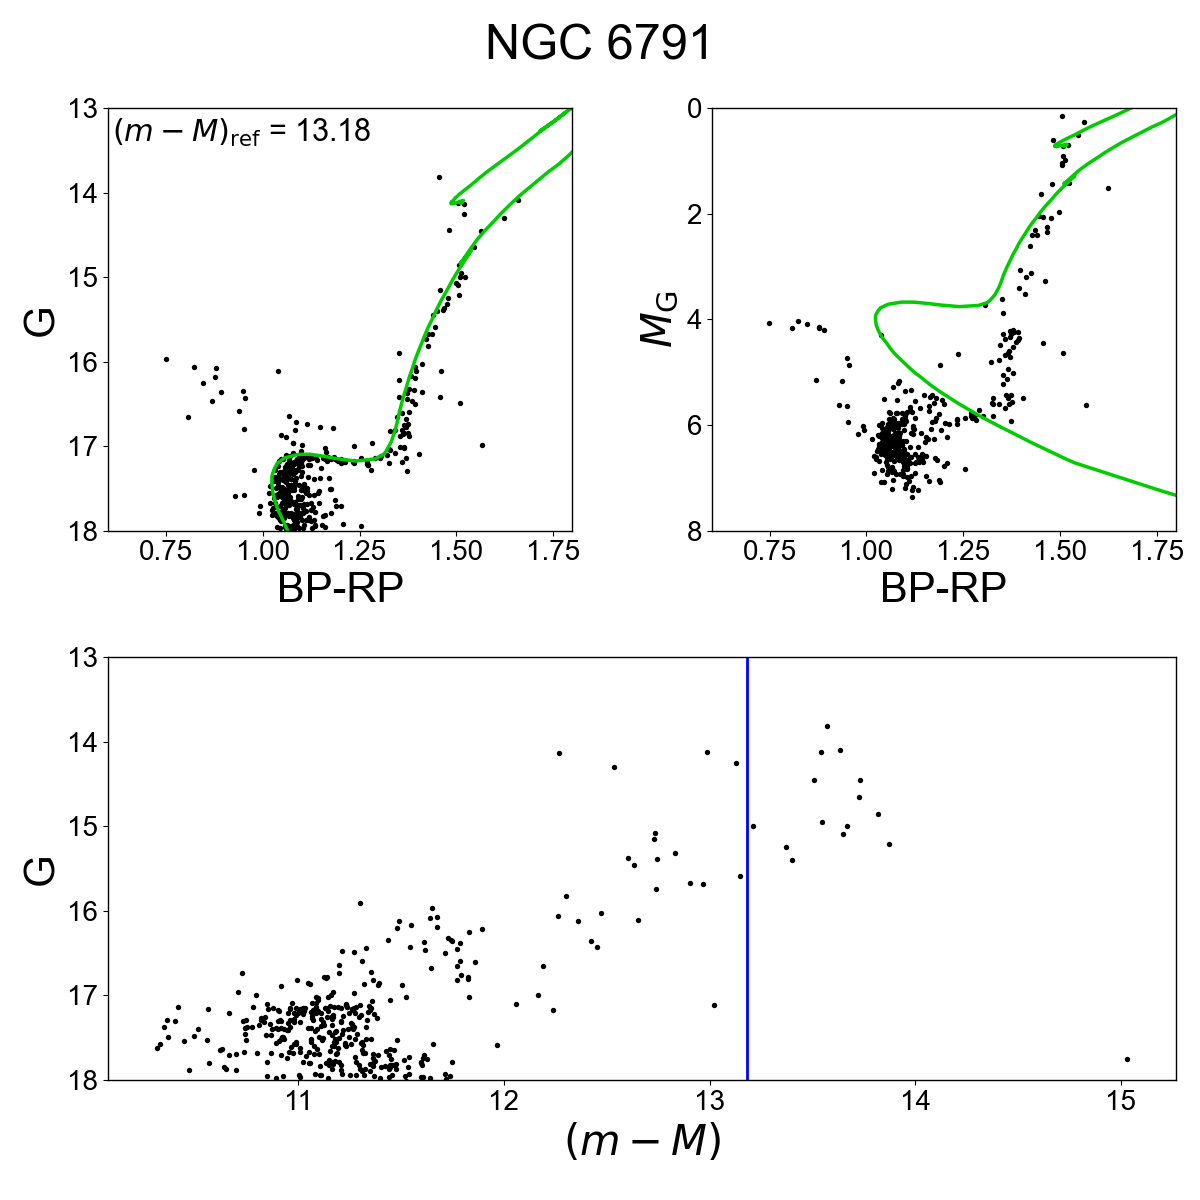
As a consequence of the wrong estimate of the distances, mg_gspphot is not correct for distant objects (see Figure 14.94).
GSP-Phot MCMC sample validation
We tested the MCMC GSP-Phot chains for a sample of 23 nearby open clusters, plotting the distribution of the chains star by star for the parameters; , , , , distance, and MG. The results are compared with the isochrones to verify the convergence of the chains. The test-sample of clusters chosen are located at various distances up to 5 kpc and they are in a range of age from 30 Myr to 8 Gyr, around solar metallicity ([Fe/H]), plus a cluster (NGC 6791) with [Fe/H]=0.4. The MCMC can be divided in 2 types based on the length of their chains: 2000 points and 100 points. Nevertheless, for the 100 case, it was also computed 2000p chains, but only the last 100p are reported. (It has to be noticed that the order of the points in the files is inverted, therefore the first row corresponds to the last point of the chain, and therefore the last 100 points are in fact the first 100..
Test on the parameter convergence
We plot all the points in the MCMC chain for stars having 2000p to verify the convergence. In the case of 100p, those are the last points of the chains, and it is not possible to verify if there was convergence. We found for 90% of the chains (245 out of 271) convergence in all the parameters (NB: we also count as converged a large number of chains where the convergence was reached before the last 100p in 1 or more parameters). In the case of 24 chains the threshold of has been reached (limited imposed), but they were counted as converged. Nevertheless few cases were counted as not converged and have to be reported:
-
•
7 hit the lower grid border of [M/H] of
-
•
1 hits the upper grid border of [M/H] of 0.8
-
•
2 hit a border within [M/H] (e.g [M/H]=, 0.0, etc…)
-
•
3 hit a border in or within the range of the permitted value (no known grid border)
-
•
8 chains did not reach convergence for 1 (despite [M/H]) or more of parameters.
-
•
5 chains show multiple solutions.
Figure 14.95 shows a case of multiple solutions (local maxima of the likelihoods).
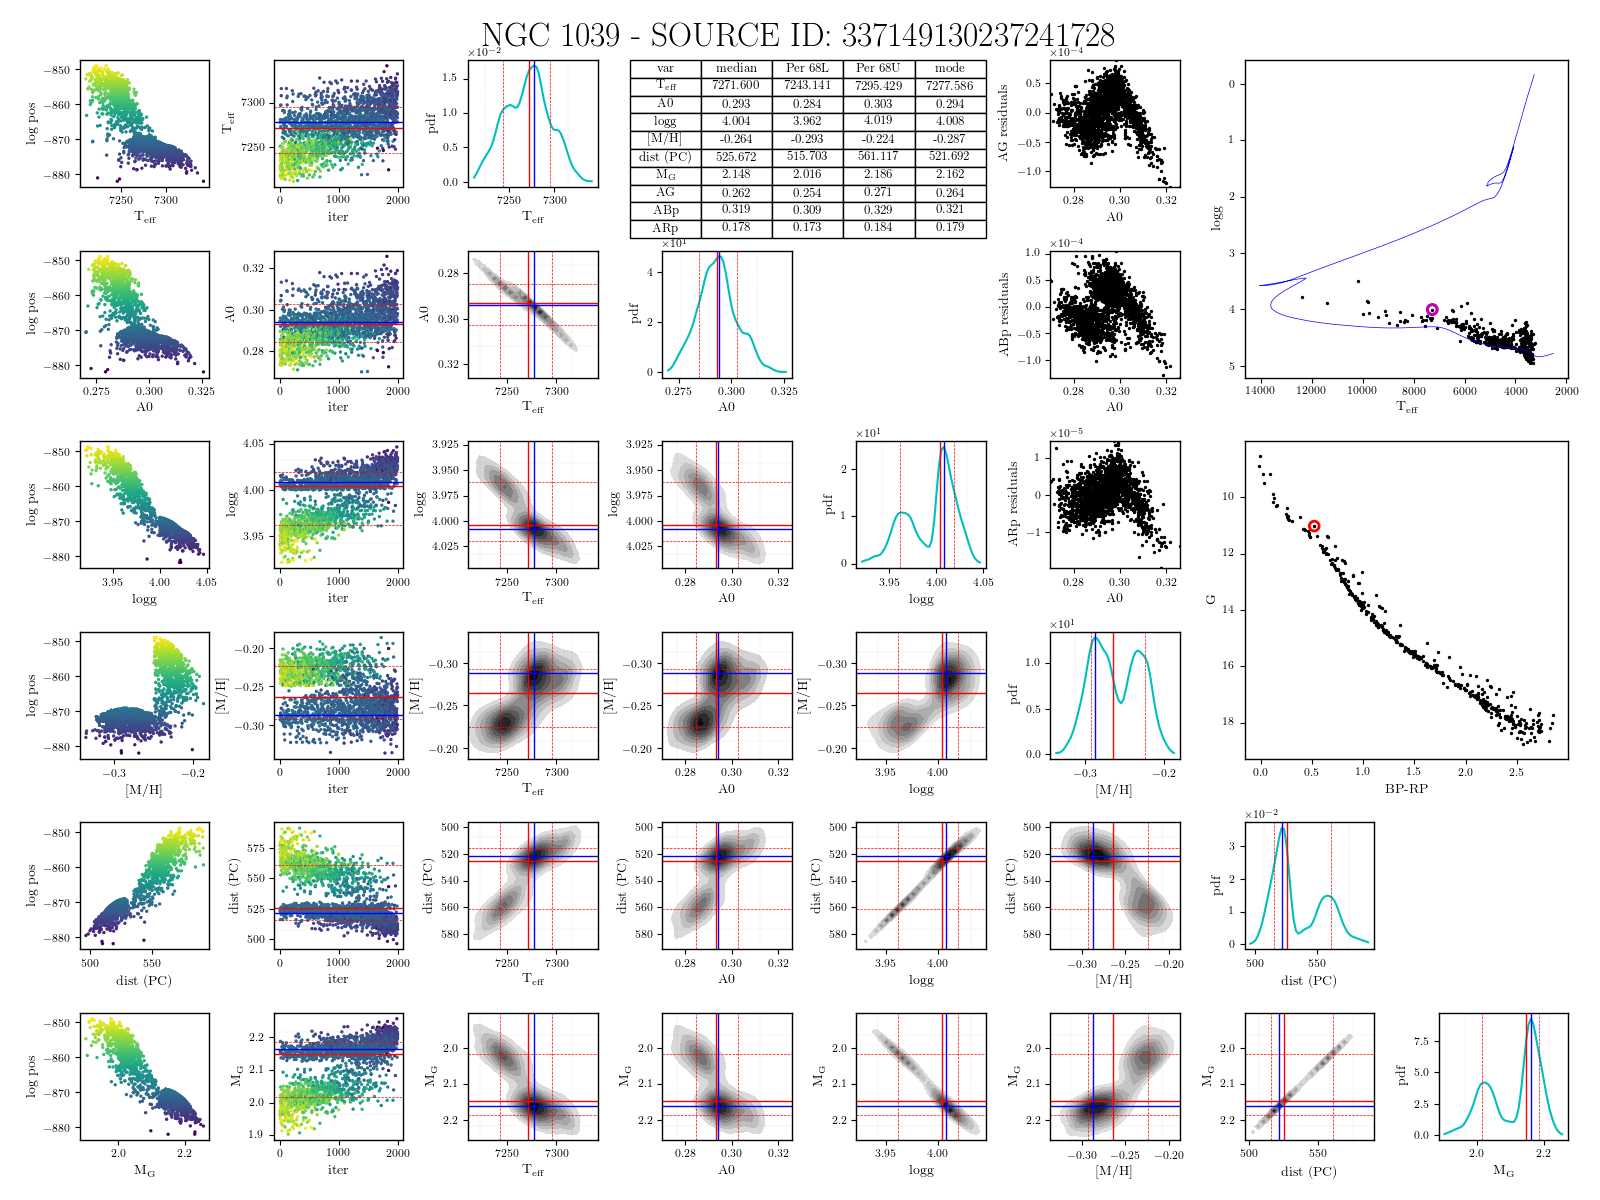