6.4.7 Single-transit analysis
The purpose of STA is to derive the spectroscopic radial velocity of the observed sources, from the three spectra observed quasi-simultaneously in each transit; it relies on the principle that this velocity corresponds to the extremum of a so-called C-function, i.e. a function which measures the (dis)similarity between the observed spectrum and a template. It is assumed that the spectra are either single-lined or double-lined: more complex possibilities are ignored because the need for automation in the RVS context precludes their meaningful treatment. The algorithms to perform STA are explained in detail by Sartoretti et al. (2018).
In an ideal case, STA could derive both the projected rotational velocity () and the Doppler shift of the spectrum if it is single-lined, or the respective -values and Doppler shifts of the two spectrum components, as well as their brightness ratio, if it is double-lined. However, for Gaia DR2 the measurement of rotational broadening for single-lined spectra was not yet operational and the analysis of double-lined spectra was used only to ascertain their composite nature since Gaia DR2 is strictly limited to single-lined spectra. Furthermore, sources exhibiting strong emission lines were identified but, for lack of suitable templates, no attempt was made to measure their radial velocity. Finally, the STA results are not published directly: only the median radial velocity for each source, derived in the multi-transit analysis (MTA) part is published in this first release of spectroscopic data. The single-transit data will be published in Gaia DR4, together with the other Gaia epoch data.
STA architecture
For convenience, Figure 6.5 reproduces here Figure 9 from Sartoretti et al. (2018), which presents a flowchart of the modules that constitute the STA chain. The main inputs to the chain are the wavelength-calibrated, normalized observed spectra and the synthetic spectrum (Section 6.2.3) that corresponds to the astrophysical parameters assigned to the source at hand. From the latter, the module GenerateTemplate (Section 6.4.7) produces a template which is specific for each observed spectrum; this template is normalized in the same way as the observed spectra (cf. Section 6.4.4).
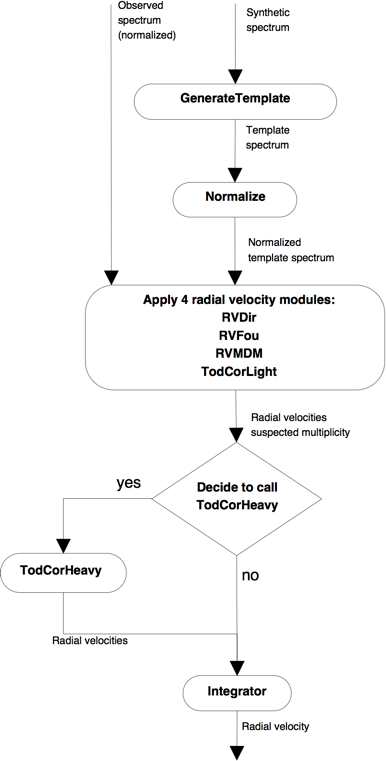
Under the assumption that the spectra are single-lined, the actual Doppler-shift measurement follows a multi-method strategy (David et al. 2014) involving standard cross-correlation using Fourier transforms, Pearson correlation, and a minimum distance method, implemented respectively by the modules RVFou, RVDir and RVMDM. The methods differ essentially by the choice of a C-function and by the algorithm for centroiding the C-function’s extremum. In principle each module produces a single Doppler-shift value per transit, along with an internal-uncertainty estimate; these values generally differ somewhat because the effects of noise depend on the method.
Otherwise, assuming that the spectra have two components, STA uses a hybrid method (two-dimensional cross-correlation as proposed by Zucker and Mazeh (1994) followed by minimisation) designed so that it delivers not only the respective Doppler shifts and the brightness ratio of the presumed components, but also an estimate of their rotational broadening and an uncertainty estimate for all values returned; additionally the algorithm fits a single-lined model to the same data and applies an F-test on the values to decide whether it should in fact be rejected in favour of the composite one.
Since there is no a priori information on the nature of a presumed secondary component, many possibilities need to be considered; to reduce the resulting computational load, first a simplified version of the algorithm is applied to each observed spectrum. This is implemented by the module TodCorLight which assumes that both components have the same spectral type and rotational broadening and which sets a relatively low threshold in the F-test. Only the spectra which then emerge as suspected multiple, are subsequently handled by the module TodCorHeavy which explores other spectral types and which rejects the single-lined model only with 99.9 % confidence.
Finally the module Integrator combines the above results for storage in the main database, taking account of the several flags (cf. Section 6.4.7) which may have been set in previous processing steps. If the single-lined model was not rejected, the median of the Doppler shifts obtained by the modules RVFou, RVDir and RVMDM respectively, is stored as the Spectroscopic Radial Velocity (SRV), the corresponding internal uncertainties being propagated accordingly. Otherwise these measurements are ignored and the results from TodCorHeavy are stored instead.
Combining information from several CCDs
The spectra from different CCDs in a transit may exhibit small differences in wavelength zero point, wavelength range, and sampling which means that they cannot be simply summed if one needs to combine their information. Therefore all modules discussed above expect three spectra in a transit (though they can handle the case where one or even two of these are missing). They first perform their measurements on each spectrum separately, storing the C-functions used in that process; subsequently they combine these C-functions on a common velocity grid (see Sartoretti et al. 2018) to use the information from the whole transit. Only the latter results are propagated along the STA chain while the single-spectrum measurements are used for internal diagnostic purposes.
Generate template
In principle the GenerateTemplate module first convolves the synthetic spectrum (Section 6.2.3) with a rotational profile (Gray 2005), but at the start of the STA chain the projected rotational velocity is not known so this capability is bypassed here. Next, the spectrum is convolved with the instrumental profile (LSF-AL, Section 6.3.5). The result is resampled to a wavelength step of 0.00747 nm, which is 10 times finer than the nominal resolution element of the RVS. The template is thus oversampled to facilitate the subsequent shifting–, convolution– and resampling operations performed by the STA modules.
The wavelength range of the template grid is 843–873 nm. This is slightly larger than the one of the object spectrum to ensure that the template, shifted within the RVS velocity range km s can be resampled on the wavelength grid of the object spectrum without loss.
Flagging
In the course of STA, several boolean flags are used to signal particular problems with or characteristics of each transit:
-
•
isValid (default=1) is set to 0 by any of the modules mentioned above, if a computational problem is encountered which renders the output of the module meaningless (e.g. division by zero, lack of convergence in an iteration, etc.);
-
•
isAmbiguous (default=0) is set to 1 by the modules RVDir, RVFou, RVMDM or by TodCorLight, to indicate that a transit is too noisy to allow a Doppler-shift measurement whose uncertainty is correctly described by the internal uncertainty estimate; such transits may nevertheless contribute meaningful information to MTA;
-
•
suspectedMultiple (default=0) is set to 1 by TodCorLight if a double-lined model fits the observed spectrum significantly better than a single-lined one.