1.3.3 Spacecraft status
Author(s): Jos de Bruijne, Gonzalo Gracia-Abril, Neil Cheek, Cian Crowley, Claus Fabricius, Juanma Martín-Fleitas, Alex Hutton, Alcione Mora
This section describes the evolution of the spacecraft status over the time interval underlying Gaia DR3, including the video-processing and payload data-handling units as well as the optics. The status and evolution of the focal-plane assembly is provided in Section 1.3.4.
Major anomalies and special operations
For the time interval covering Gaia DR3 (see Table 1.8), the spacecraft sub-system configuration consists of the nominal units on the so-called A-chain, with the exception of the micro-propulsion sub-system (MPS). The latter was switched to the redundant unit on the B-chain in a spacecraft-safe-mode recovery. This safe mode was triggered by a spurious performance change of MPS Thruster 3 on the A-chain on 17 July 2014 (before the start of the nominal mission). After testing of both MPS chains (which both performed nominally), the decision was made to permanently use the B-chain of the MPS. See Gaia Collaboration et al. (2016b) for more details.
During the time interval covering Gaia DR3, the Gaia spacecraft suffered several ‘normal’, non-critical anomalies:
-
•
The phased-array antenna (PAA) was switched off autonomously by the on-board failure detection, isolation, and recovery (FDIR) six times, on 16 December 2014 (OBMT 1653.9), 27 January 2015 (OBMT 1821.0), 30 September 2016 (OBMT 4271.8), 21 November 2016 (OBMT 4477.4), 29 November 2016 (OBMT 4512.5), and 8 December 2016 (OBMT 4545.1), and was recovered successfully in all instances. All occurrences led to significant temperature fluctuations of the payload which affected the (stability of the) basic angle in particular.
-
•
The PDHU memory controller was switched off autonomously four times, on 5 April 2015 (OBMT 2094.0), 29 April 2015 (OBMT 2192.3), 29 November 2015 (OBMT 3045.1), and 12 August 2016 (OBMT 4074.8), and was recovered successfully on all occasions, albeit at the expense of a loss of a limited amount of science data.
-
•
On 29 October 2015 (OBMT 2922.1), the attitude control system autonomously switched over from using star tracker 1 (STR-1) to using star tracker 2 (STR-2). Recovery took place on the same day. On 20 April 2017 (OBMT 5078.6), the STR-1 catalogue was updated by disabling three objects that had faint, non-catalogued neighbours that were biasing the measurements.
Numerous video-processing unit (VPU) resets have been experienced during the early part of the mission. The thermal effect of having the associated row of CCDs automatically switched off was mitigated to a large extent with the introduction (on 18 September 2014) of an automatic recovery action on-board. The current version of the VPU application software (ASW), which was deployed in the period 24–28 April 2015 (OBMT 2170.7–2185.8) on the seven VPUs followed by a two-week commissioning campaign, is version 2.8. No further VPU resets have occurred since this update.
On 12 September 2014 (OBMT 1272.6), the spacecraft was struck by a solar flare with class X1.6. Although neither spacecraft operations nor science data collection were impacted, the detectors in the focal plane encountered a (non-reversible) step change in the accumulated radiation damage (Section 1.3.4).
During December 2014, the Mission Operations Centre (MOC; Section 1.1.5) introduced open-loop ground automation (i.e., periods during which Gaia transmits science data to the ground stations without any intervention from MOC staff) as well as extra ground-station bookings to allow for increased science-data down-link. The science-data return to ground was thereby increased along with the minimisation of data latency for the photometric and Solar-system science-alert projects.
A Lunar transit, with 0.4% of the Sun’s disk obscured, occurred on 11 November 2014 (OBMT 1515). The event was visible in multiple sub-systems on the spacecraft (i.e., temperatures, MPS reaction to Solar radiation pressure, etc.). Similar, but larger events took place on 6 November 2015 (5.0% obscuration, OBMT 2954), 27 April 2016 (6.0% obscuration, OBMT 3646), and 1 May 2016 (5.5% obscuration, OBMT 3663).
On 1 July 2015 (OBMT 2440.6), a leap second was introduced in the various mission planning and control software products.
The maintenance of the desired orbit around the L2 Lagrange point requires dedicated spacecraft manoeuvres, commonly referred to as station-keeping manoeuvres (SKMs). The typical of these events is 38 cm s. Table 1.10 lists the 18 manoeuvres that have been executed during the time interval covering Gaia DR3.
| Manoeuvre number | Date | OBMT |
| 9 | 25-07-2014 | 1078.1 |
| 10a | 21-08-2014 | 1185.2 |
| 10b | 22-08-2014 | 1189.2 |
| 11 | 09-09-2014 | 1261.4 |
| 12 | 09-10-2014 | 1380.8 |
| 13 | 07-11-2014 | 1498.0 |
| 14 | 04-12-2014 | 1606.5 |
| 15 | 14-01-2015 | 1770.0 |
| 16 | 06-04-2015 | 2099.2 |
| 17 | 13-05-2015 | 2246.6 |
| 18 | 15-07-2015 | 2499.5 |
| 19 | 16-09-2015 | 2751.3 |
| 20 | 20-01-2016 | 3254.1 |
| 21 | 01-04-2016 | 3542.1 |
| 22 | 27-07-2016 | 4009.7 |
| 23 | 28-09-2016 | 4263.5 |
| 24 | 01-11-2016 | 4399.1 |
| 25 | 28-12-2016 | 4626.9 |
| 26 | 20-04-2017 | 5078.6 |
Payload decontamination operations were performed on 23 September 2014 (OBMT 1317.3), 3 June 2015 (OBMT 2330.8), and 22 August 2016 (OBMT 4112.8), all scheduled after ice build-up on the optics had progressed beyond acceptable levels. For more details, see Section 1.3.3 and Gaia Collaboration et al. (2016b).
Following the first two decontaminations, small movements of the M2 mirrors were performed to improve the focus of the following field-of-view on 24 October 2014 (OBMT 1444.0) and the preceding field-of-view on 3 August 2015 (OBMT 2574.7). For more details, see Section 1.3.3 and Gaia Collaboration et al. (2016b).
Table 1.11 summarises the decontamination and re-focus operations that have been executed during the time interval covering Gaia DR3.
| Date | OBMT | Event |
| 23-09-2014 | 1317.3 | Decontamination run 4 |
| 24-10-2014 | 1444.0 | Re-focus following field-of-view |
| 03-06-2015 | 2330.8 | Decontamination run 5 |
| 03-08-2015 | 2574.7 | Re-focus preceding field-of-view |
| 22-08-2016 | 4112.8 | Decontamination run 6 |
Straylight
In general, straylight – or scattered light – in the focal plane can arise from Solar-system sources such as the Sun and Moon, from bright stars, from the (integrated light of the) Galaxy as a whole, and from internal sources such as the BAM laser, which has a wavelength of 850 nm, i.e., within the RVS bandpass. For Gaia, the principal (predicted) external sources of straylight are the Sun, Earth, and Moon. To prevent light from these bodies reaching the telescope apertures through direct paths, the sunshield of the spacecraft (Figure 1.7) has a circular, double-layered structure. The second layer seen from the Sun is slightly smaller in diameter so that it intercepts the diffracted flux from the perimeter of the first, sunward layer. Inside the payload module, baffling has been applied to limit straylight, with the arrangement of the folded telescope beams (Figure 1.1) acting as severe constraint.
As explained in Gaia Collaboration et al. (2016b), it was discovered soon after payload switch on that actual straylight levels are some one to two orders of magnitude higher than expected and are modulated with the six-hour spacecraft rotation period. The origin of this straylight has been traced back:
-
1.
foremost to sunlight scattering into the apertures through outward-protruding (bundles of) Nomex fibres which are present at the perimeter of the foldable sunshield blankets – which do not have a kapton-tape finishing – that are present between each pair of ‘fixed’ sunshield frames;
-
2.
secondly to the Milky Way’s integrated brightness combined with extremely bright stars and planets, the light of which can reach the focal plane through a few (unintentionally) unbaffled straylight paths.
Although the increased background levels themselves can be dealt with in the data processing, the associated noise does negatively impact the performance of faint objects, in particular in the spectroscopic instrument which operates at very low signal levels. In fact, for the faintest stars in RVS, the Poisson noise on the background now dominates the noise budget, exceeding that of the readout noise. Therefore, a partial mitigation was implemented in the RVS windowing strategy implemented in VPU application software version 2.8, deployed in orbit towards the end of April 2015 (Section 1.3.3). This software update allows adaptively adjusting the across-scan size of the windows to the instantaneous straylight level to increase the signal-to-noise ratio of the spectra (Cropper et al. 2018). In addition, the RVS object selection was modified to continuously adapt the faint selection limit in RVS to the instantaneous background level, which does not directly mitigate the straylight but optimises the overall information content and science quality of the spectroscopic data acquired on board and downlinked to ground (Section 1.1.3).
Focus
Although the focus of both Gaia telescopes has been optimised during commissioning, the image quality shows significant time evolution. As recognition of the direct impact of the focus of the telescopes on the mission performance (astrometric precision and spectral resolution), the first-look pipeline (Section 3.5.2) provides a suite of diagnostics to monitor the image quality on a daily basis. The astrometric (centroiding) precision is the most sensitive parameter and can be quantified via the Cramér-Rao metric (or bound), as explained in Lindegren (1978, 2010):
| (1.2) |
where is the maximum precision (minimum uncertainty) of the estimate of the along-scan centroid for a given star observed in a window with along-scan samples, labelled , on a given CCD transit (that is, the along-scan astrometric information contained in an individual image), is the total number of electrons for an ‘infinite-size’ window, is the normalised point-spread function (PSF) multiplied by (that is, the number of electrons collected from the star for each pixel ), is the derivative of with respect to the along-scan pixel coordinate , is the root-mean-square (RMS) readout noise (in electrons), and is the sky background (in electrons), which is assumed to be spatially homogeneous. This equation can be used to estimate how close in performance any given point- or line-spread-function centroiding method is to the maximum, theoretical performance based on fundamental information theory.
Unfortunately, usage of Equation 1.2 to estimate the absolute Cramér-Rao bound requires the availability of a detailed characterisation of the payload and actually of each star, including having a library of oversampled point-spread functions with colour and across-scan-motion dependence (Section 1.1.4). This makes Equation 1.2 unsuitable for quick estimates and daily monitoring.
For bright stars, however, relative Cramér-Rao measurements are much simpler:
| (1.3) |
where is a normalised metric which is independent of the actual stellar flux for bright stars for which the Poisson noise dominates (). For these objects, can be approximated by using just the actual, ‘raw’ sample values and their finite differences for . An average value can thus be provided and used for continuous payload health checks. This approximate method provides relative and not absolute measurements and is affected by additional effects such as stellar colour, across-scan motion, and/or sub-pixel position. However, its simplicity provides a useful proxy to monitor the overall focus evolution of both telescopes and allows to decide whether and to predict when a re-focus is needed.
Figure 1.12 shows the history of the relative astrometric image quality for each field of view averaged over all CCDs throughout the mission, estimated through Equation 1.3 using all unsaturated, non-TDI-gated, class-0 observations (i.e., mag; Table 1.2 and Figure 1.3). Although the focus has never been completely stable, the relative Cramér-Rao bound values are always close to and mostly below unity, as expected for good-quality, near-diffraction-limited telescopes. Sharp discontinuities are introduced by payload decontaminations (Section 1.3.3 and Table 1.11) and these operations always recover (part of) the optical quality. However, fine adjustments (re-focussing) have sometimes been applied following decontaminations (Section 1.3.3 and Table 1.11). Figure 1.12 shows that the degradation slope is becoming smaller with time, confirming that the payload is becoming increasingly more and more stable as the mission progresses.
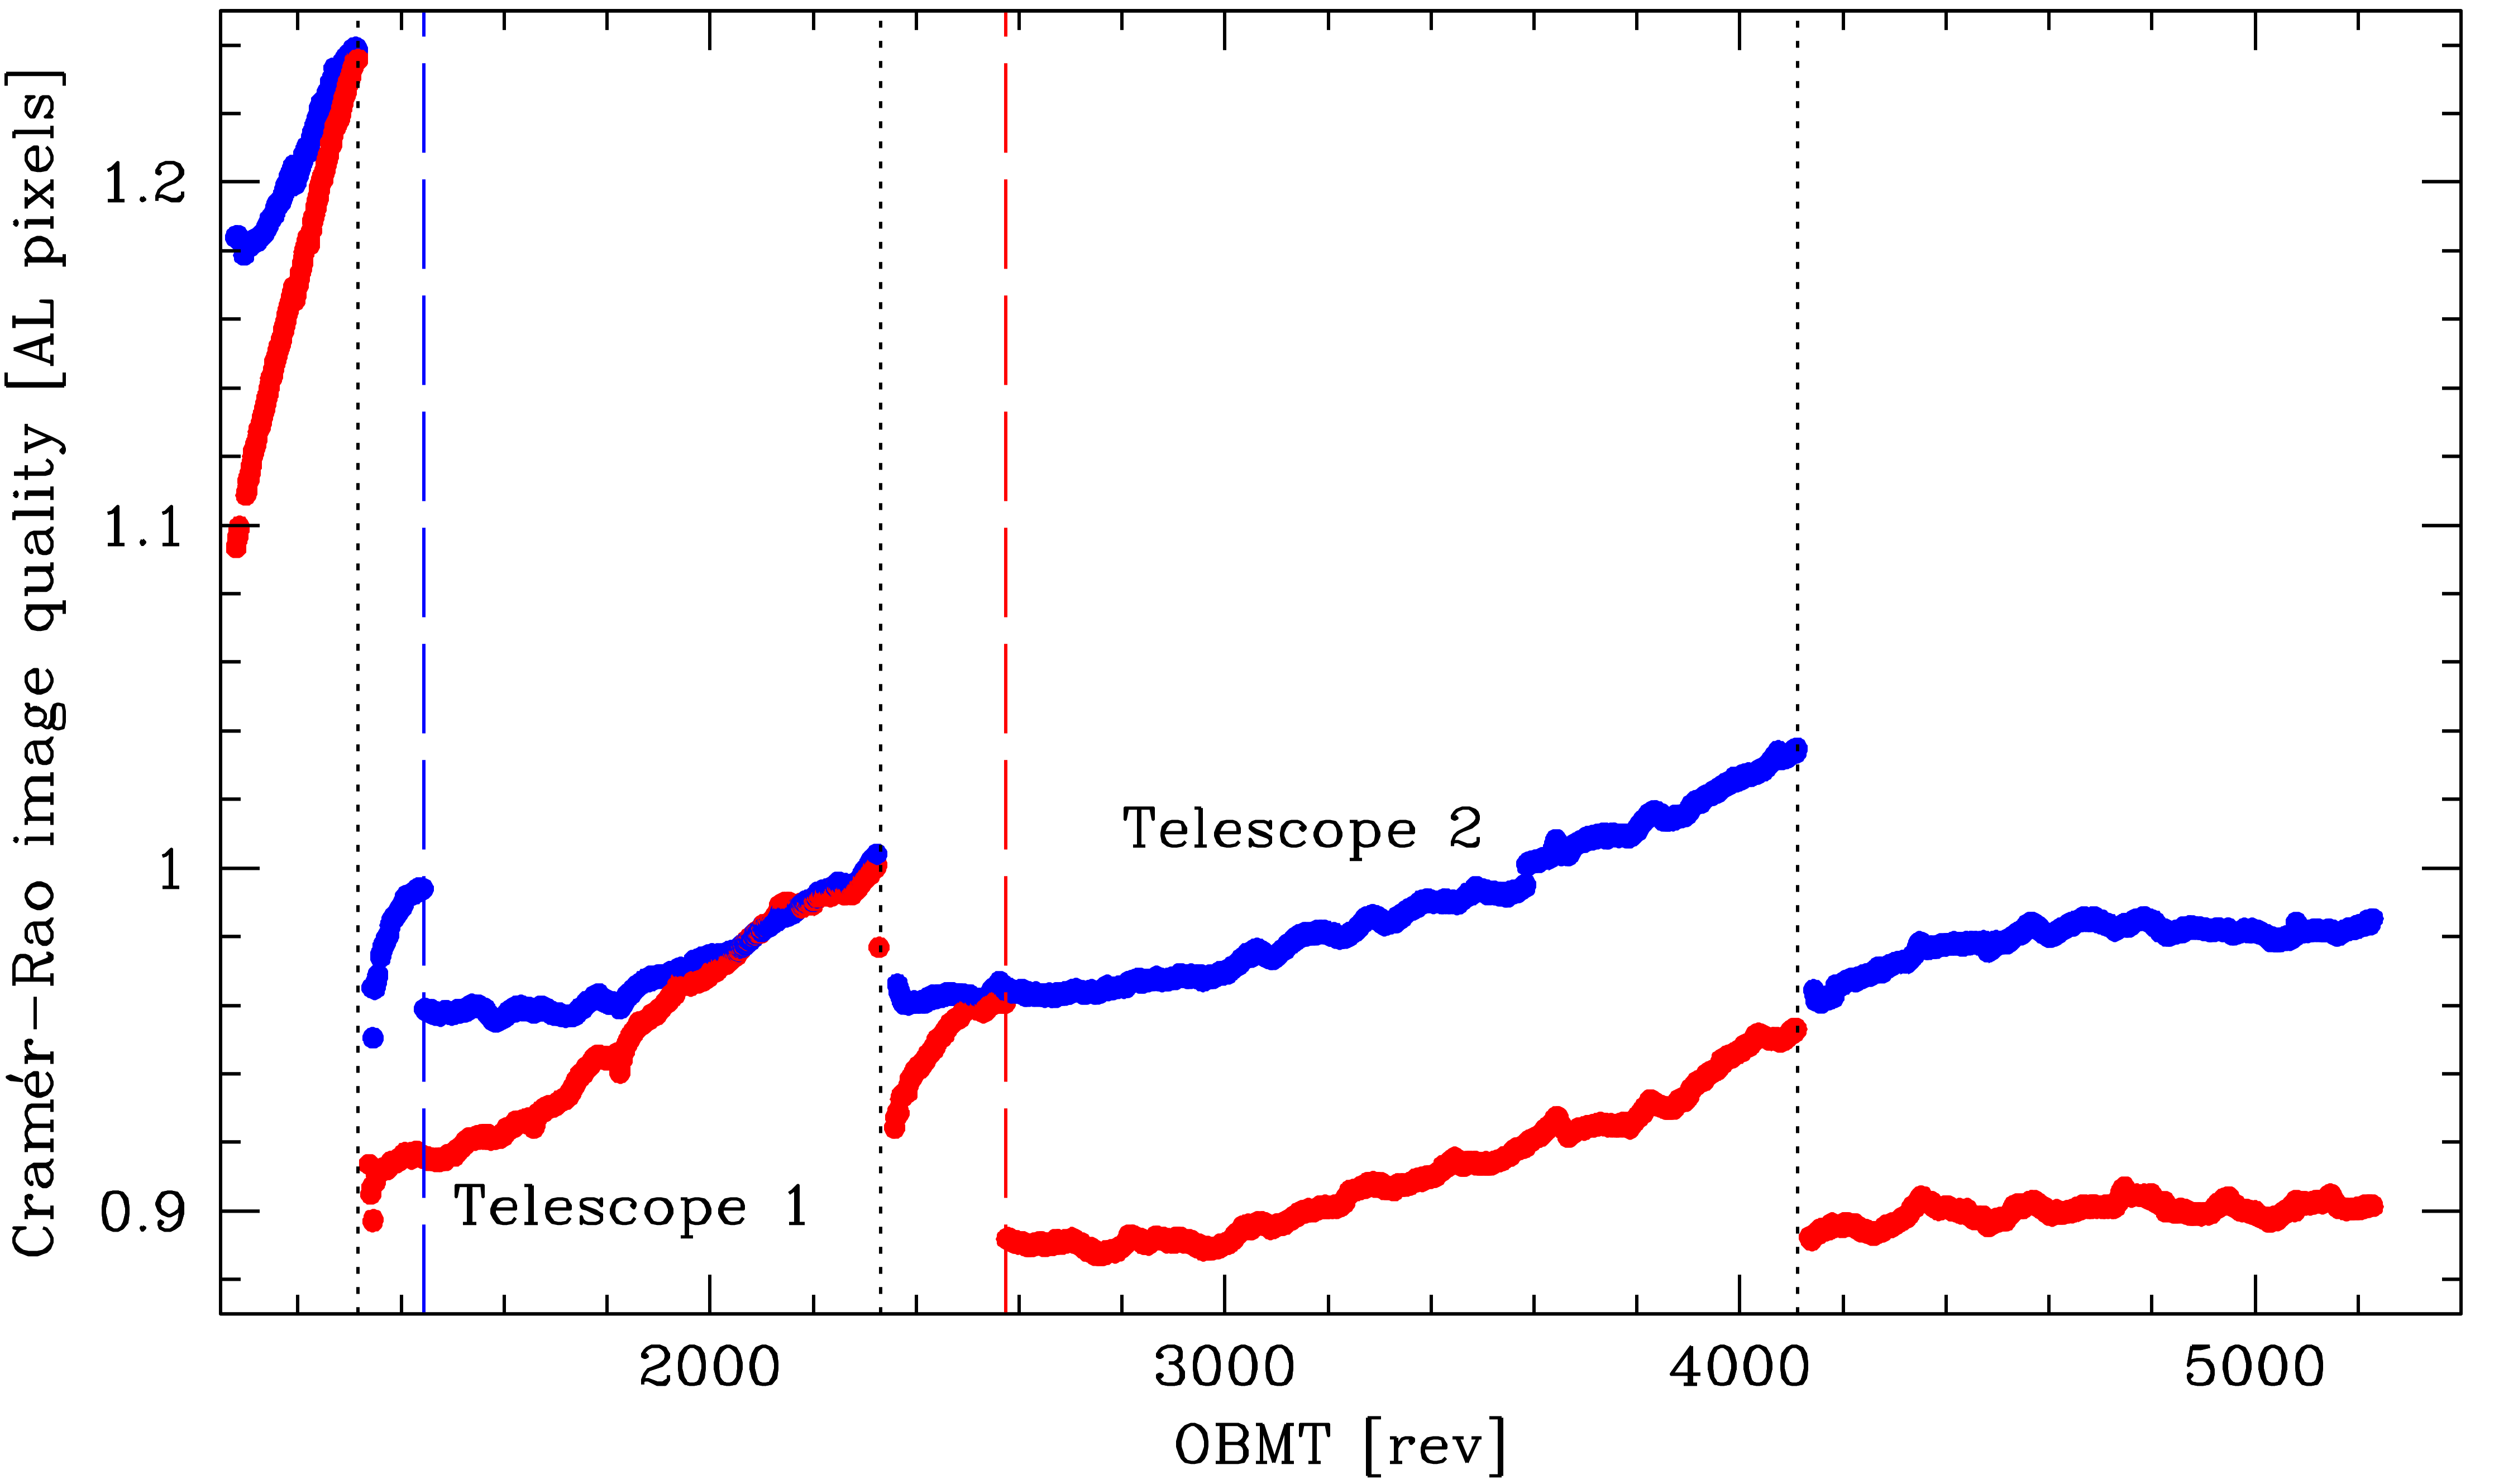
The relative astrometric image quality for each CCD and field of view, as estimated during a typical day, is shown in Figure 1.13. The field-of-view dependence of the astrometric quality is apparent, as are variations over the field-of-view for a given telescope. Such variations are expected for the large field-of-view covered by Gaia. Optimum image-quality values are typically achieved in CCD strips AF5–AF8.

Transmission and decontamination
As explained in Gaia Collaboration et al. (2016b), Gaia’s optics suffer from a time-variable transmission degradation as a result of continuous contamination by water ice (see Figure 1.14). The transmission loss is wavelength-dependent and more severe at short wavelengths, and hence different in the different instruments, and also varies with detector position in the focal plane within a given instrument. In order to restore the telescope throughput, several payload decontaminations have been performed (see Table 1.11) during which the focal plane and/or selected telescope mirrors were heated in a controlled way to sublimate the contaminant and let it escape through the apertures to cold space.
A total of six decontaminations have been carried out so far (Table 1.11), three during the commissioning phase and three during the Gaia DR3 time interval. Figure 1.14 shows the temporal evolution of the transmission of both telescopes. With each subsequent decontamination, the rate of returning contamination has been observed to reduce such that the stable period without noticeable contamination build-up lasts longer and longer. This clearly indicates that the source of the contamination, suspected to be slowly-releasing trapped air (water vapour) within multi-layer-insulation blankets and/or carbon-fibre-reinforced-polymer structural parts, is slowly but steadily drying up. As a result of the significant reduction of the ice-accumulation rate, a very small number of (if any) decontaminations will still be needed in the future.
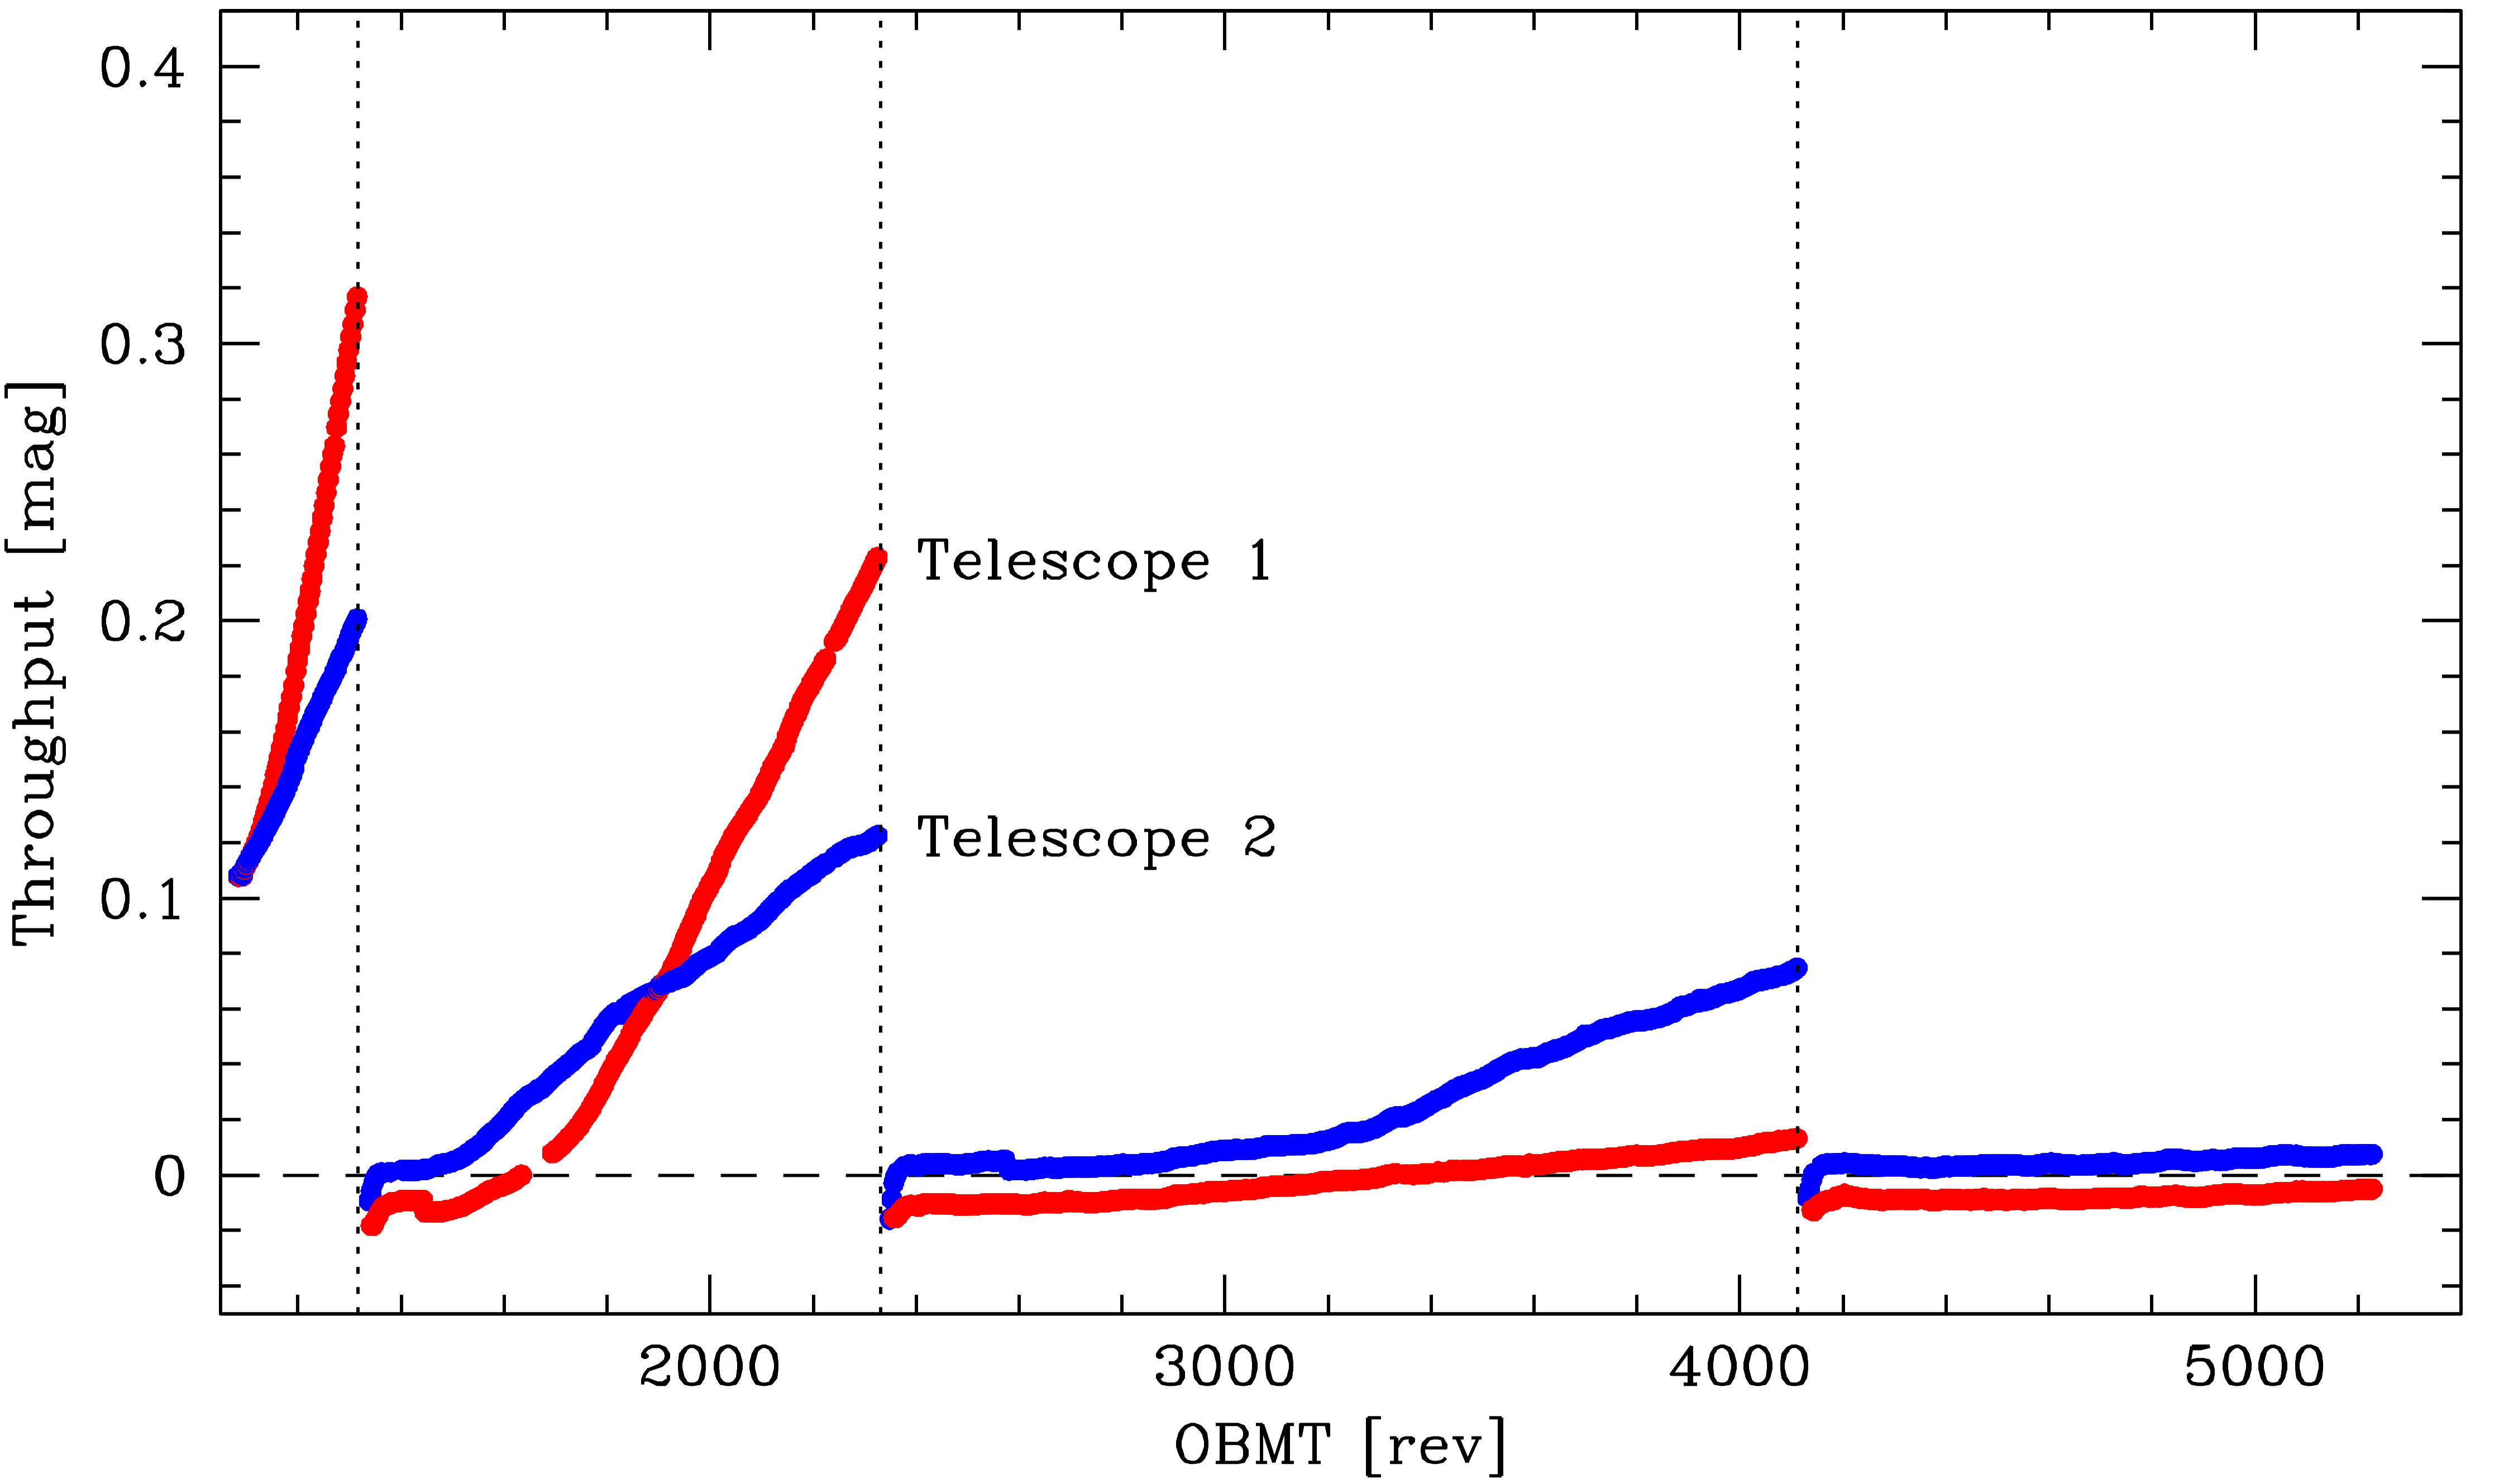
As a consequence of the response variation with time, there has been a corresponding variation in the faint magnitude limit for the Gaia observations throughout the mission. This is unavoidable since the on-board, faint-star detection limit is defined as a certain, fixed flux level expressed in electrons per CCD transit. As a result, when contamination builds up, the effective faint limit becomes progressively brighter than the nominal threshold at mag (Section 1.3.3). As shown in Figure 1.14, this effect has been limited to less than a tenth of a magnitude since the fifth decontamination that was executed on 3 June 2015 (OBMT 2330.8; so roughly one year after the start of nominal operations).
Basic-angle variations
As explained in Section 1.1.3, variations on time scales of minutes to hours of the basic angle between the lines of sight of the two telescopes are particularly harmful to Gaia’s science. Such variations are generally difficult to eliminate by self-calibration and are even fundamentally impossible to calibrate – due to a ‘near-perfect’ degeneracy with the global parallax zero point – if they are synchronised with the spacecraft spin phase (Butkevich et al. 2017). The monitoring of variations of the basic angle, by means of the basic-angle monitor (BAM) device (Section 1.1.3), has therefore been baselined since day one.
As explained in Gaia Collaboration et al. (2016b), the periodic fluctuations of the basic angle observed by the BAM already during the in-orbit commissioning phase are two orders of magnitude larger than expected based on pre-launch calculations and show a strong asymmetry between both telescopes: the line-of-sight of the preceding telescope fluctuates within a 1000 range while the other line-of-sight range is ‘only’ 200. In addition, the observed variations show a modulation with the six-hour spacecraft rotation as well as a smaller, 24-hour modulation (see below). Fluctuations are also seen on longer timescales, consistent with the change of Solar irradiance caused by the periodic change of the Gaia-Sun distance and with sun-shield ageing. In addition, fluctuations with 30 amplitude are correlated with galactic-plane crossings of the preceding telescope. The periodic variations seen in the BAM signal are strongly coupled to the heliotropic spin phase of the satellite (i.e., the phase with respect to the Sun; Section 1.3.2). In-orbit tests and experience have furthermore shown that variations disappear with a Solar-aspect angle of 0or when the spin is stopped; in the latter case, the variations reappear within minutes after restarting the spin.
So far, the following conclusions can be reached:
-
1.
The BAM data are reliable, i.e., they reflect true basic-angle variations, at least at the 10 accuracy level;
-
2.
A purely mechanical root cause of the variations can be ruled out;
-
3.
There is strong evidence for a thermo-elastic origin. In particular, the 24-hour variation originates from the central data management unit, transponders, and payload data handling unit in the service module, which have varying power dissipations and temperatures as a result of the daily downlink operations (Section 1.1.5). Also, the reaction of the preceding field-of-view to galactic-plane crossings shows a perfect, delayed correlation with thermal variations of the VPUs with a ‘coupling coefficient’ of 500 K. A sensitivity analysis campaign has been carried out in orbit, applying thermal pulses to many service- and payload-module components during one decontamination campaign. When combined with the typical, cyclic temperature changes experienced during a spacecraft revolution, a number of candidates have been identified as possible originators of the six-hour periodic basic-angle variations. They are mostly located in the sun-illuminated part of the spacecraft. However, the (probably) thermo-elastic coupling mechanism needed to efficiently and quickly transfer those perturbations to the payload module is still unclear.
In addition to the periodic variations, the BAM fringe-position data also show jumps. Their size distribution follows a power law with an exponent of . There is on average one jump per day (in either field of view) exceeding 30, although jumps are much more frequent after ‘perturbations’ such as decontamination and (re-)focusing (Table 1.11). There are roughly equal numbers of jumps affecting both fields of view at the same time, or only the preceding field, or only the following field. Large jumps show up in the astrometric residuals, allowing for the possibility that most of them are real and originating within the mechanical structure of the payload.
Video-processing-unit configuration
The video-processing units (VPUs; Section 1.1.3) assign, among others, the window size, sampling class (Table 1.2 and Figure 1.3), and observation priority to each object that is detected and confirmed for observation. The VPU algorithms (VPAs) running on each VPU are highly parametrised. The configuration of the VPU and VPA parameters, which is carefully tracked in the CDB (Section 1.2.3), determines which objects are observed. During the time interval covering Gaia DR3, the VPU application software (i.e., the VPAs) has been updated from version 2.7 to 2.8 in the period 24–28 April 2015. Version 2.8 allows enhanced flexibility in the areas of the RVS across-scan window size and RVS faint limit, the AF2–9 faint-star across-scan window size, the AF1 coarse-confirmation parametrisation, and the on-board suppression of double detections in the sky mapper.
Detection-chain-parameter settings
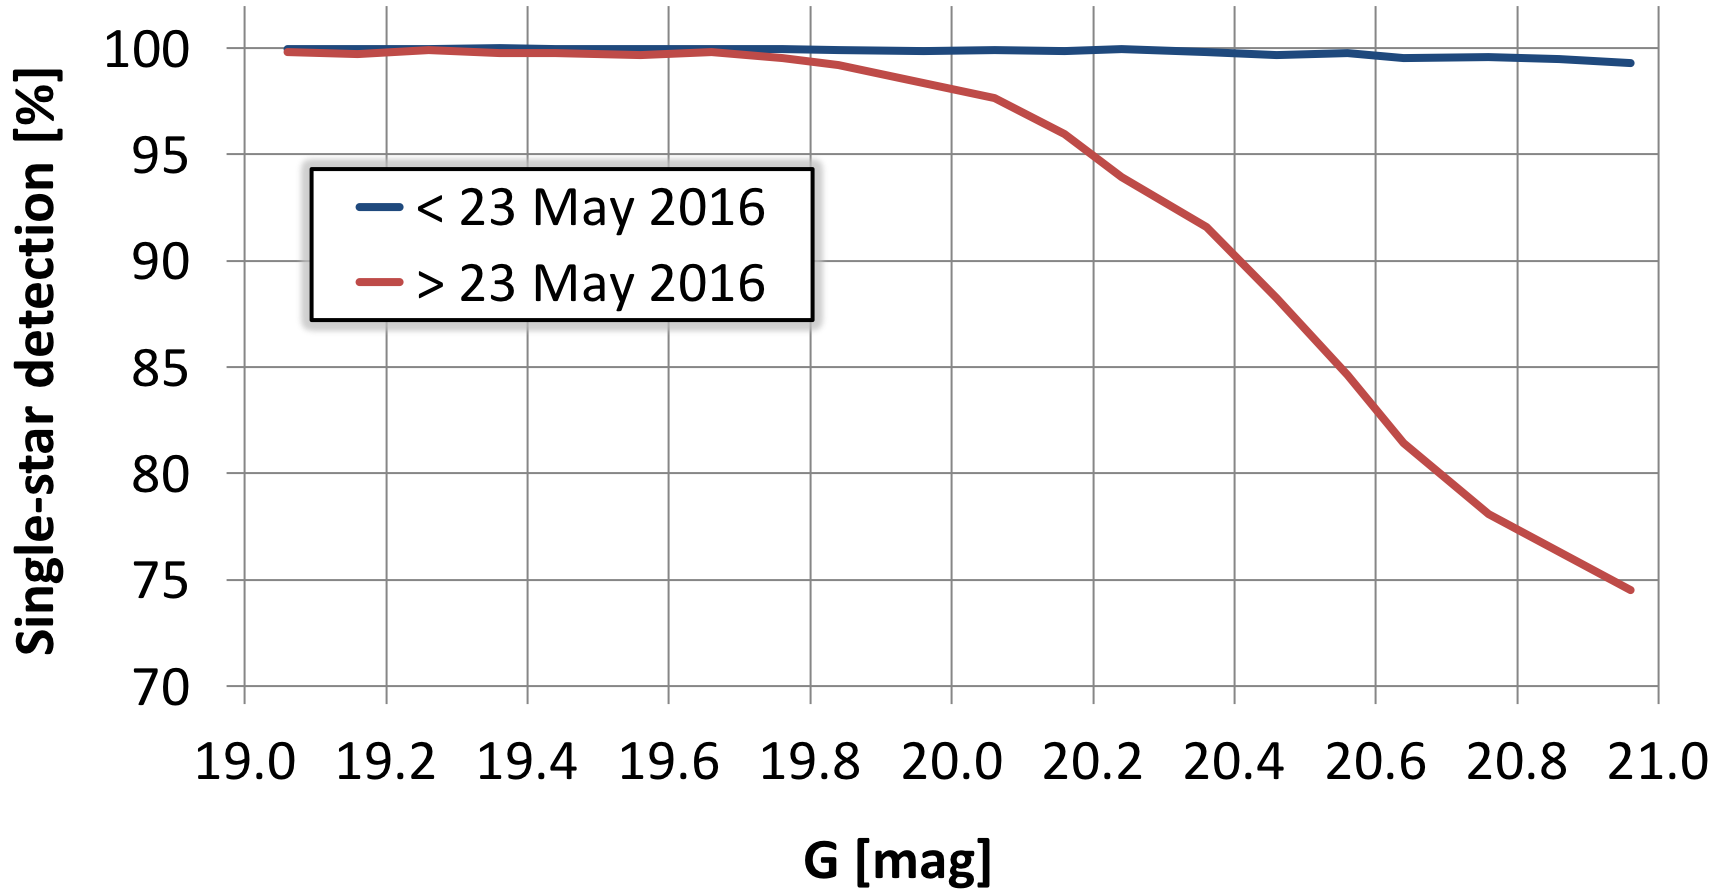
During the time interval covering Gaia DR3, several changes to the detection-parameter settings have been made. The Gaia DR3 interval – i.e., initial science operations – started off with a faint SM detection threshold defined at mag. On 15 September 2014, this threshold was lowered to mag. On 27 October 2014, this threshold was changed to its final value mag (but see Section 1.3.3 for the effect of contamination). The AF1 confirmation parameters were changed on 15 September 2014, on 27 October 2014, and on 11 May 2015. Finally, at the beginning of Segment 3 (23 May 2016; OBMT 3750.6; see Table 1.8), the low-frequency parameters of the PSF-shape filters in the detection chain (see Section 1.1.3 and de Bruijne et al. 2015) were modified to reduce the number of false detections at the expense of the detection efficiency at the faint limit (Figure 1.15).
RVS window-size and RVS faint-threshold settings
VPU software version 2.8, deployed on-board in the period 24–28 April 2015, contains four modifications aimed at partially recovering the RVS performance loss induced by the unexpectedly high levels of straylight measured in orbit (Section 1.3.3; see also Cropper et al. 2018):
- 1.
-
2.
A new VPU parameter allows windows to have stair-like shapes to allow for small across-scan tilts of the spectra. The default shape of the window is now derived from the rectangular shape by shifting each of the 12 macro-samples of the window towards positive across-scan coordinates by a user-defined offset. These offsets are a function of the RVS CCD strip, the field-of-view, and the across-scan position of the object in AF1. After testing and careful consideration, it has been decided to not use this functionality for science data collection.
-
3.
In order to optimise the signal-to-noise ratio of the data, in particular for faint stars, the faint RVS threshold is now defined by a new parameter which depends on the heliotropic phase of the spin during the six-hour revolution and on the across-scan position of the object in the CCD and focal plane. Prior to the RVS resource-allocation algorithm (Section 1.1.3), a new object filter based on the RVS magnitude has been added to preselect the candidate objects as function of the heliotropic phase of the spin, which is a good proxy for the instantaneous intensity of the straylight. During times of high straylight levels, the RVS faint limit is as bright as =15.5 mag, whereas at times of low straylight levels, it is lowered to values as faint as 16.2 mag.
-
4.
In order to avoid wasting resources on faint-star spectra collected during times of high straylight levels, the across-scan window size in RVS is now defined by a new pair of parameters which are a function of the heliotropic phase of the spin, the RVS magnitude, the field-of-view, the RVS CCD strip, the across-scan position of the object in AF1, and the across-scan smearing (i.e., the spin phase in the six-hour revolution). After testing and careful consideration, it has been decided to not use this functionality and operate with a constant across-scan window size of 10 pixels.
Both the adaptive faint threshold and the adaptive across-scan window size in RVS use the heliotropic phase of the spin as input argument. The latter is derived on-board from a simple model which requires periodic (roughly monthly) calibration and parameter updates.
Miscellaneous parameter settings
Other VPU parameter changes made during the Gaia DR3 interval include a dark-signal non-uniformity (DSNU) look-up-table update for an evolving bright column in the SM2 CCD in CCD row 4 on 16 December 2014 (Section 1.3.4), an update of the RVS across-scan centring bias and offset on 3 February 2015, a patch of the parameters defining the TDI gates in AF1 on 20 May 2015, an update of the saturation as well as the faint detection thresholds for double detections on 4 July 2015, an update of the adaptive RVS magnitude thresholds on 1 September 2015, an update of the across-scan position of the BAM window for the following telescope on 22 November 2015, an update of the TDI-gate tables for all AF CCDs on 30 August 2016, an update of the VO pattern used for monitoring and calibration of the non-uniformity on 31 August 2016 (Section 1.3.4), and an update of the TDI-gate settings for the WFS CCD on VPU-4 on 30 November 2016.
Payload-data-handling-unit configuration
The science data collected by the VPUs, i.e., the star packets and the auxiliary-science-data packets (Section 1.1.3) is temporarily stored in the payload data-handling unit (PDHU; Section 1.1.3) before being transmitted to ground (see also Gaia Collaboration et al. 2016b). The PDHU contains (up to) 256 files, each labelled with a unique number (File_ID), to allow discriminating and prioritising data based on scientific criteria (e.g., bright stars are more important than faint stars). During ground-station contact, the down-link manager on board cycles frequently through all files in priority order and down-links a user-defined number (the so-called multi-plexing ratio) of fixed-size sectors of the storage memory of that file before proceeding to the next, lower-priority file. A typical cycle time is 20 minutes so that, during a typical ground-station pass of 12.5 hours, also low-priority data are received. In case of on-board storage shortage, low-priority sectors are deleted following a user-defined data-deletion priority which, typically, follows the inverse order of the down-link priority. This setup allows to govern the overall balance between the amount of down-linked and deleted star packets of type 1 and 2 (that is, between astrometric and photometric data on the one hand and spectroscopic data on the other hand), the data loss distribution over magnitude, and the latency with which data is received on ground, relevant for the photometric and Solar-system science-alert projects.
Down-link-priority and data-deletion settings are user defined and tracked in the CDB (Section 1.2.3). In general, bright stars have a higher priority for being telemetered to ground first and are protected on-board from being deleted (Table 1.12). During the time interval covered by Gaia DR3, a few changes to the priority settings have been made: the non-unity multi-plexing ratios have been multiplied by a factor 10 on 28 October 2014, the faint-end granularity for SP2 packets was improved on 10 November 2014, the position of the ASD4 and BAM File_IDs in the down-link priority table was swapped on 16 September 2015 so that the on-board control procedure that stops the down-link in case link problems are detected affects BAM data rather than ASD4 data, selected multi-plexing ratios were tuned to decrease the latency of astrometric data during galactic-plane scans (Section 1.1.3) on 26 July 2016 (temporarily deactivated on 12 August 2016 and permanently reactivated on 8 September 2016), and a change of the deletion thresholds for four File_IDs was implemented on 8 September 2016.
| Star | Bright mag- | Faint mag- | Deletion |
| packet | nitude limit | nitude limit | percentage |
| SP1 | 5.00 | 13.00 | 0 |
| SP1 | 13.00 | 16.00 | 0 |
| SP1 | 16.00 | 16.30 | 1 |
| SP1 | 16.30 | 17.00 | 1 |
| SP1 | 17.00 | 17.20 | 2 |
| SP1 | 17.20 | 18.00 | 2 |
| SP1 | 18.00 | 18.10 | 2 |
| SP1 | 18.10 | 19.00 | 3 |
| SP1 | 19.00 | 19.05 | 2 |
| SP1 | 19.05 | 19.95 | 7 |
| SP1 | 19.95 | 20.00 | 2 |
| SP1 | 20.00 | 20.30 | 13 |
| SP1 | 20.30 | 20.40 | 11 |
| SP1 | 20.40 | 20.50 | 12 |
| SP1 | 20.50 | 20.60 | 28 |
| SP1 | 20.60 | 20.70 | 27 |
| SP1 | 20.70 | 20.80 | 27 |
| SP1 | 20.80 | 20.90 | 27 |
| SP1 | 20.90 | 21.00 | 22 |
| SP2 | 5.00 | 10.50 | 0 |
| SP2 | 10.50 | 11.00 | 1 |
| SP2 | 11.00 | 11.30 | 1 |
| SP2 | 11.30 | 12.00 | 1 |
| SP2 | 12.00 | 12.20 | 1 |
| SP2 | 12.20 | 13.00 | 1 |
| SP2 | 13.00 | 13.10 | 1 |
| SP2 | 13.10 | 14.00 | 1 |
| SP2 | 14.00 | 14.05 | 2 |
| SP2 | 14.05 | 15.00 | 8 |
| SP2 | 15.00 | 15.05 | 2 |
| SP2 | 15.05 | 15.50 | 12 |
| SP2 | 15.50 | 15.80 | 7 |
| SP2 | 15.80 | 16.00 | 6 |
| SP2 | 16.00 | 21.00 | 5 |
Micro-clanks
As discussed in Gaia Collaboration et al. (2016b), the spacecraft rotation rate occasionally changes rapidly – by typically up to a few milliarcsec per second – and subsequently returns quickly to the rate before the excursion. From the characteristics of such rate-change signatures, which have a typical occurrence rate of about once per minute, it is clear that these events are caused by sudden, minute structural changes (for example mass displacements related to stress relieve) within the spacecraft causing a quasi-instantaneous discontinuity in the spacecraft attitude. The resulting rate spikes are hence named ‘micro-clanks’, in contrast to micro-meteoroid hits, which cause a sudden input of angular momentum and hence ‘permanently’ change the spin rate of the spacecraft. Micro-clanks are observed both in the along- and in the across-scan direction, and they often repeat (quasi-)periodically with the spin period of the spacecraft. In the along-scan direction, the vast majority of them affect both fields of view equally and simultaneously. In general, micro-clanks have no discernible effect in the BAM data, which suggests that their origin is outside the optical instrument and payload. For a small fraction of events, however, the occurrence times coincide with jumps in the BAM fringe-position data (Section 1.3.3), which suggests that a small subset of events originate within the mechanical structure of the optics.
Micro-clanks have also been detected in Hipparcos data (van Leeuwen 2007a) and have been attributed for that mission to small mechanical adjustments in the hinges of the Solar-panel wings created by the varying amount of sunlight falling upon the wings over the rotation period of the Hipparcos spacecraft. For Gaia, something similar is likely happening but then primarily involving the bottom of the spacecraft (i.e., sunshield, launcher-interface ring, and/or phased-array antenna). Micro-clanks can be identified from CCD-transit-time-derived rate data and are calibrated out in the pre-processing of the attitude data (see Section 4.3.5).