9.7.1 Galaxies
Sérsic profile
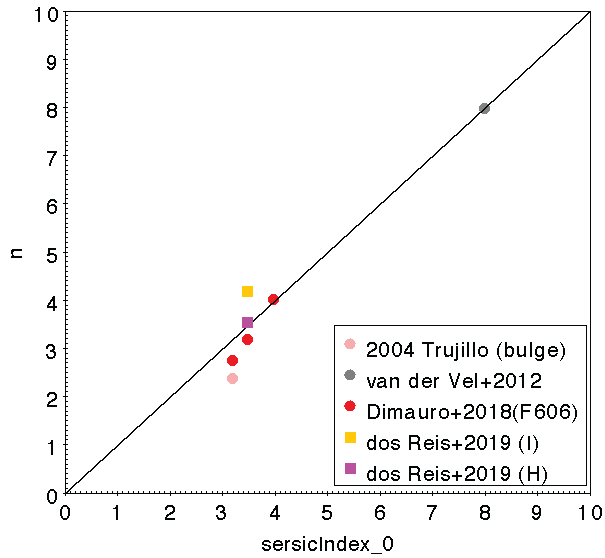
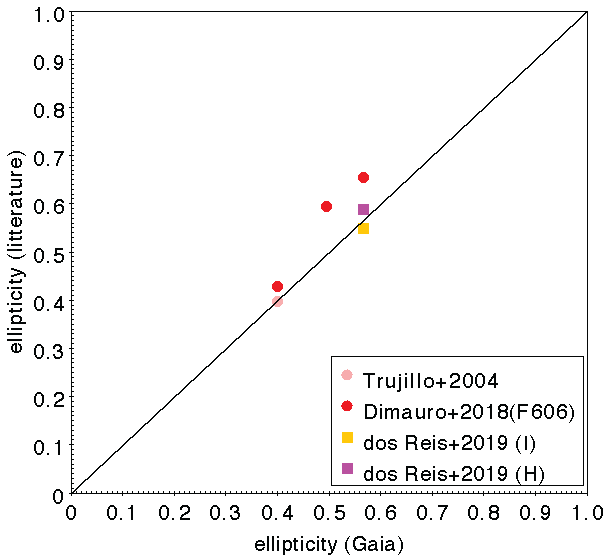
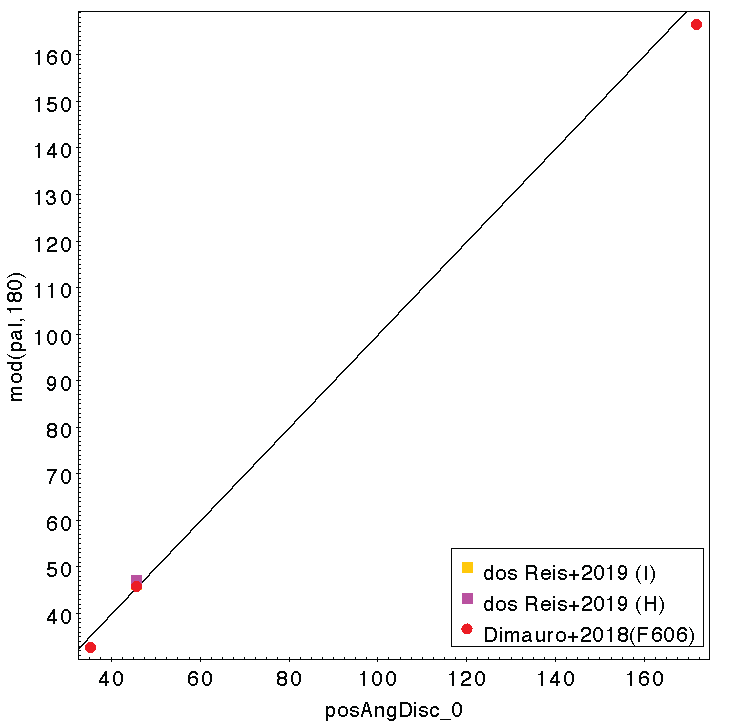
While analysing the space-based studies of galaxy morphology using HST data, only very few galaxies were in common with our list of processed sources: one in common with Trujillo and Aguerri (2004), one with van der Wel et al. (2012), two with Dimauro et al. (2018) and one with dos Reis et al. (2020). The comparison of the Sérsic index, ellipticities and position angles of Gaia DR3 with these studies is given in Figure 9.8. This comparison, although very limited because of the small number of comparison objects shows a good agreement between these studies and the Gaia parameters.
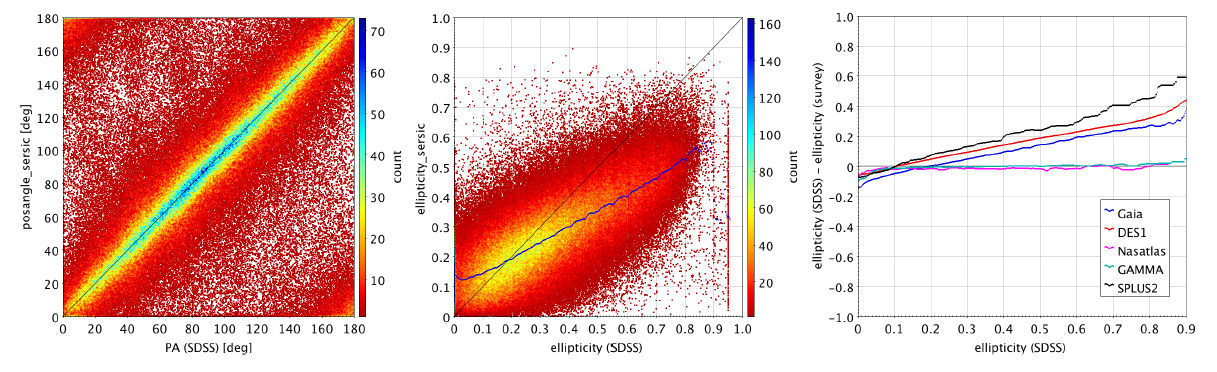
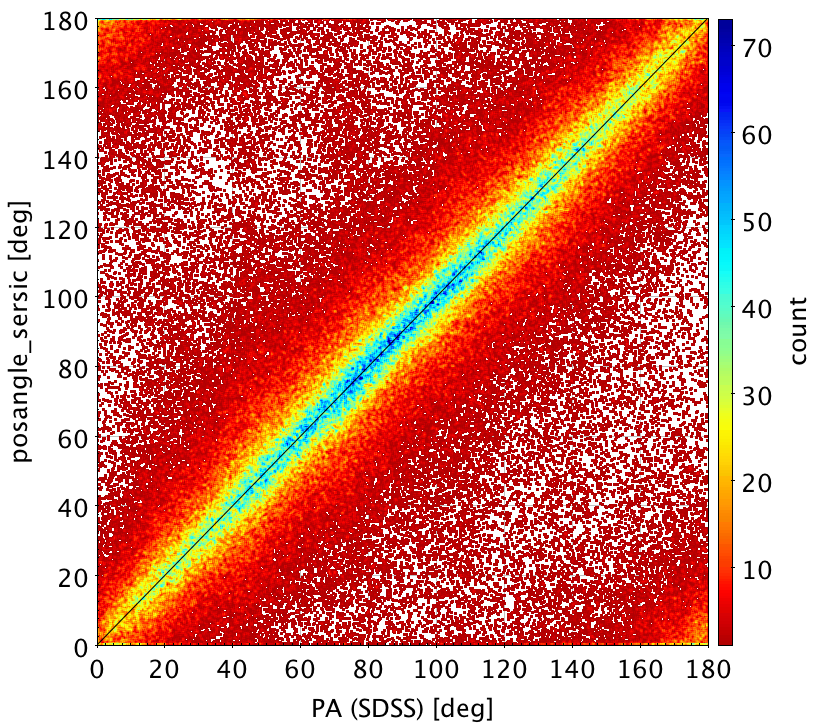
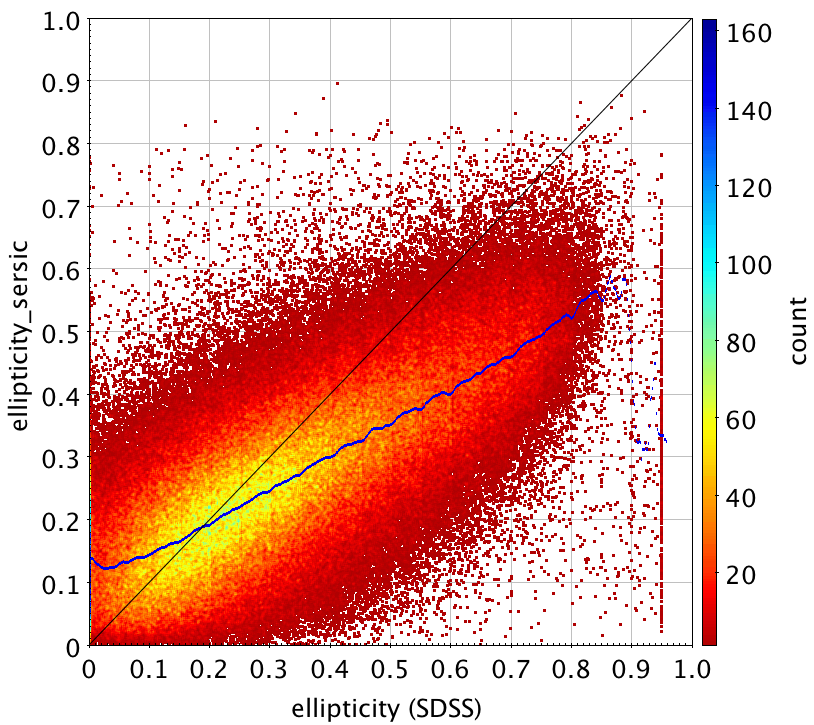
There are a few ground-based surveys that adjust a free Sérsic profile (as GAMMA, NASA-Sloan-Atlas (Maller et al. 2009) (hereafter NASATLAS) or the work from Simard et al. (2011)). The Sérsic indexes given in Gaia DR3 and in these surveys are not comparable. The main reason is the atmospheric seeing that modifies the inner light profile of the sources (see Balcells et al. (2003) for similar analysis). Nonetheless, the shape parameters (ellipticity and position angle) of the galaxies derived from space and from ground should globally compare. We present the comparison of the Gaia shape parameters of Sérsic profile with the SDSS DR16 de Vaucouleurs profile in Figure 9.9. The comparison of position angle is excellent, the sources that depart from the diagonal usually exhibit a small ellipticity, for which the position angle parameter is meaningless. The comparison of ellipticities presents a systematic trend: Gaia tends to see galaxies rounder than SDSS. This can be explained by the fact that Gaia is observing the inner part of most galaxies. The fitted ellipticities are influenced by the bulge shape. Another effect concerns the projected ellipticity that is measured and which is varying along the radius, see for instance Ferrari et al. (2004). A more global comparison of the ellipticities given in SDSS DR16 with several surveys exhibits a systematic drift with DES or SPLUS (Mendes de Oliveira et al. 2019) surveys and a good agreement is observed in the comparison with GAMMA and NASA-Sloan-Atlas (NASATLAS) surveys. It is then very difficult to conclude which survey is at the origin of the observed drift.
de Vaucouleurs profile
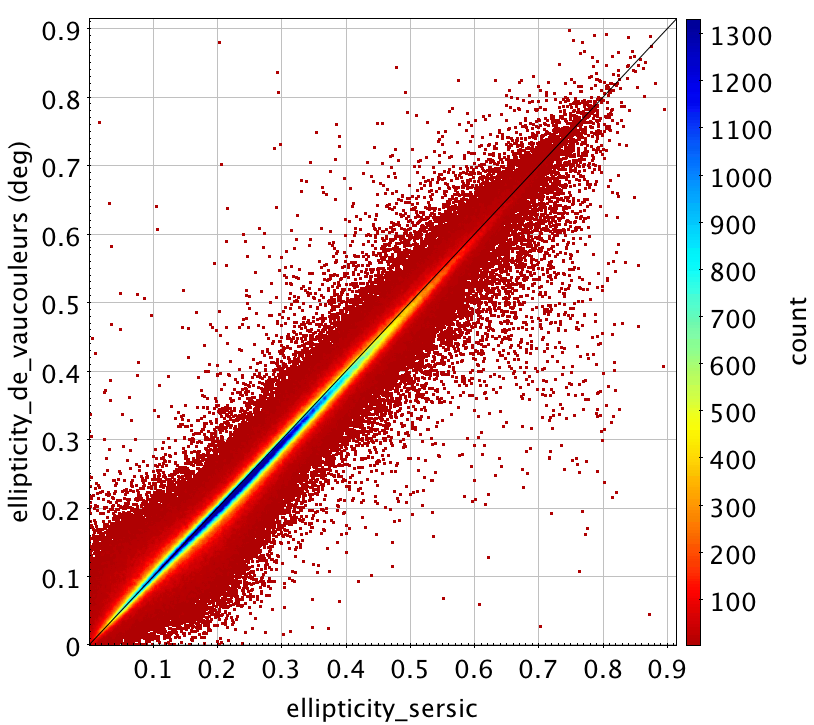
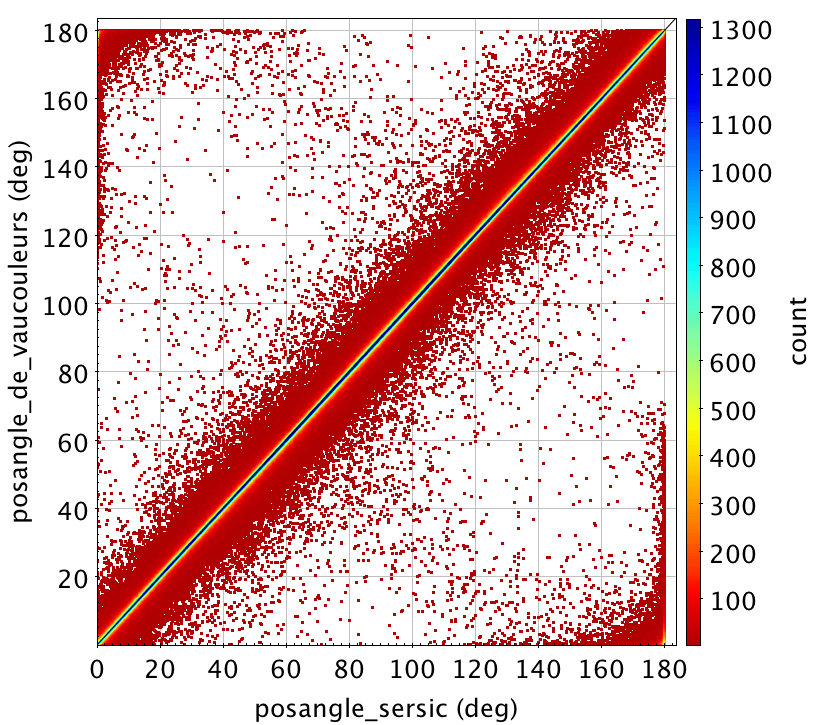
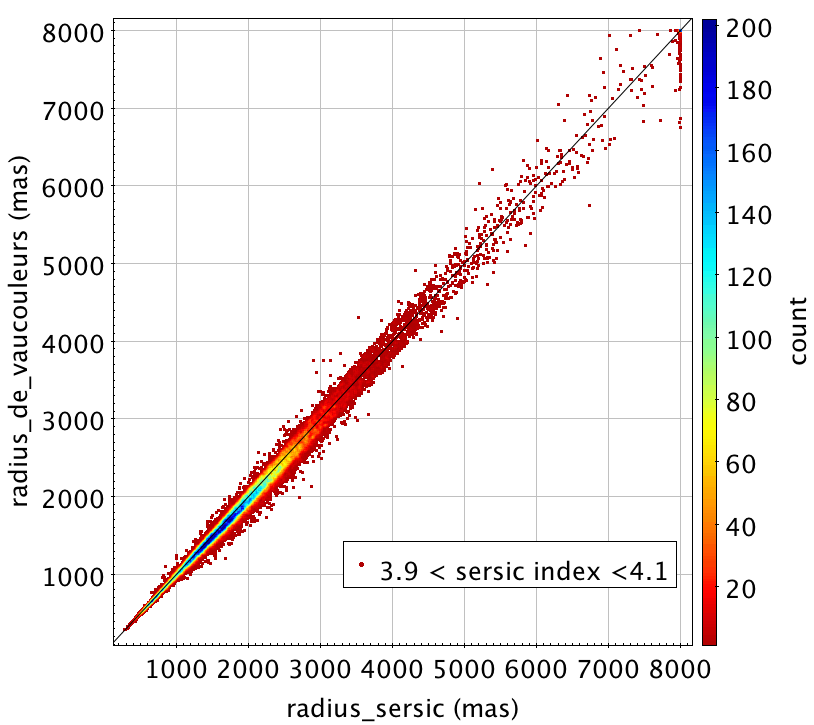
To our knowledge, there is no space-based survey that adjust a de Vaucouleurs profile on galaxy. The SDSS DR16 ground-based survey is providing a de Vaucouleurs profile for galaxies in common with the list of sources used in this study. The problem of the seeing modifying the shape of the light profile is still present and limit the comparison that can be done. Nonetheless, the de Vaucouleurs profile is a Sérsic profile with index fixed at 4, therefore the comparison may still be relevant. We present the comparison of the parameters derived with Gaia data and by the SDSS in Figure 9.10. The accordance between both radii is reasonable, with no systematic except for the very large objects for which Gaia is in the extrapolation regime. The position angles present a very good accordance as for the Sérsic model. The same systematic of ellipticities is observed as for Sérsic profile.
Internal coherence
To some extent the comparison of the two profiles fitted for the galaxies allow some internal assessment of the validity of the results. We have compared the position angles and ellipticities derived by the Sérsic and the de Vaucouleurs models (Figure 9.11). To compare the effective radii given by the two models, we selected in the Sérsic model the sources with a Sérsic index close to 4 which corresponds to a de Vaucouleurs profile. The radii should then be comparable (Figure 9.11).
There is an excellent agreement between the parameters fitted by the two models which means that the models are coherent.
Exponential profile
Theoretical analysis (de Bruijne et al. (2015) and de Souza et al. (2014)) indicate that the on-board video processing unit filters out all disc galaxies. These galaxies are usually modelled by an exponential profile. There are only few hundreds objects for which the free Sérsic profile fitted converged towards a Sérsic index compatible with a pure disc (index ).
Despite this, an exponential profile has also been adjusted on the galaxies as:
where is the central light intensity of the exponential profile and is the scale length (radius where the intensity drops by a factor e from the central intensity).
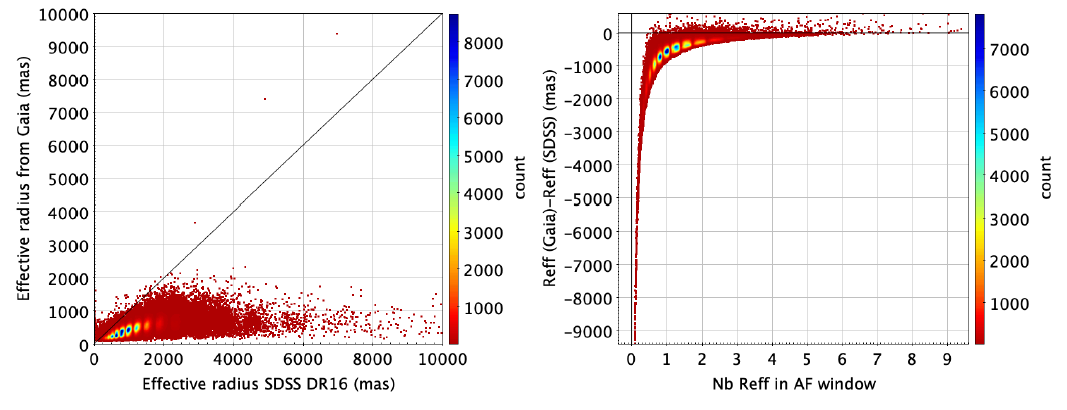
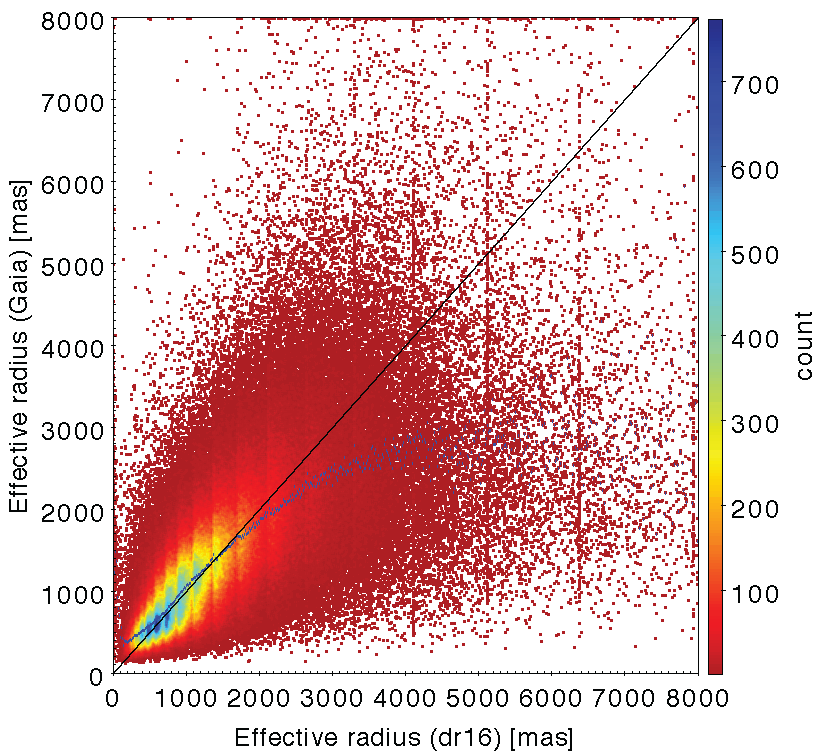
The results showed that very few objects were well described by an exponential profile. The bulges of the galaxies usually follow a de Vaucouleurs profile. The fitting of an exponential profile extrapolates, for most objects, the scale length. This tends to lower this quantity as shown in Figure 9.12 presenting the comparison of the effective radius of the profile fitted with the SDSS DR16 exponential profile. The radii fitted are systematically smaller than those given by SDSS. The size of the difference is correlated to the size of the object. These differences mostly arise from the fact that the shape of most Gaia galaxies does not follow an exponential profile, as predicted. Then the fitting process tends to extrapolate the radius with systematic, while SDSS used images of the whole objects with larger influence of the disc. In simulations of bulge plus disc galaxies, the fitting of an exponential profile led to radii following mostly the bulge characteristics.