5.3.7 Photometric relationships with other photometric systems
Author(s): Josep M. Carrasco
This section includes some photometric transformations from Gaia passbands to other common photometric systems using Gaia DR2 data. Hipparcos (ESA (1997)), Tycho-2 (Høg et al. (2000)), SDSS12 (Alam et al. (2015)), Johnson-Cousins(Landolt (2009)), 2MASS (Skrutskie et al. (2006)) and GSC2.3 (Lasker et al. (2008)) are included here.
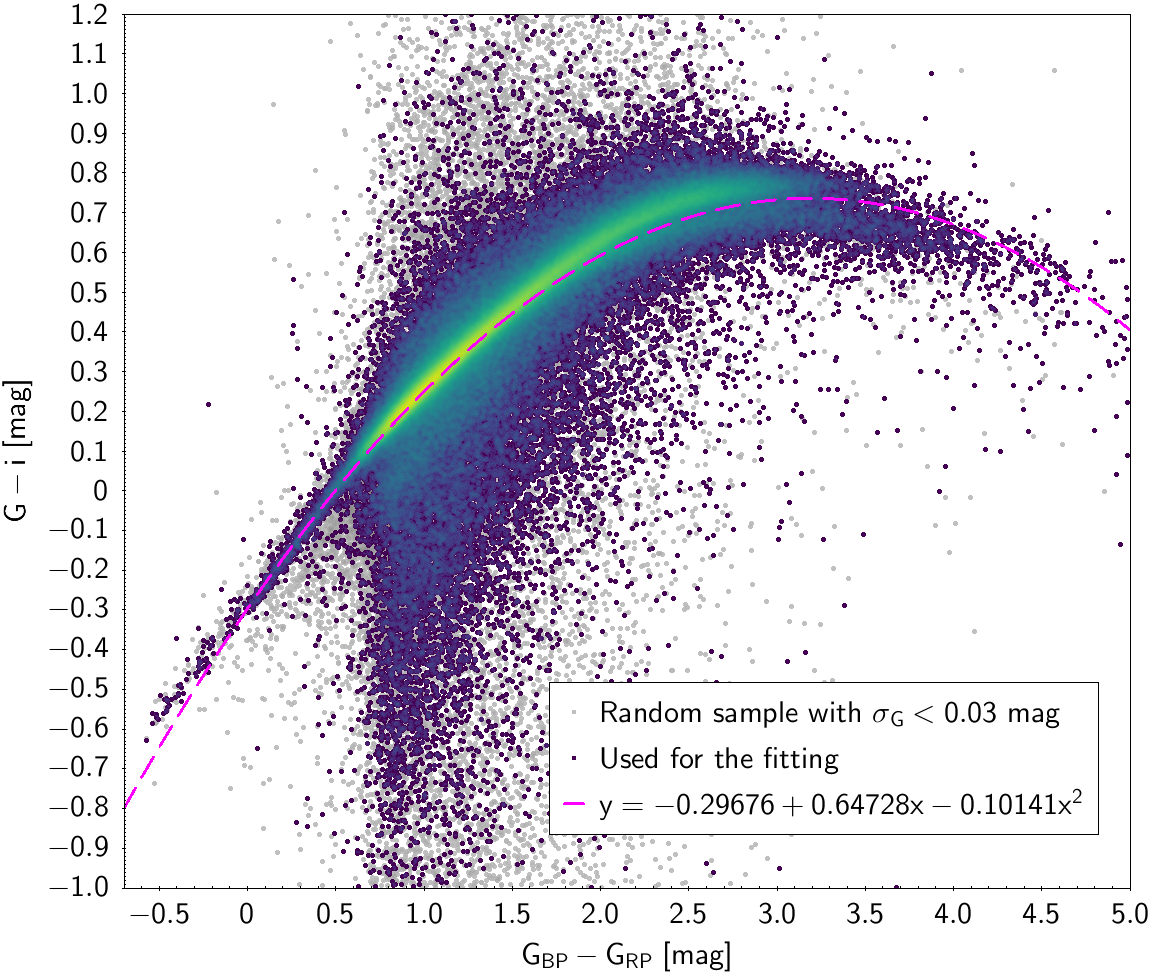
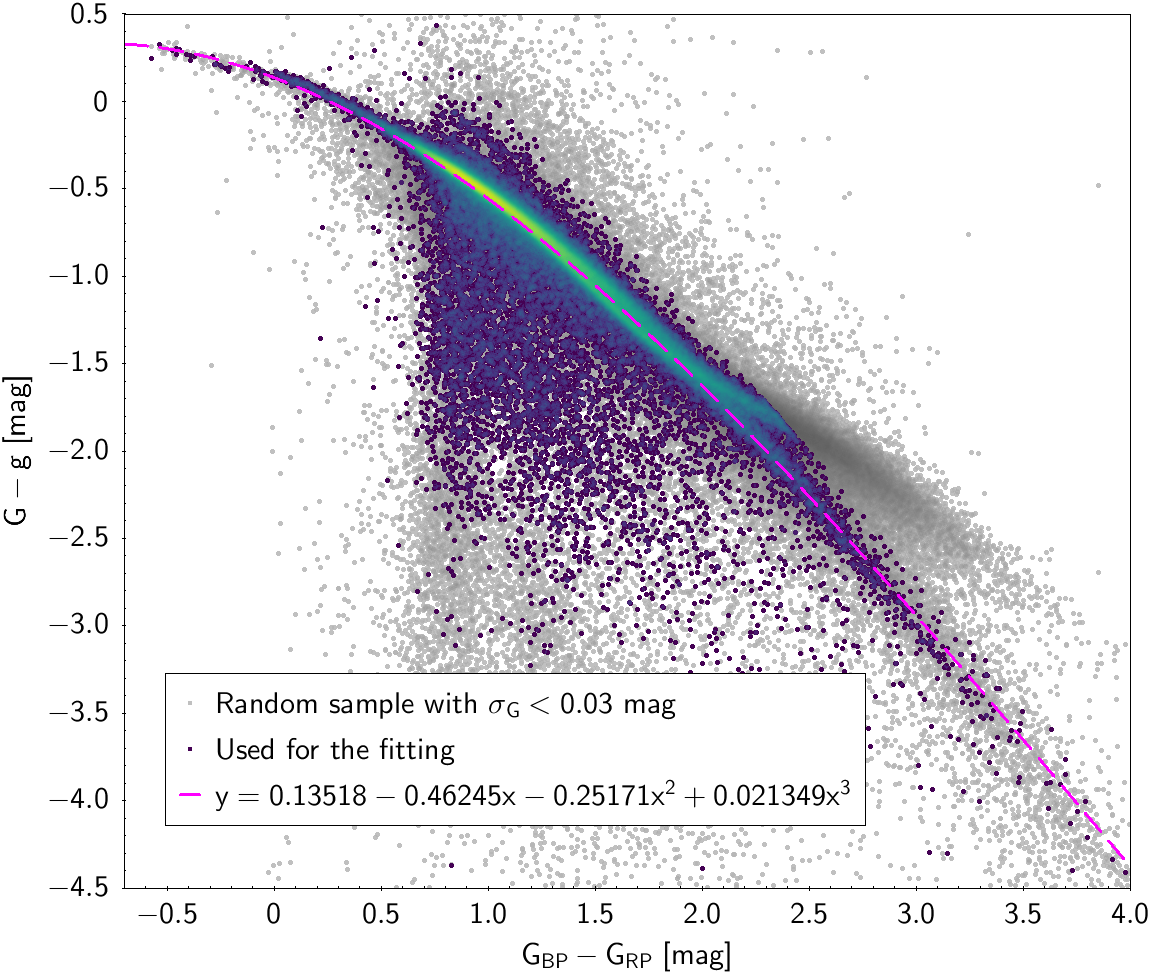
Only those sources with small magnitude error and small excess flux (see Sec. 5.5.2) were used for the fitting. Gaia DR2 sources were cross-matched with mag (in order to limit the influence of the photometric noise in the derived relationships), considering those having available photometry in the external photometric systems. Nevertheless, this dataset is not appropriate for SDSS12 transformations, as SDSS12 sources brighter than 14 mag are saturated. To avoid this problem, for SDSS12 transformations we used some Gaia DR2 sources with and SDSS12 magnitudes fainter than 15th. For GSC2.3 transformations, two different fittings were done, one using sources with , and another with , as the photometric system is not equal in the two celestial hemispheres.
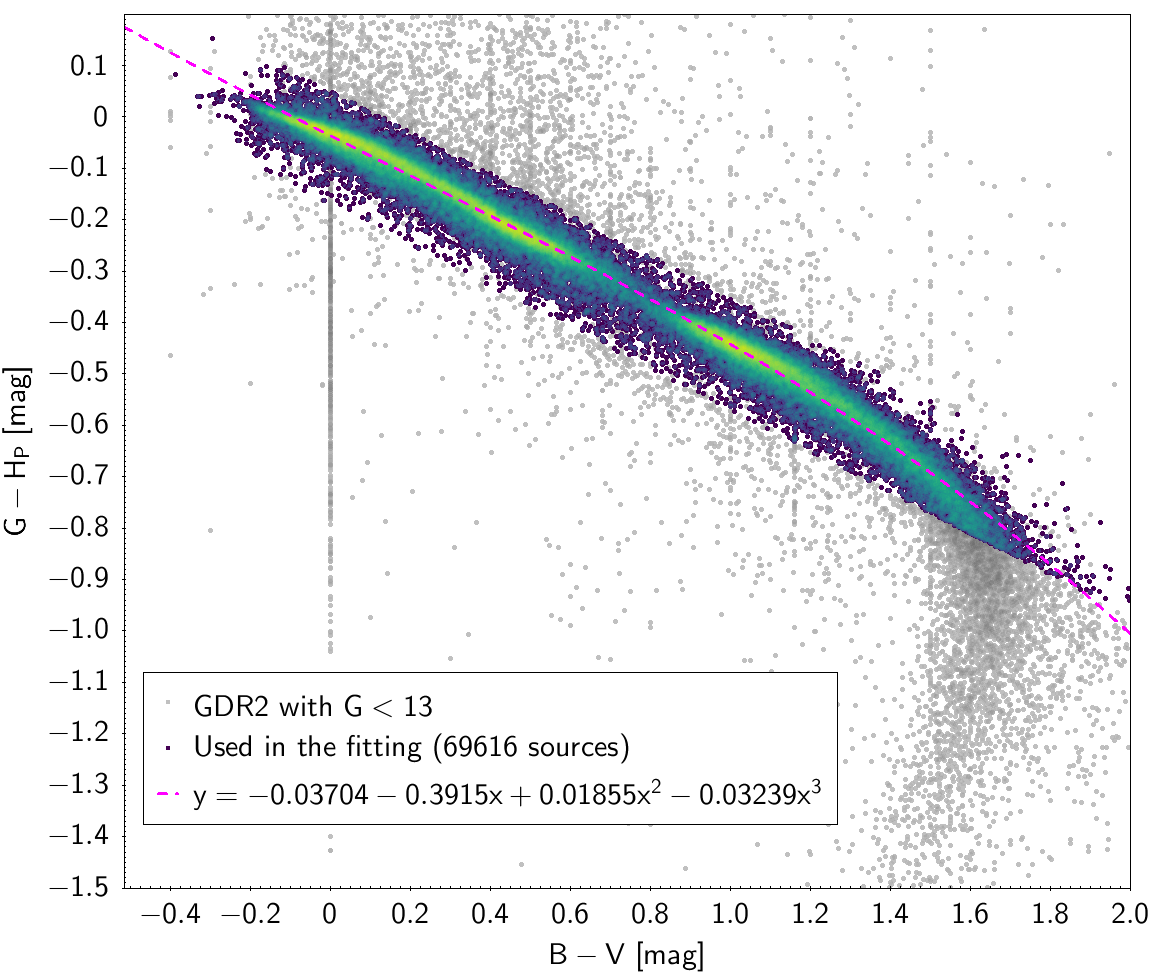
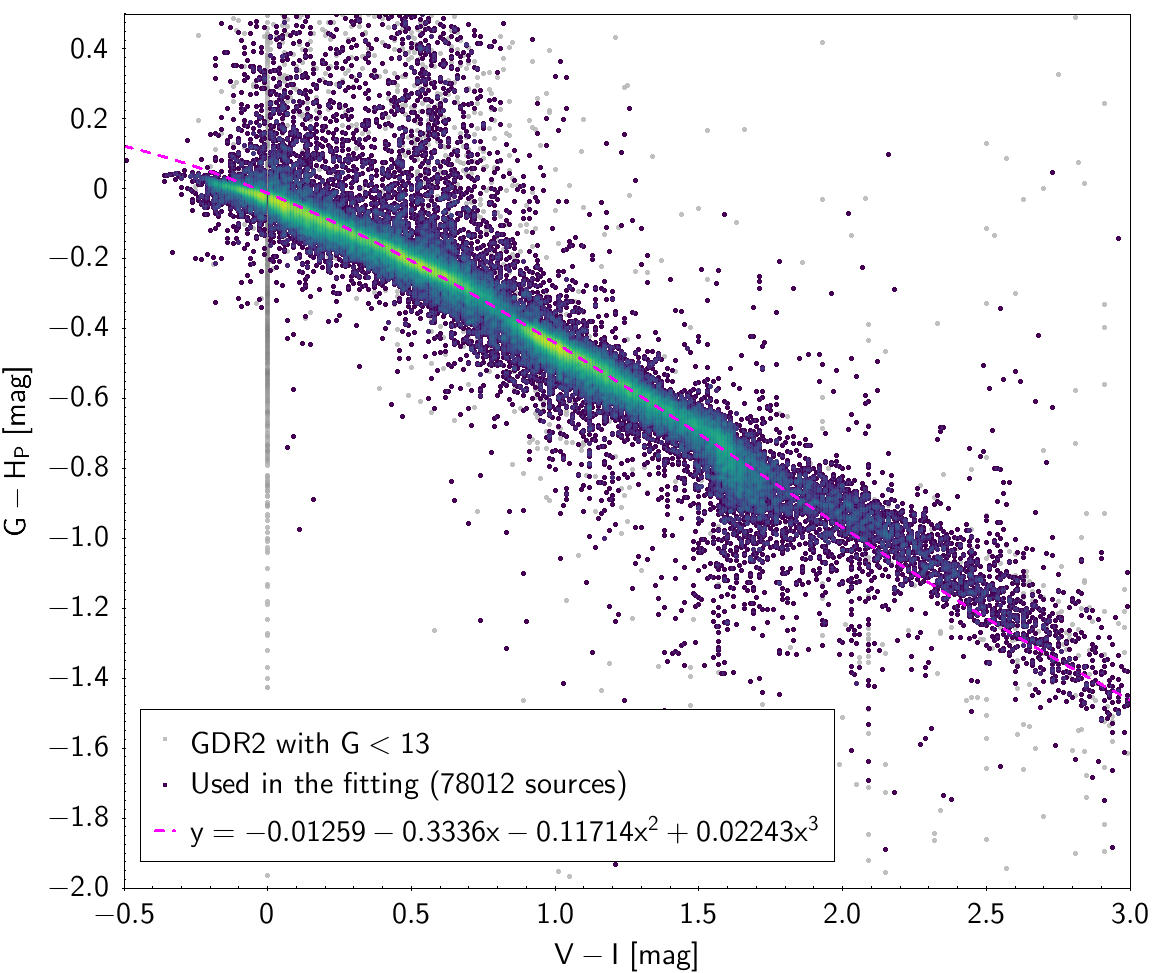
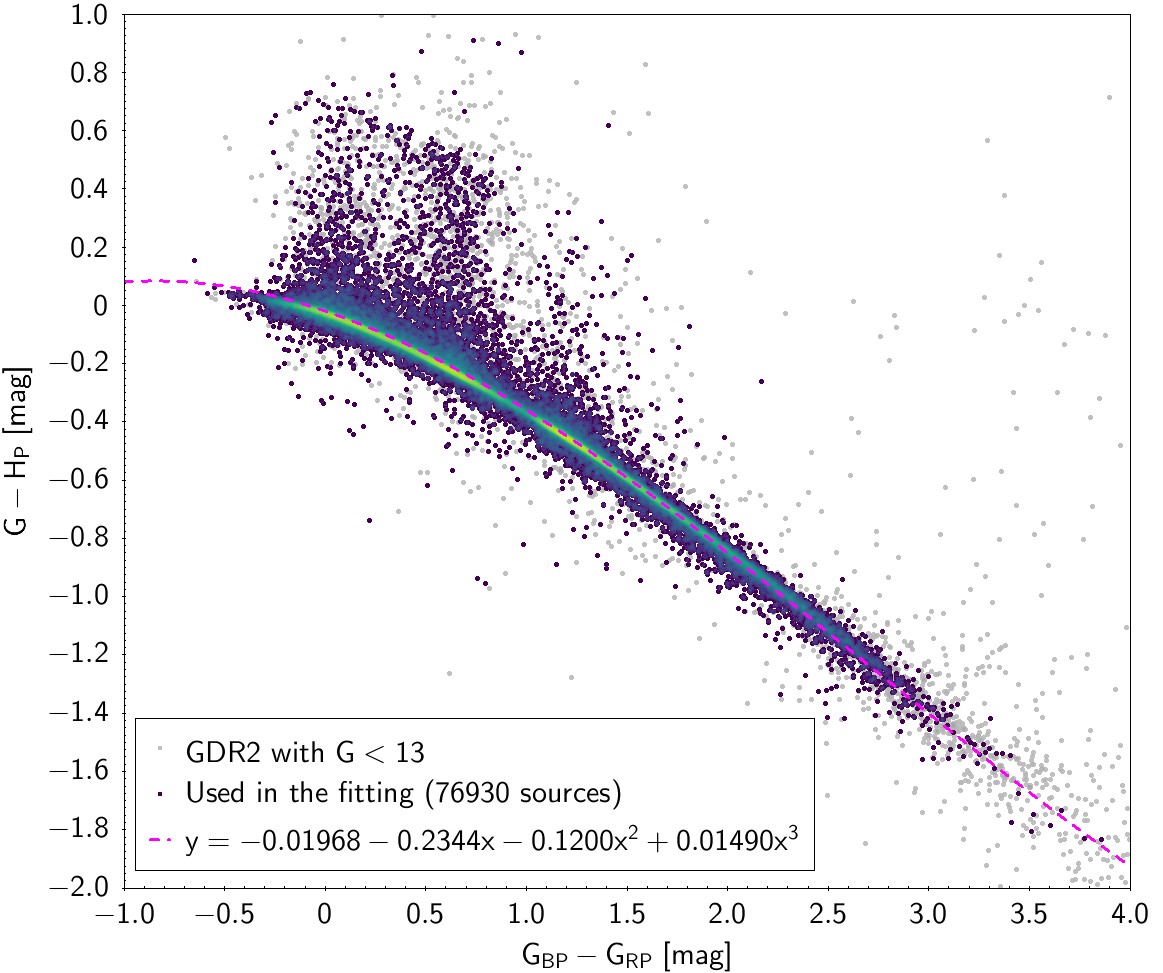
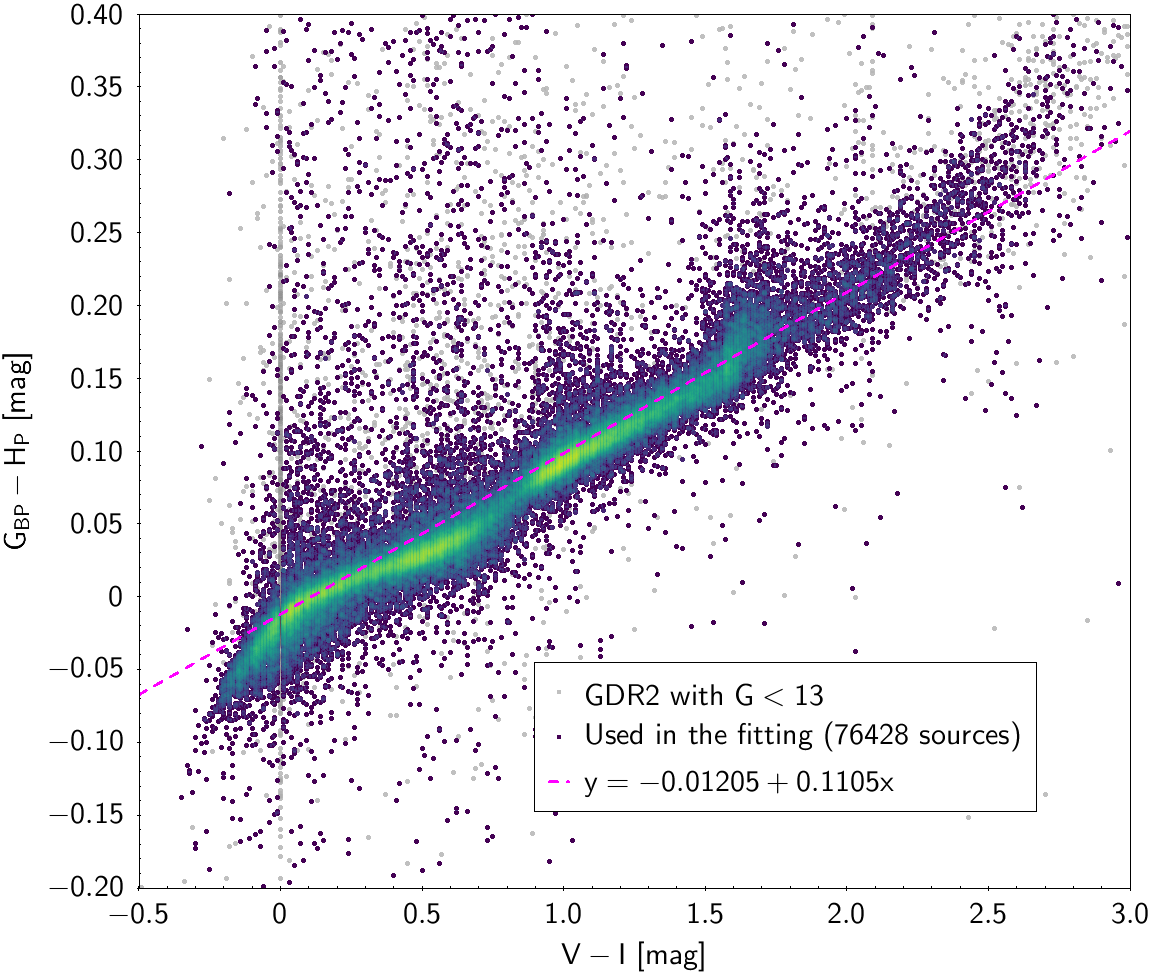
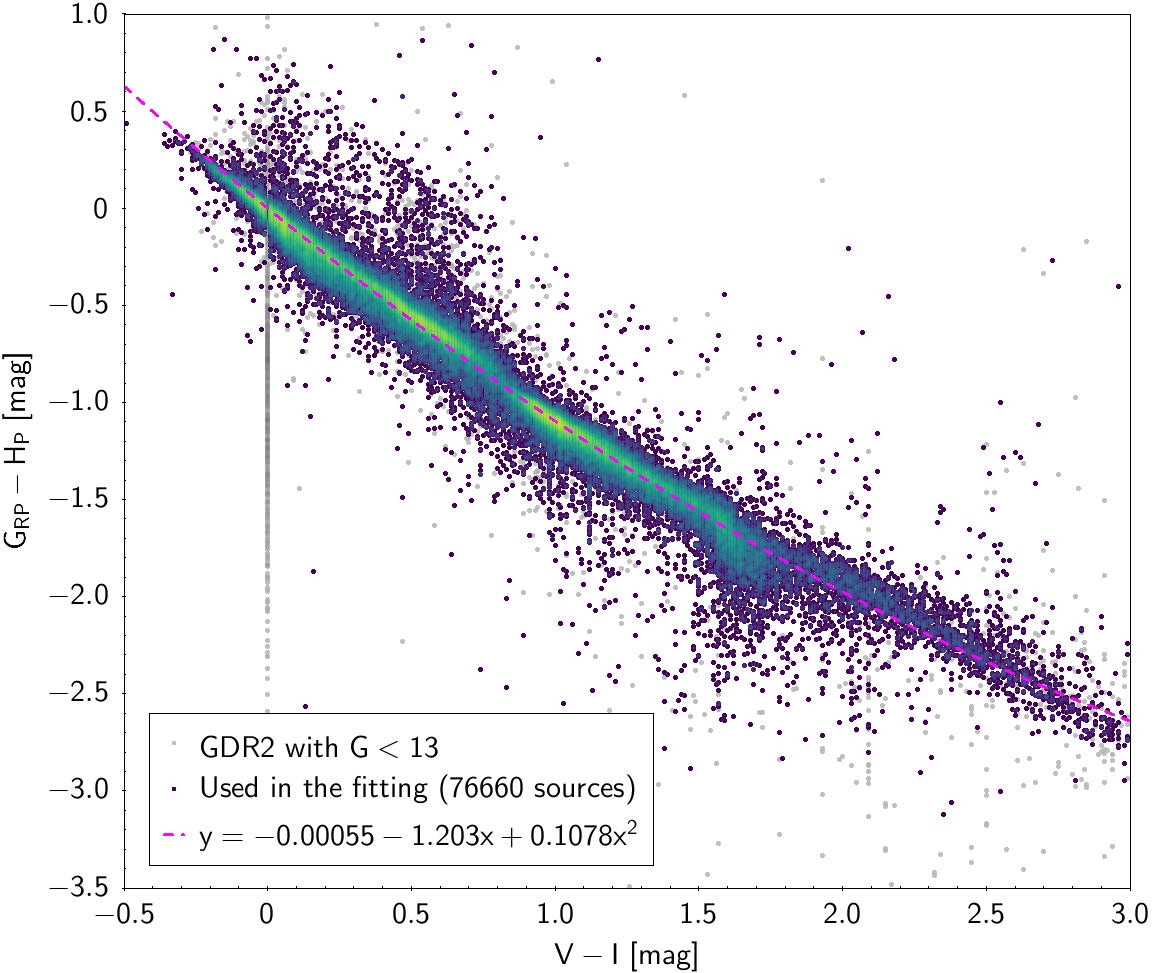
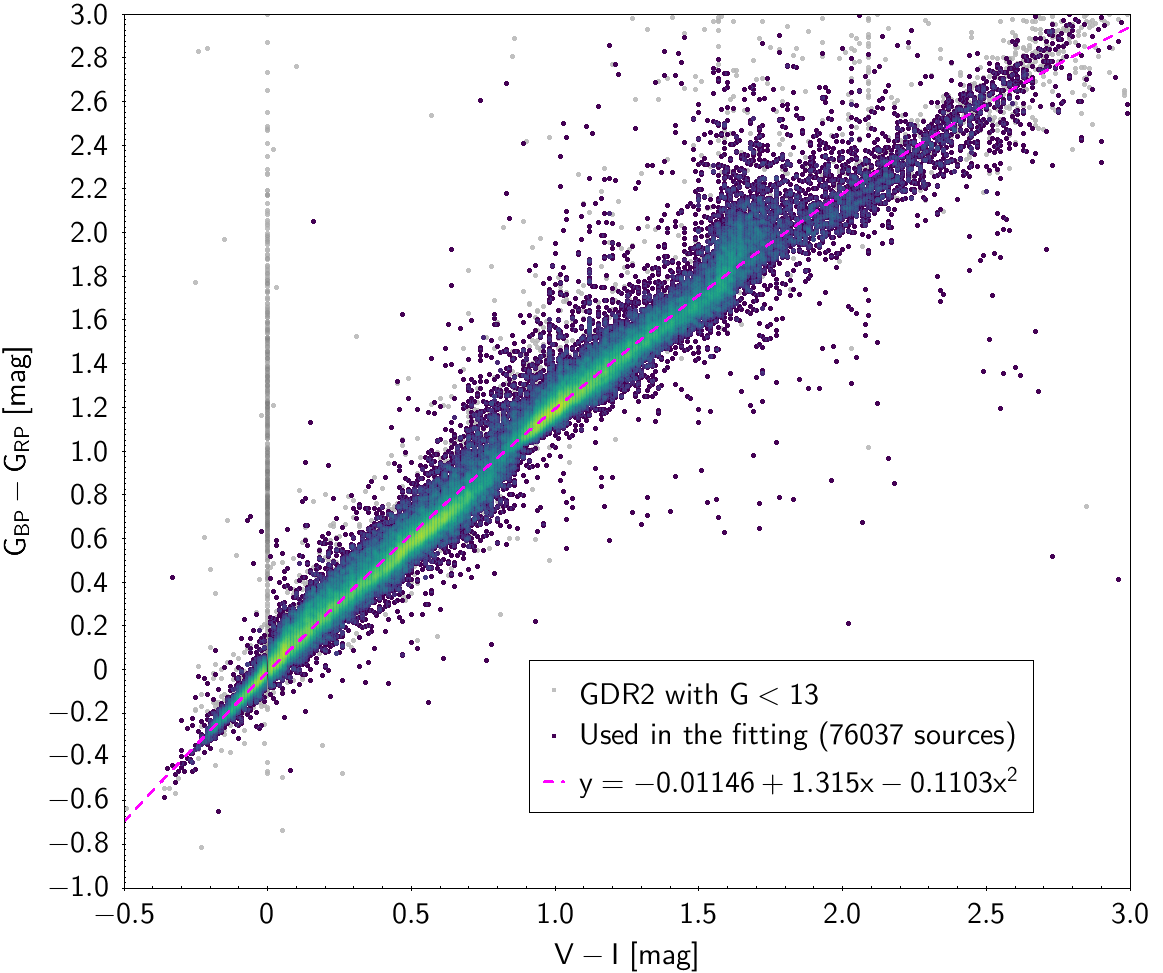
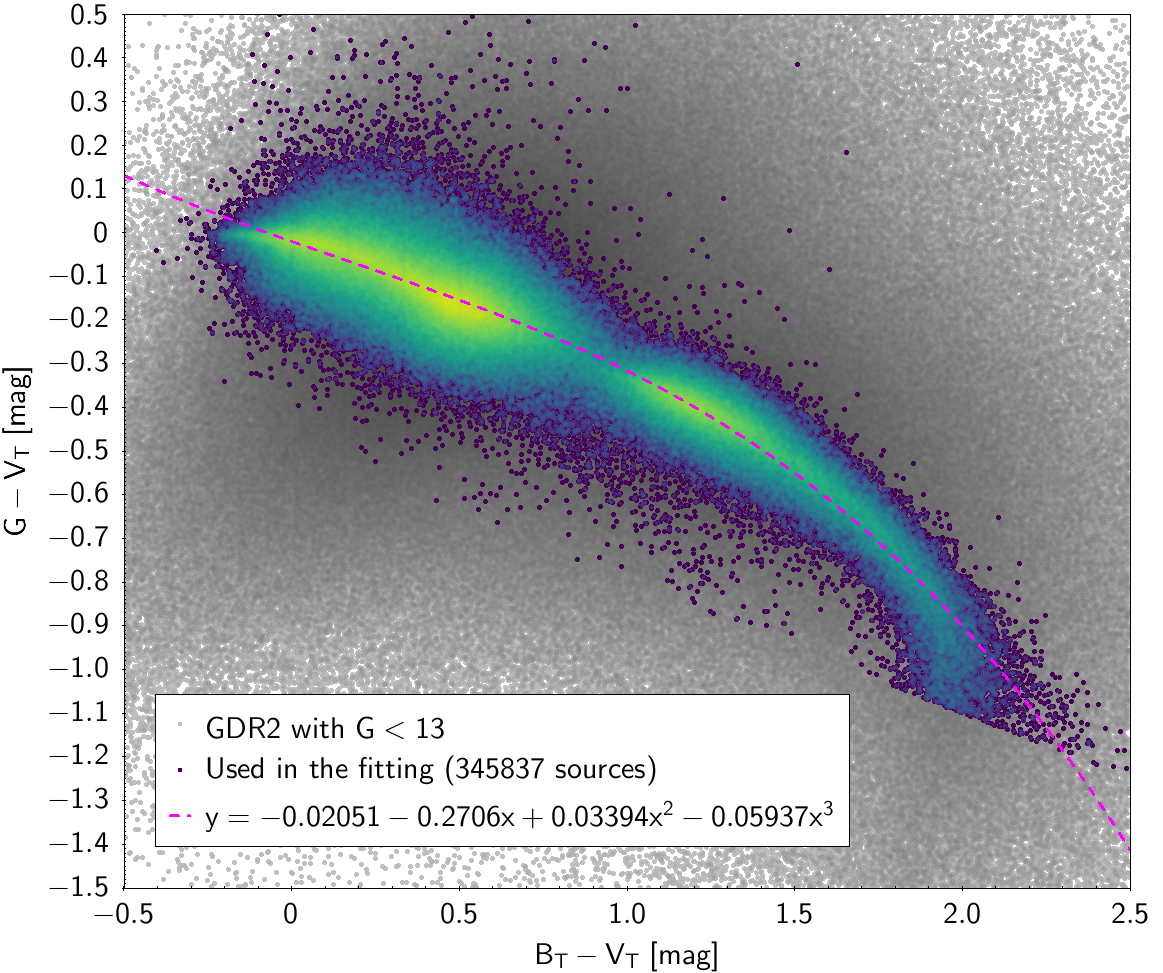
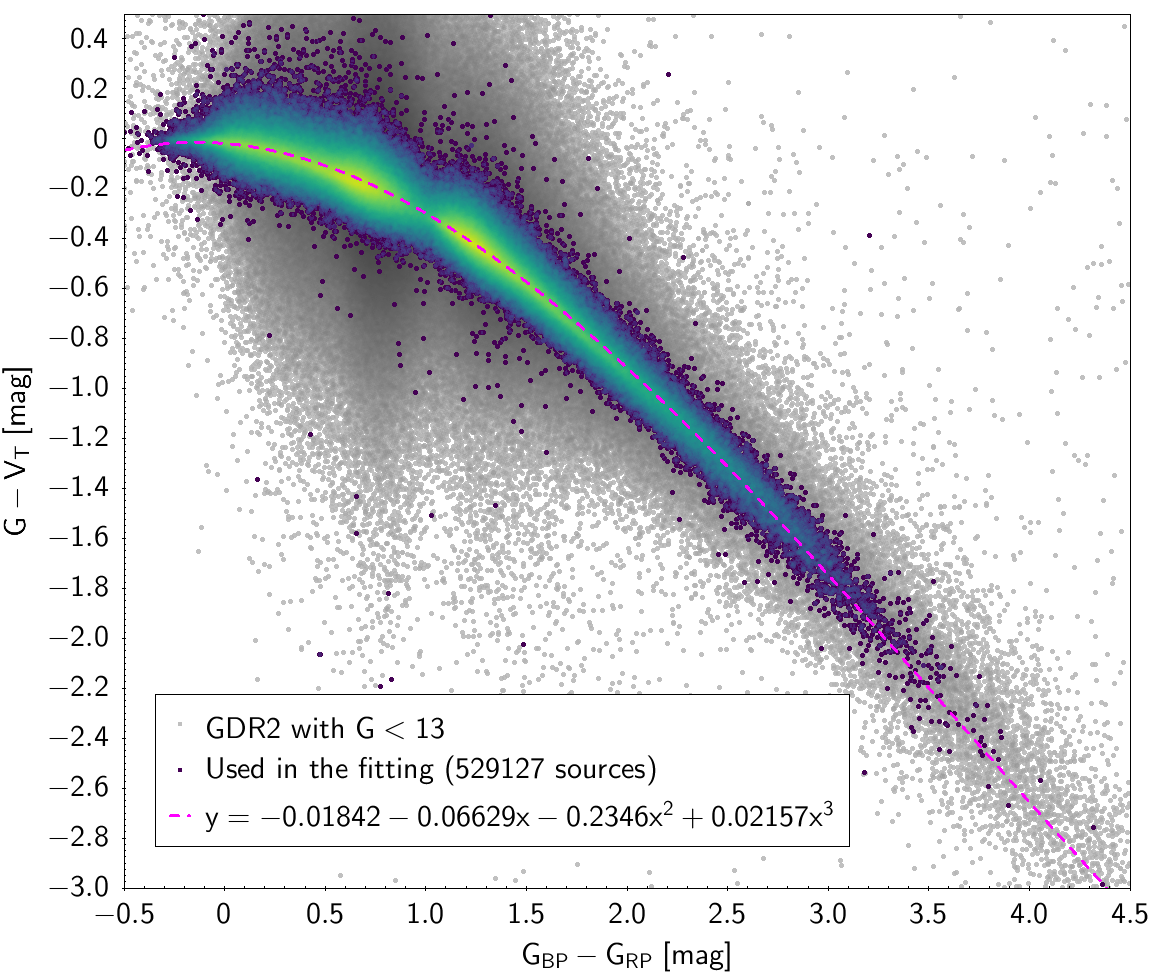
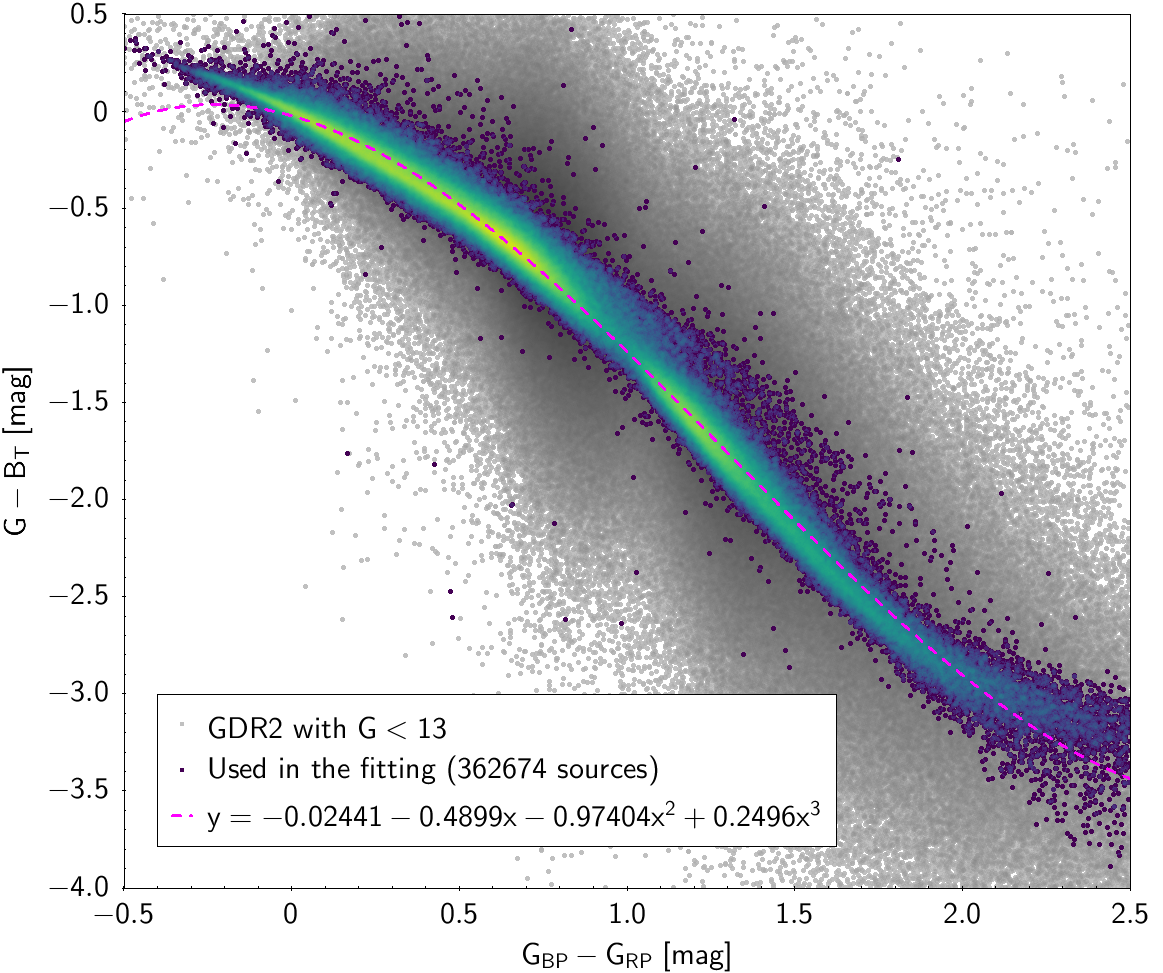
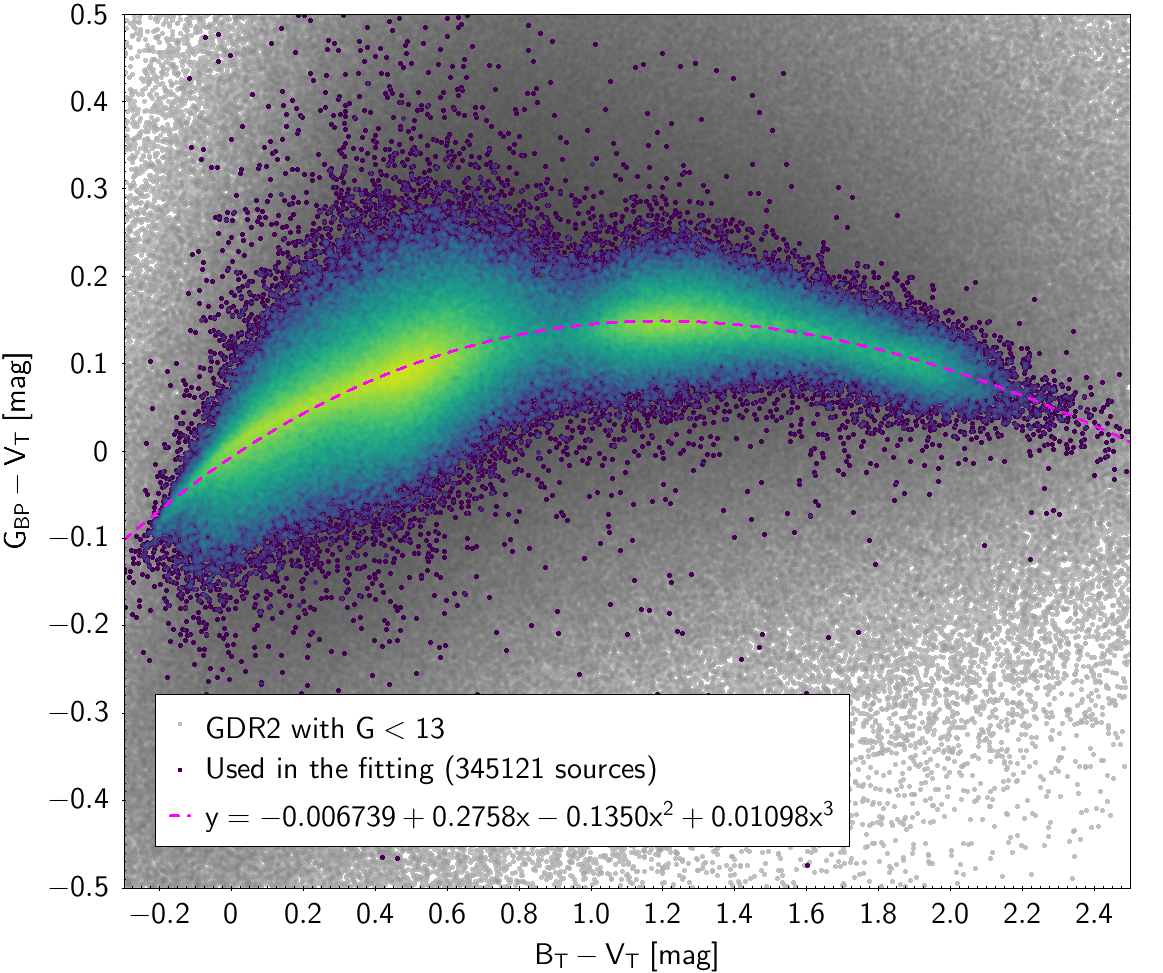
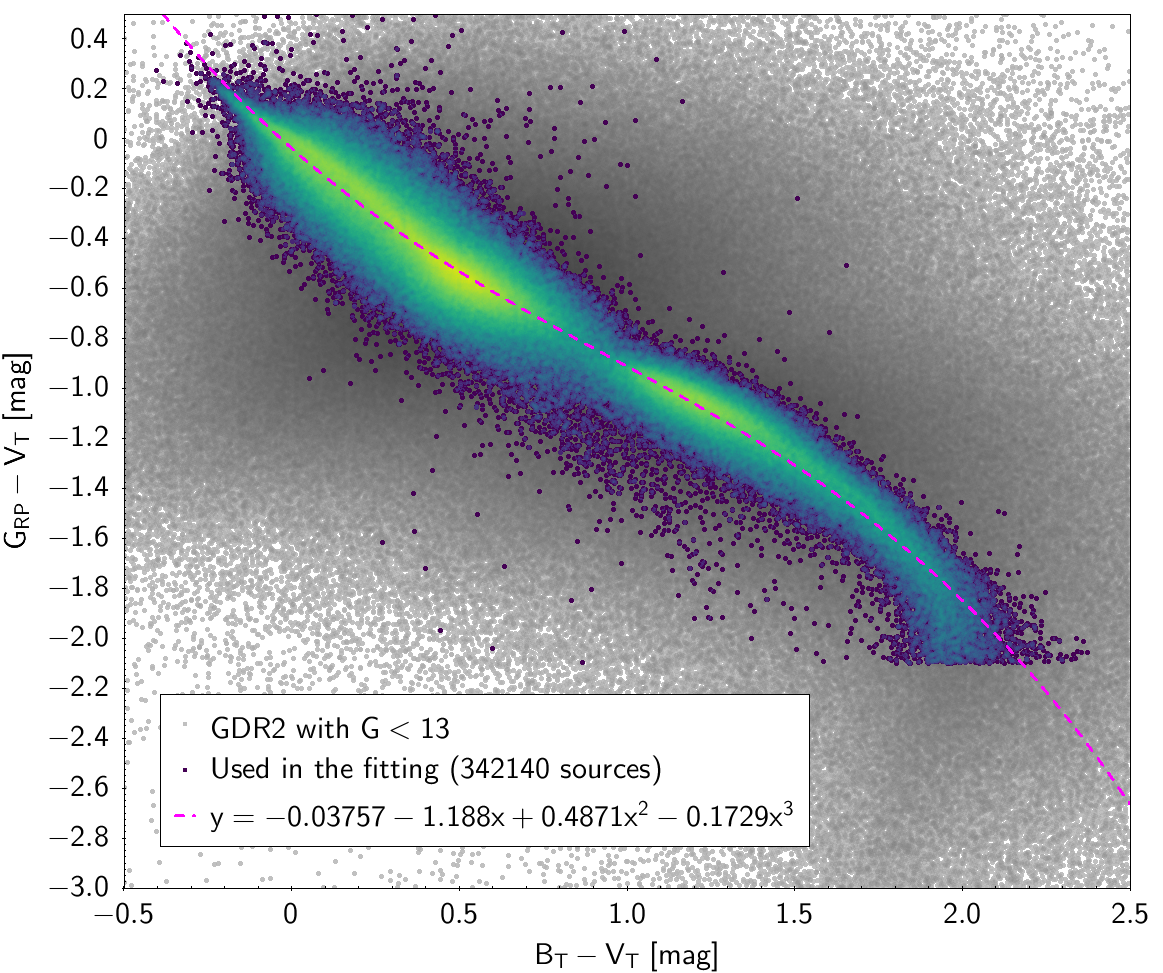
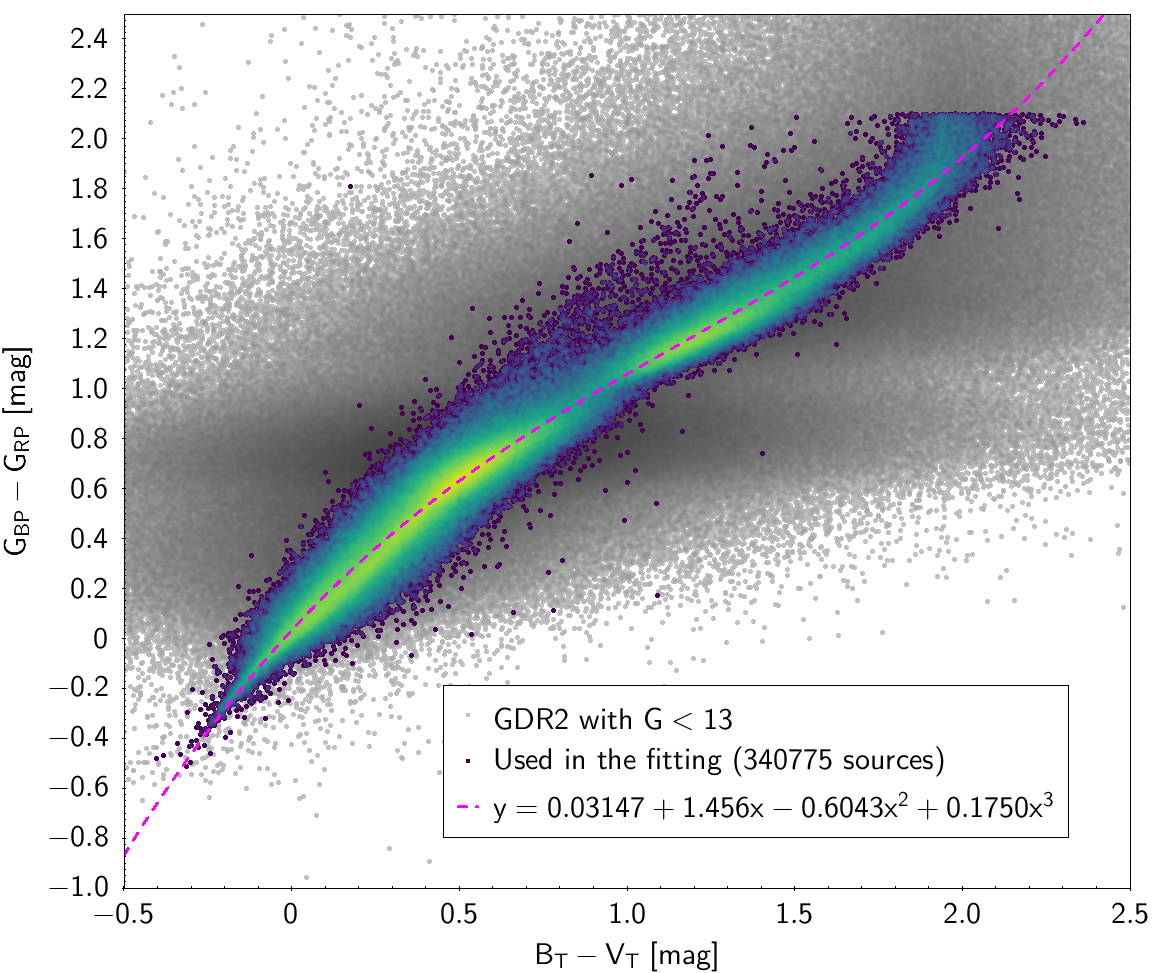
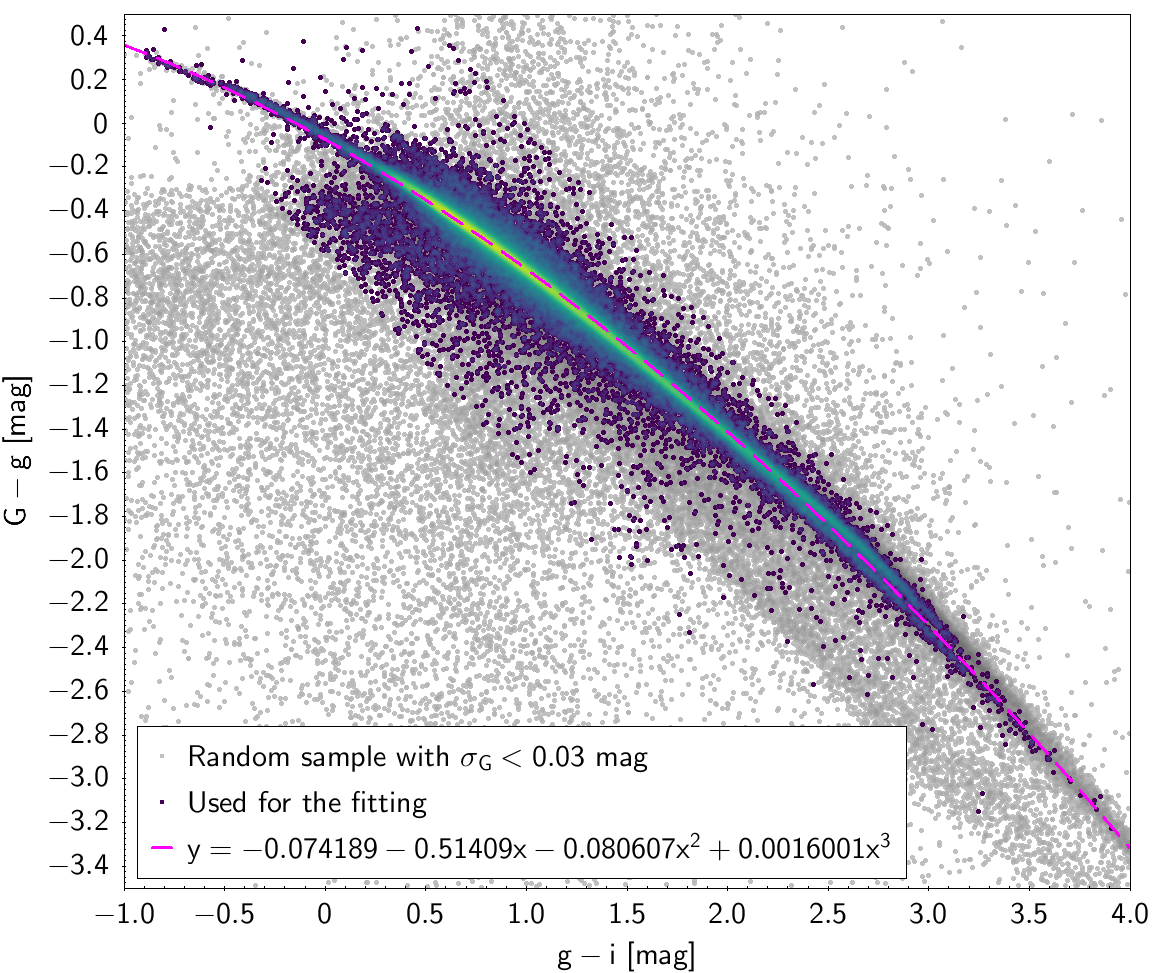
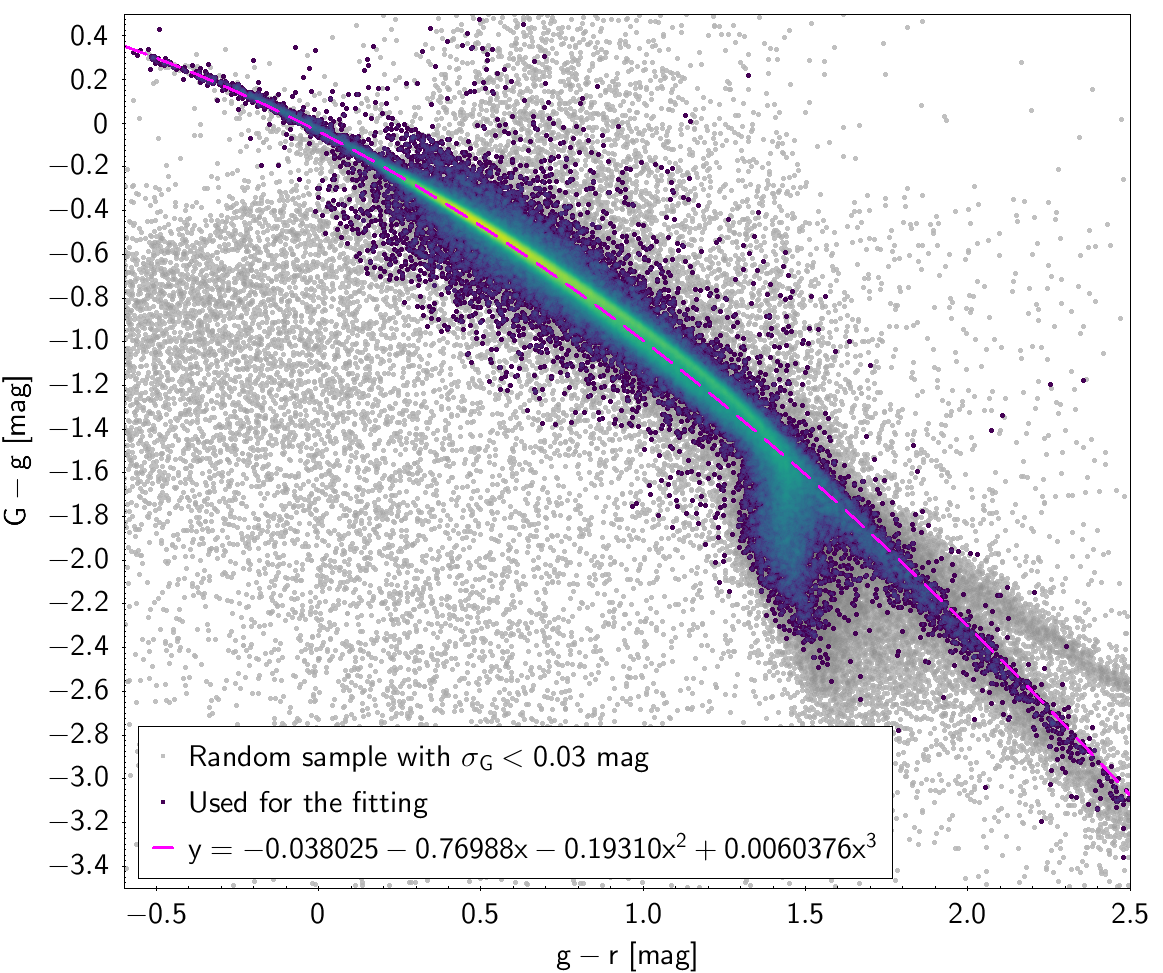
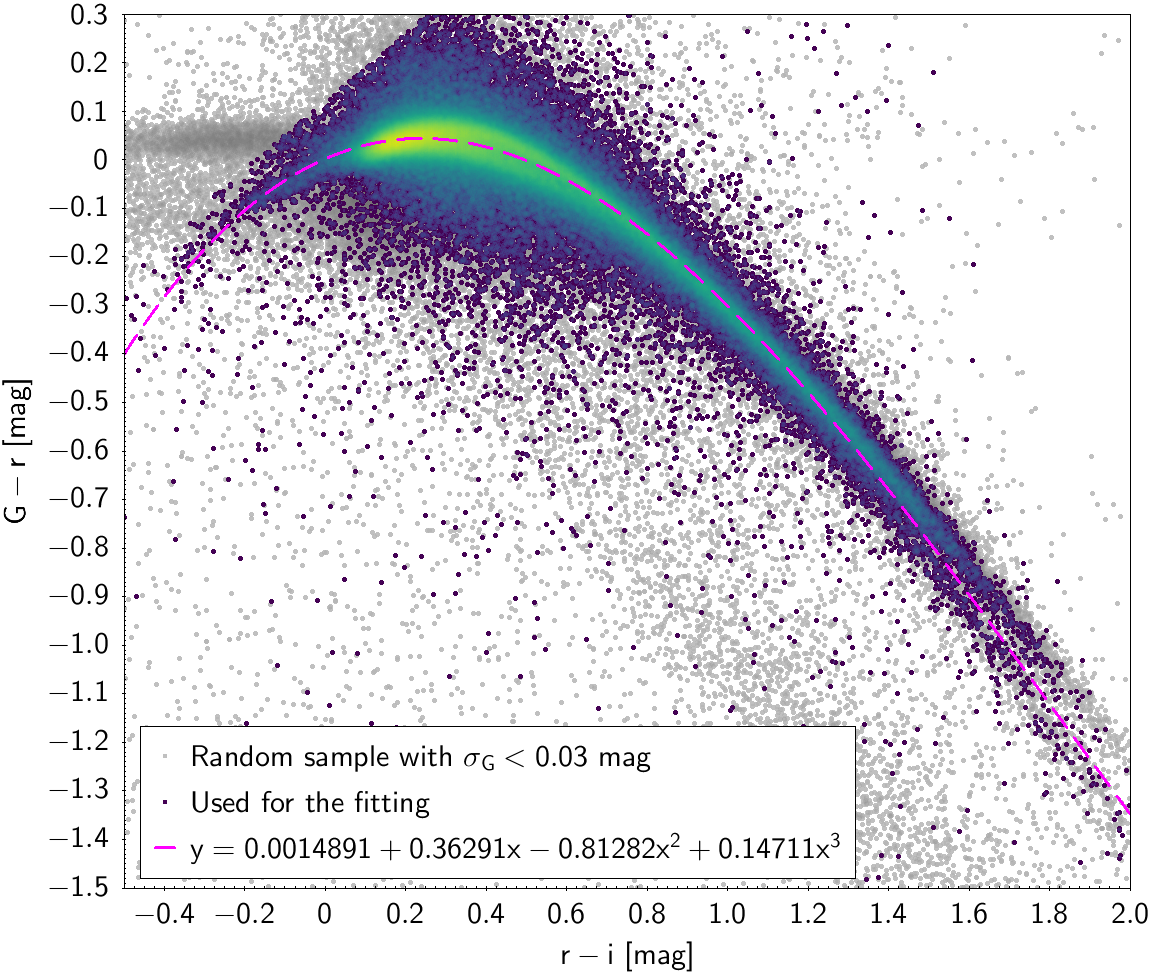
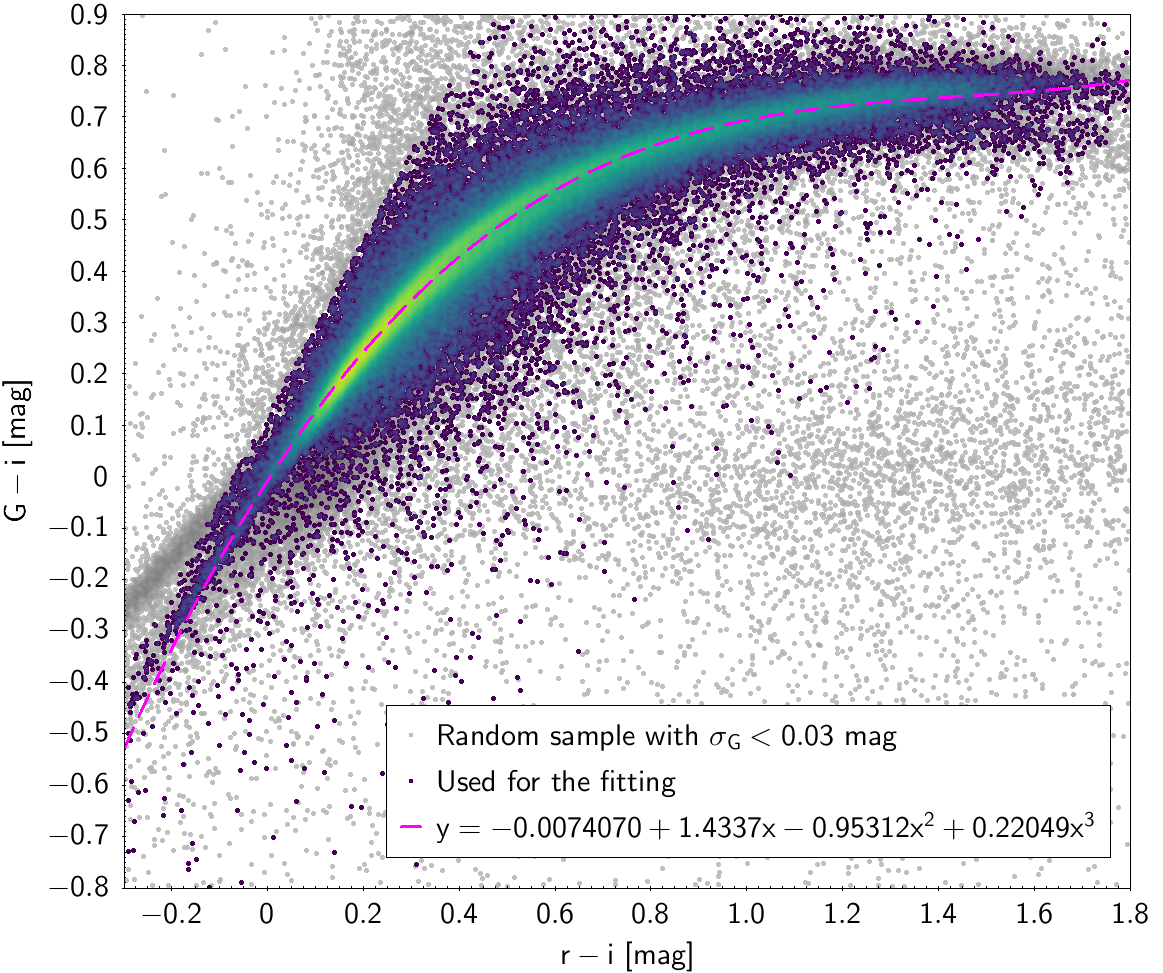
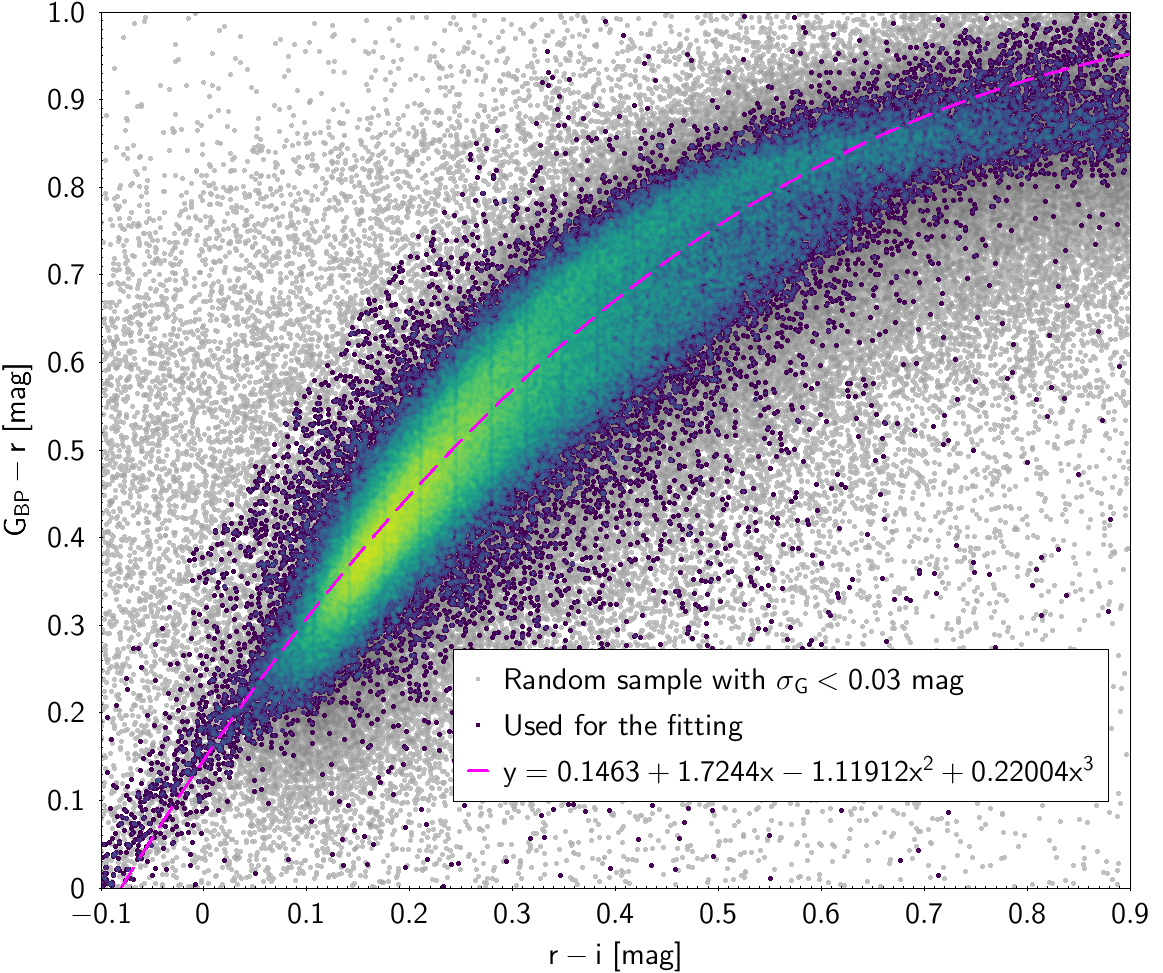
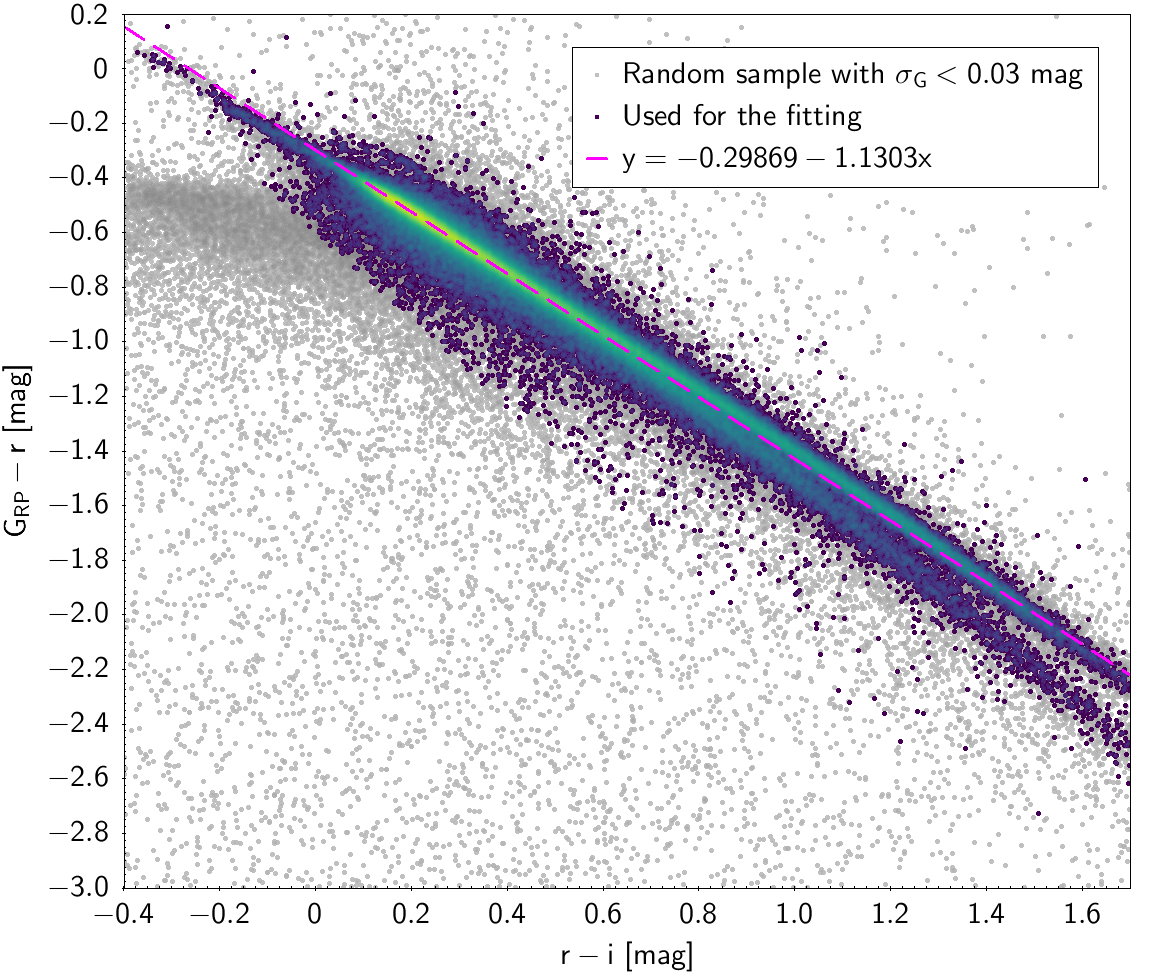
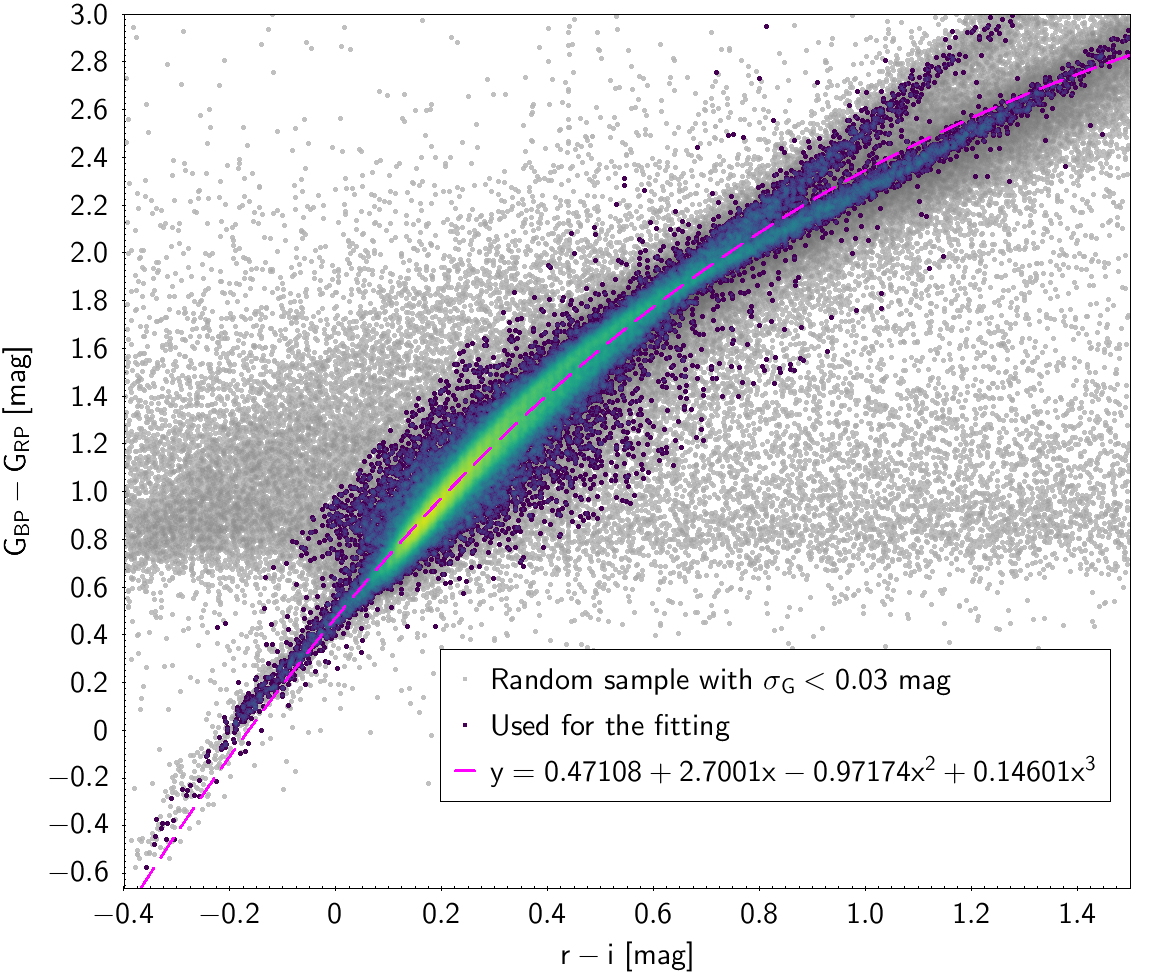
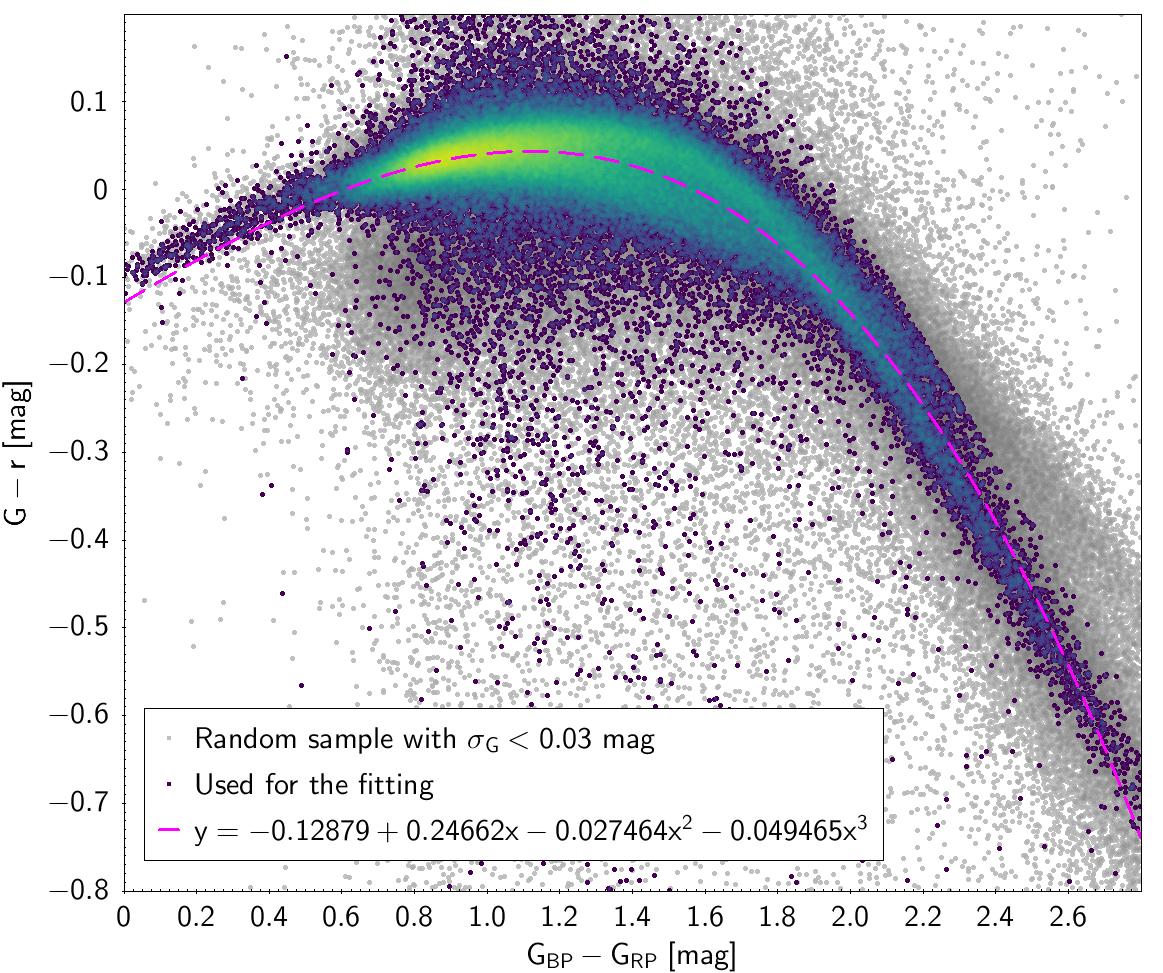
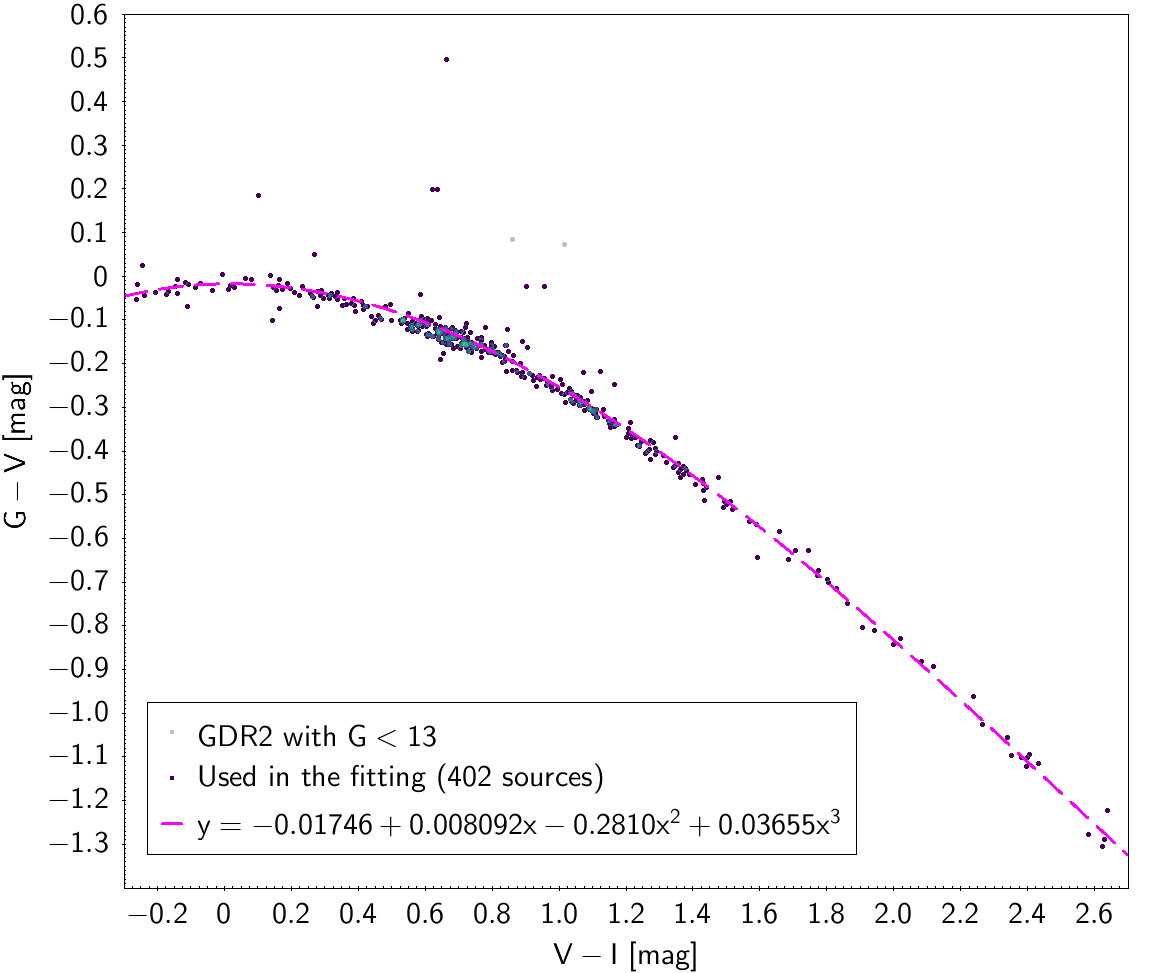
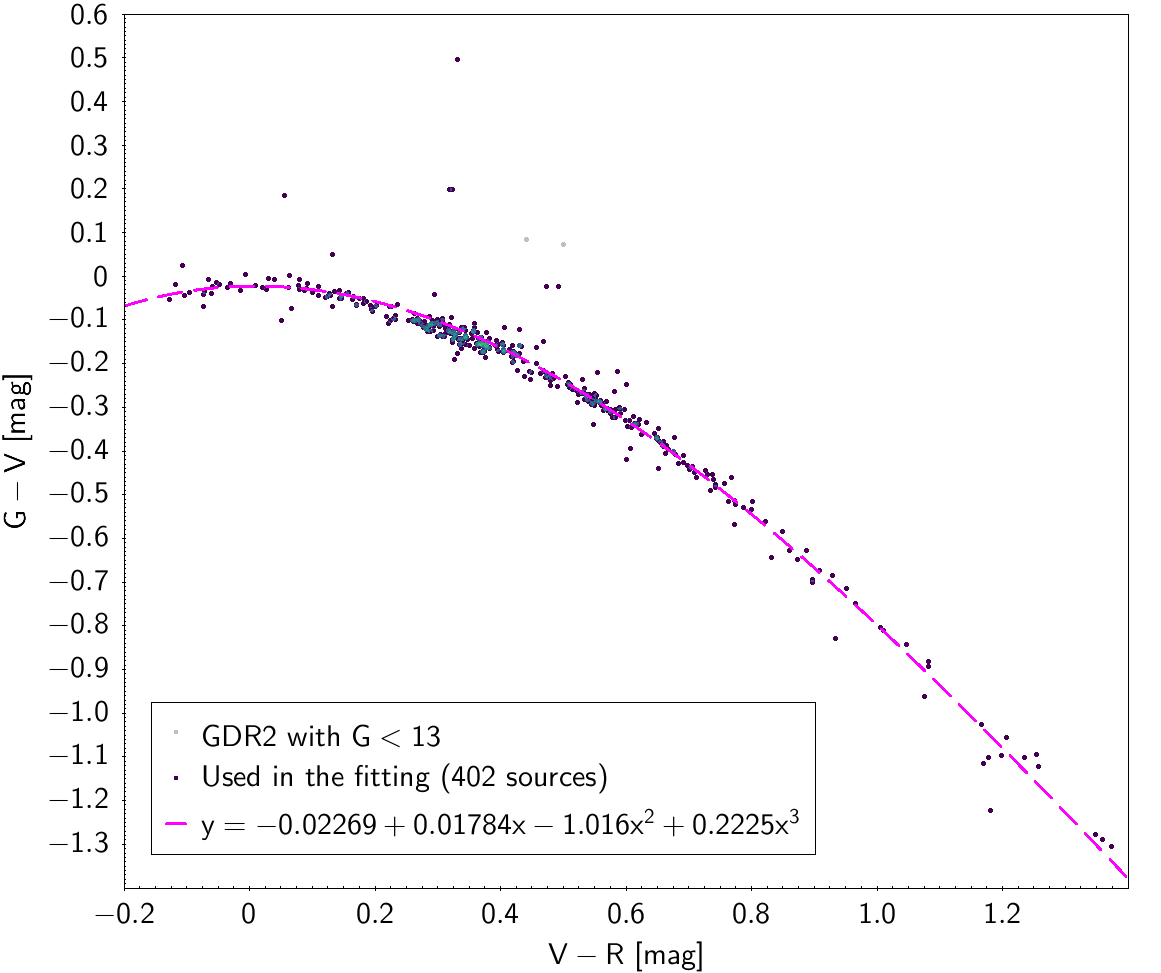
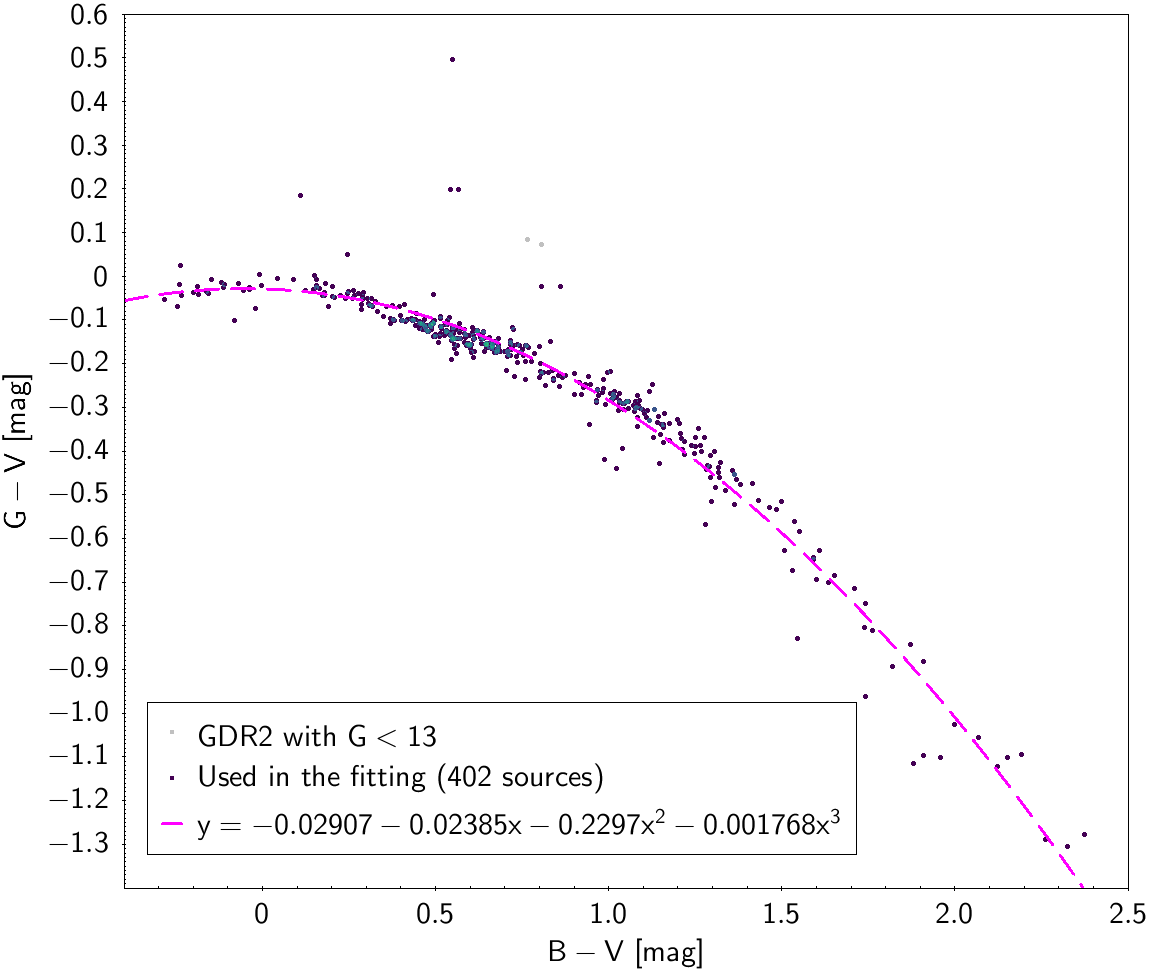
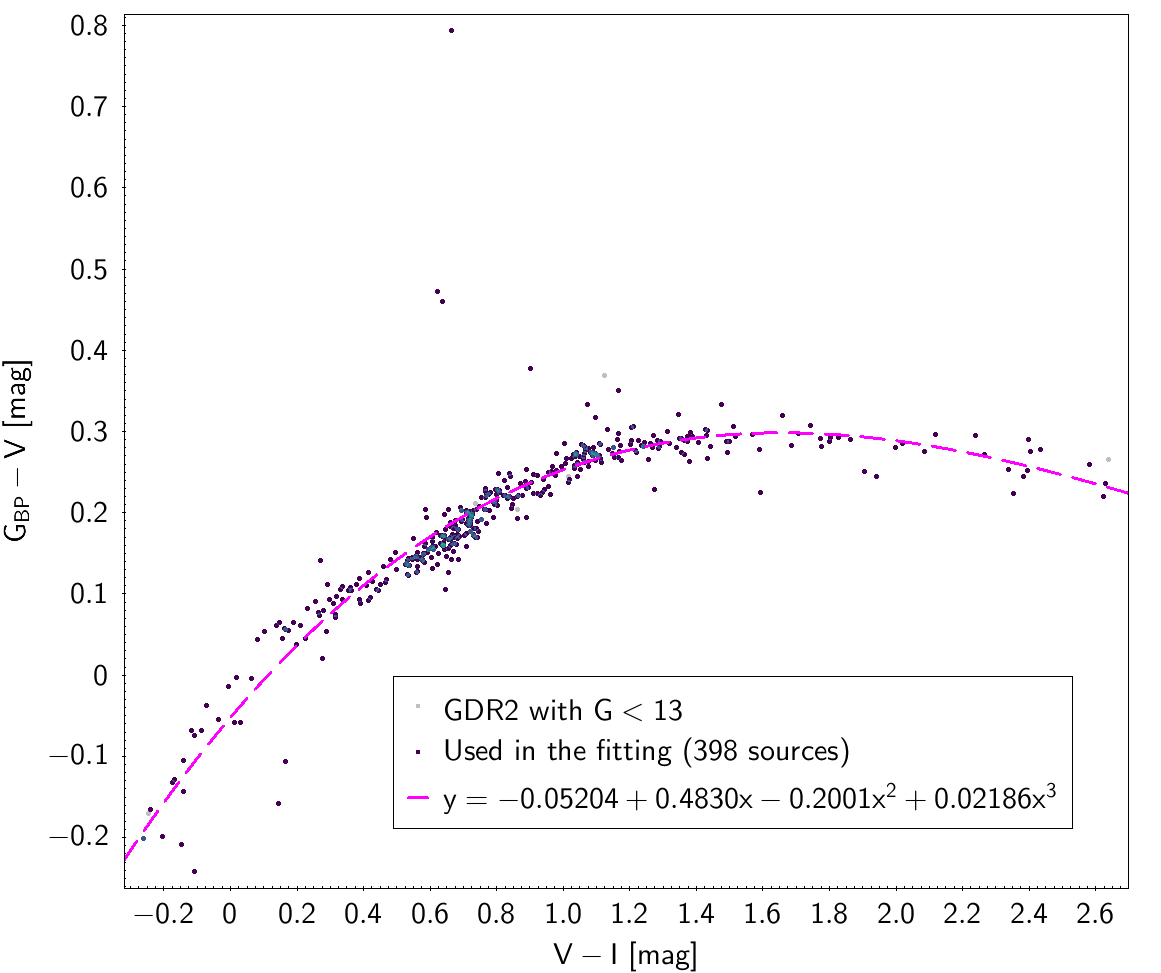
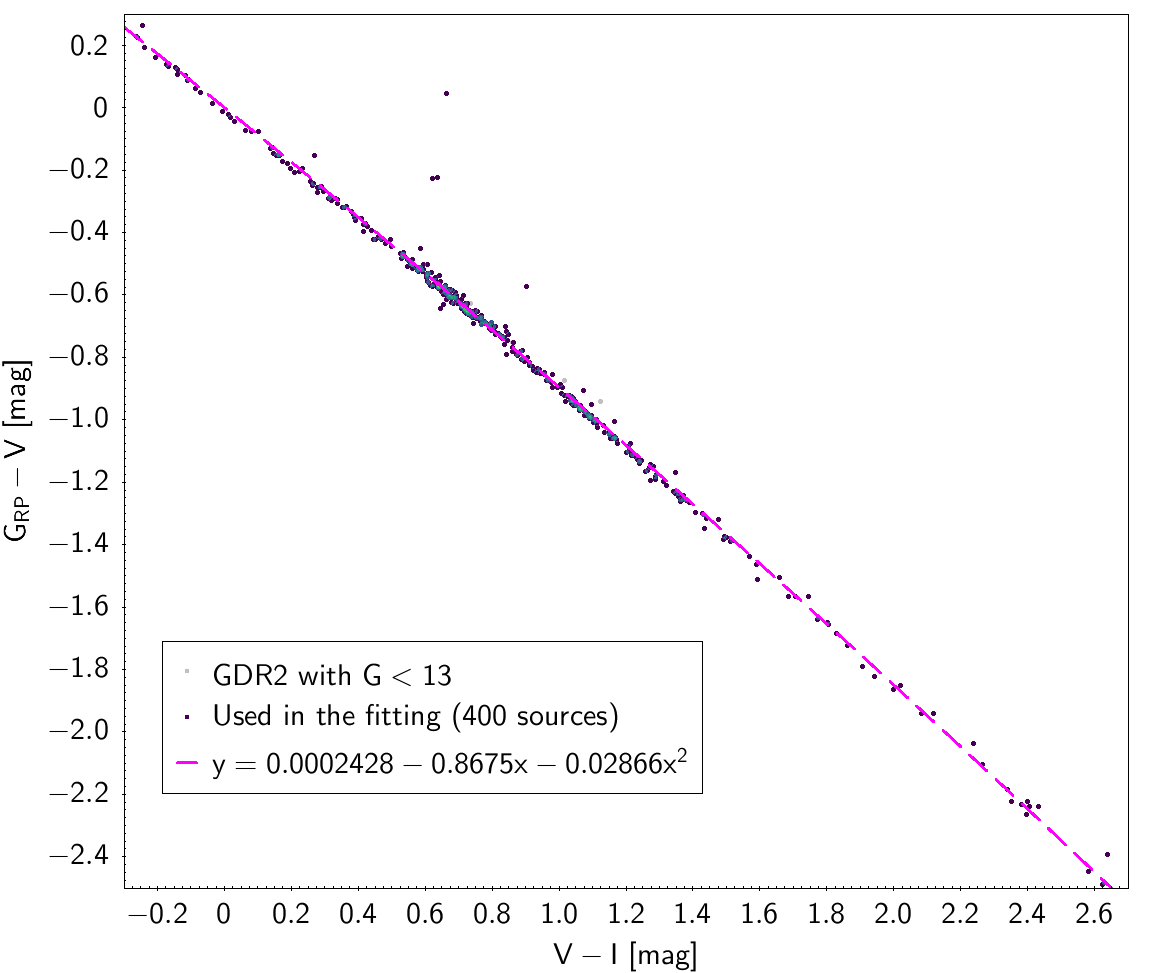
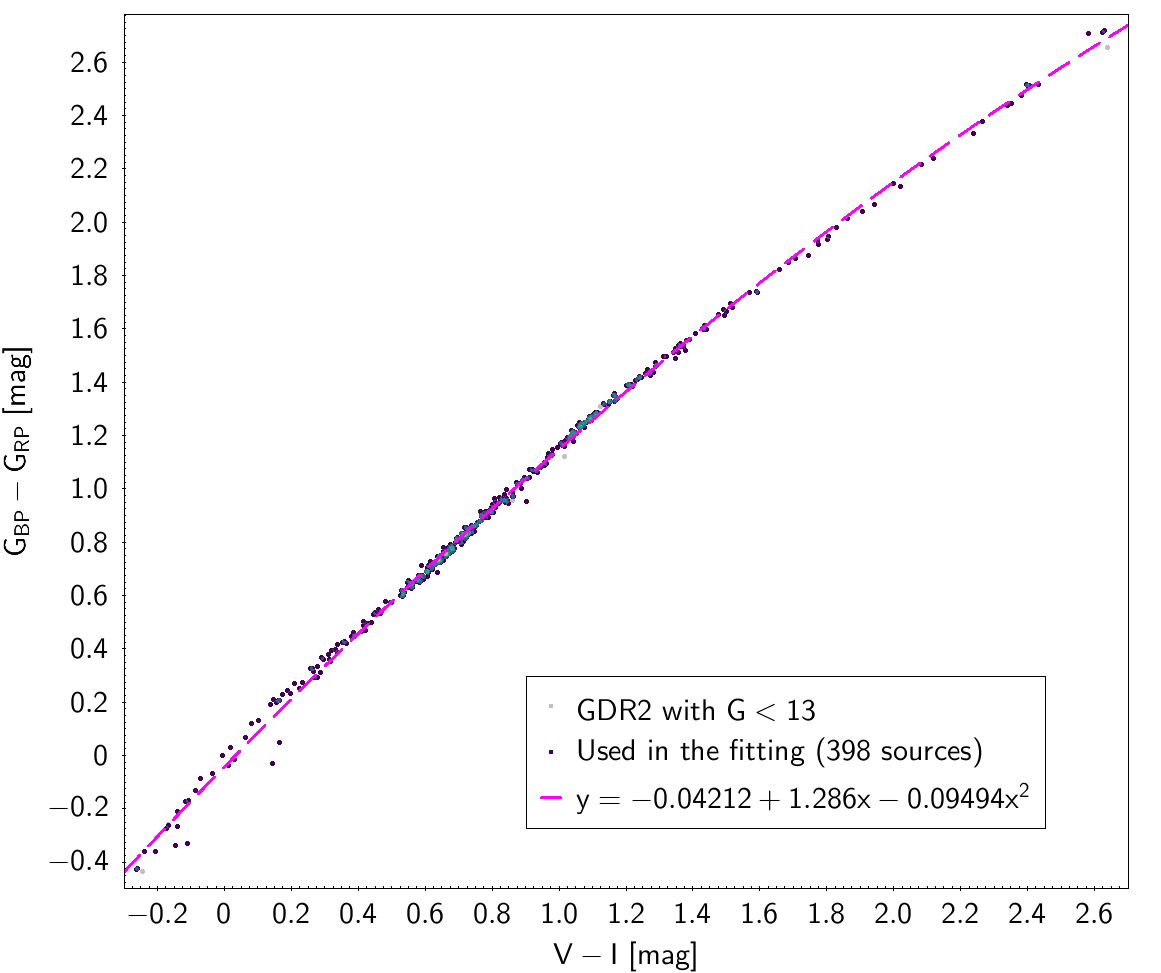
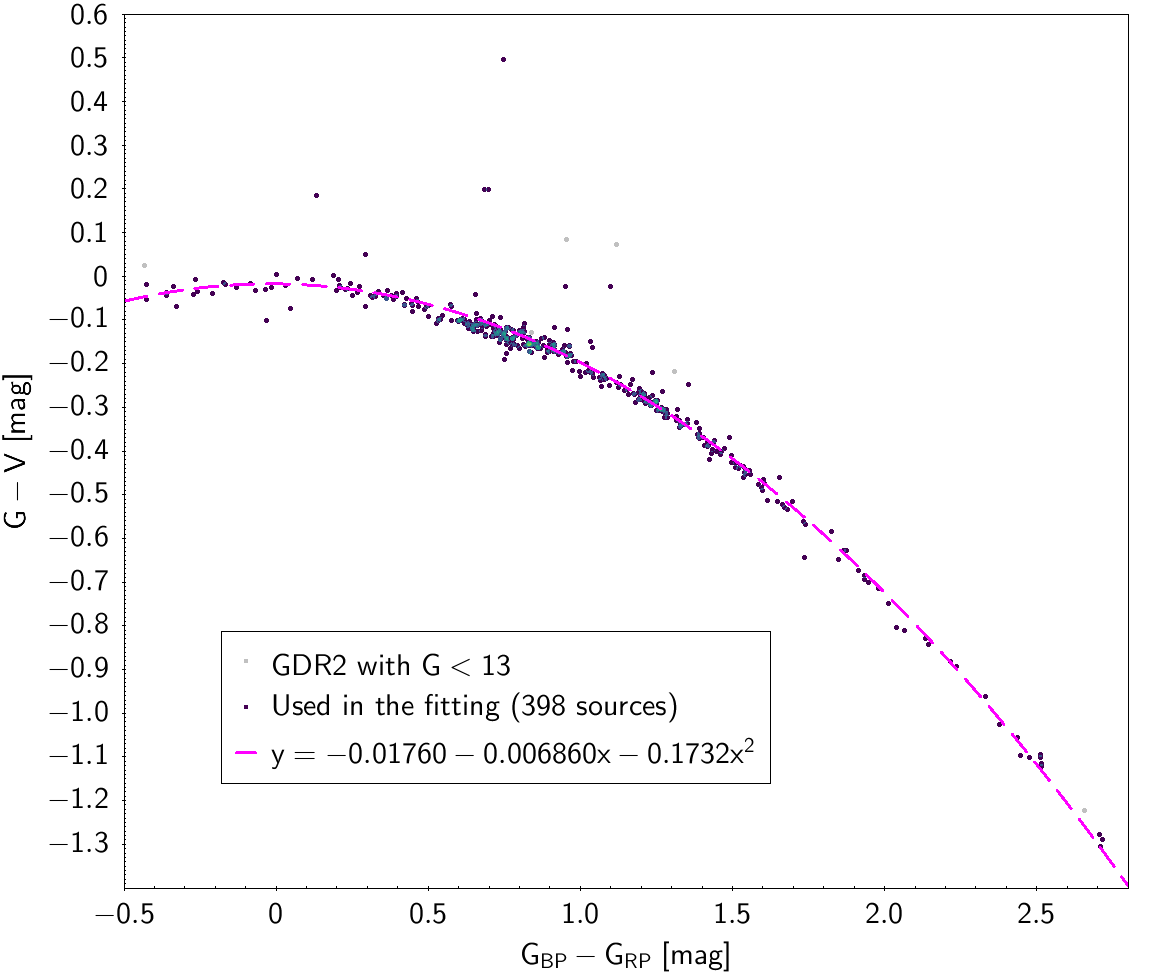
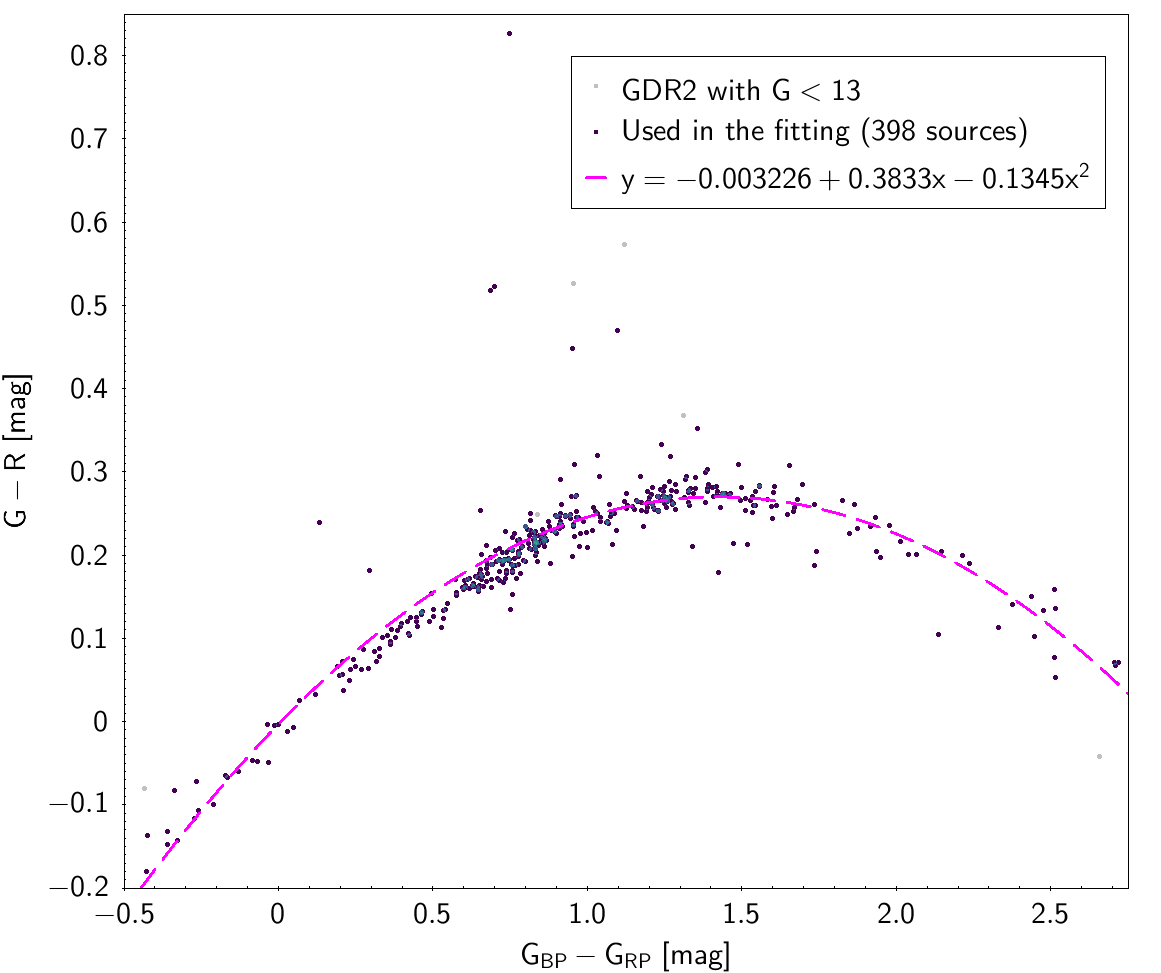
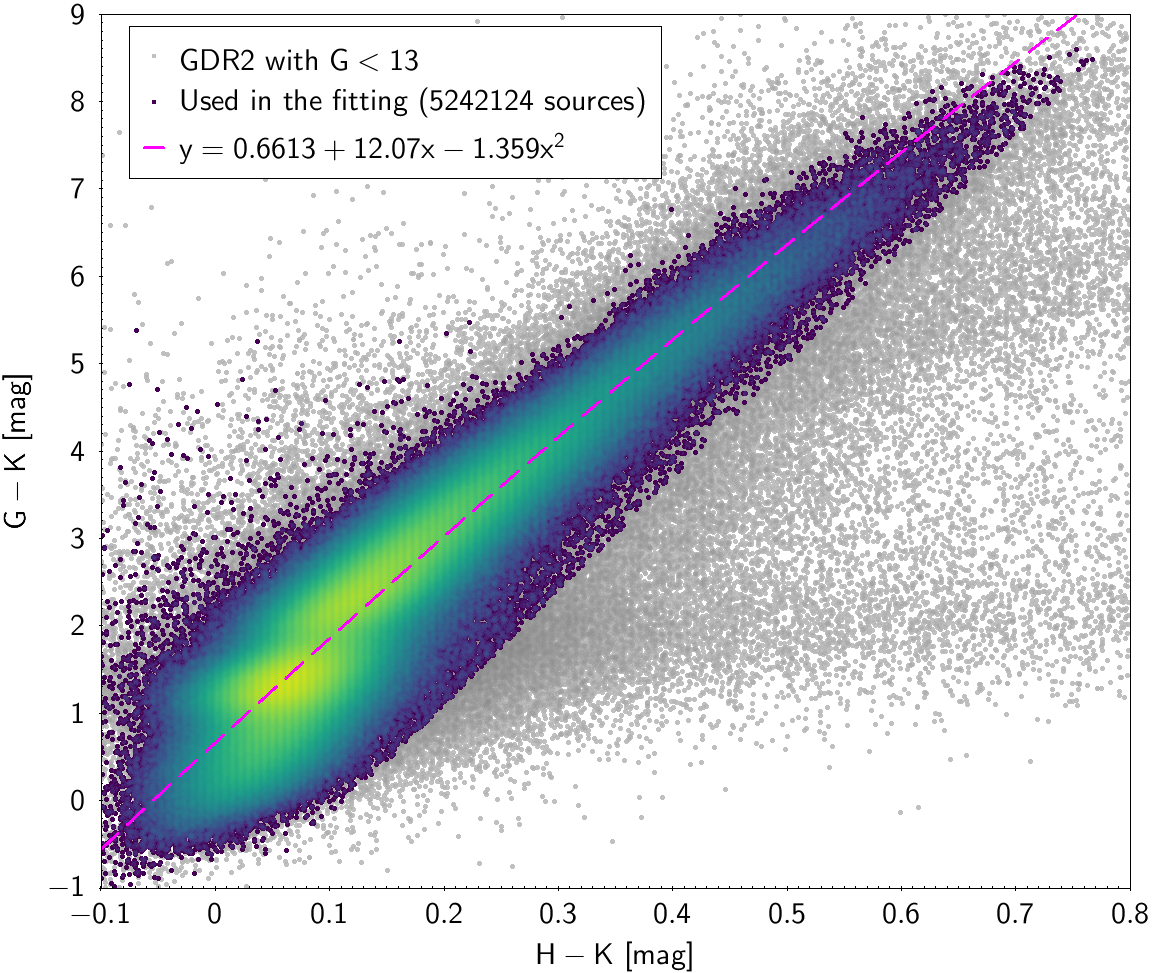
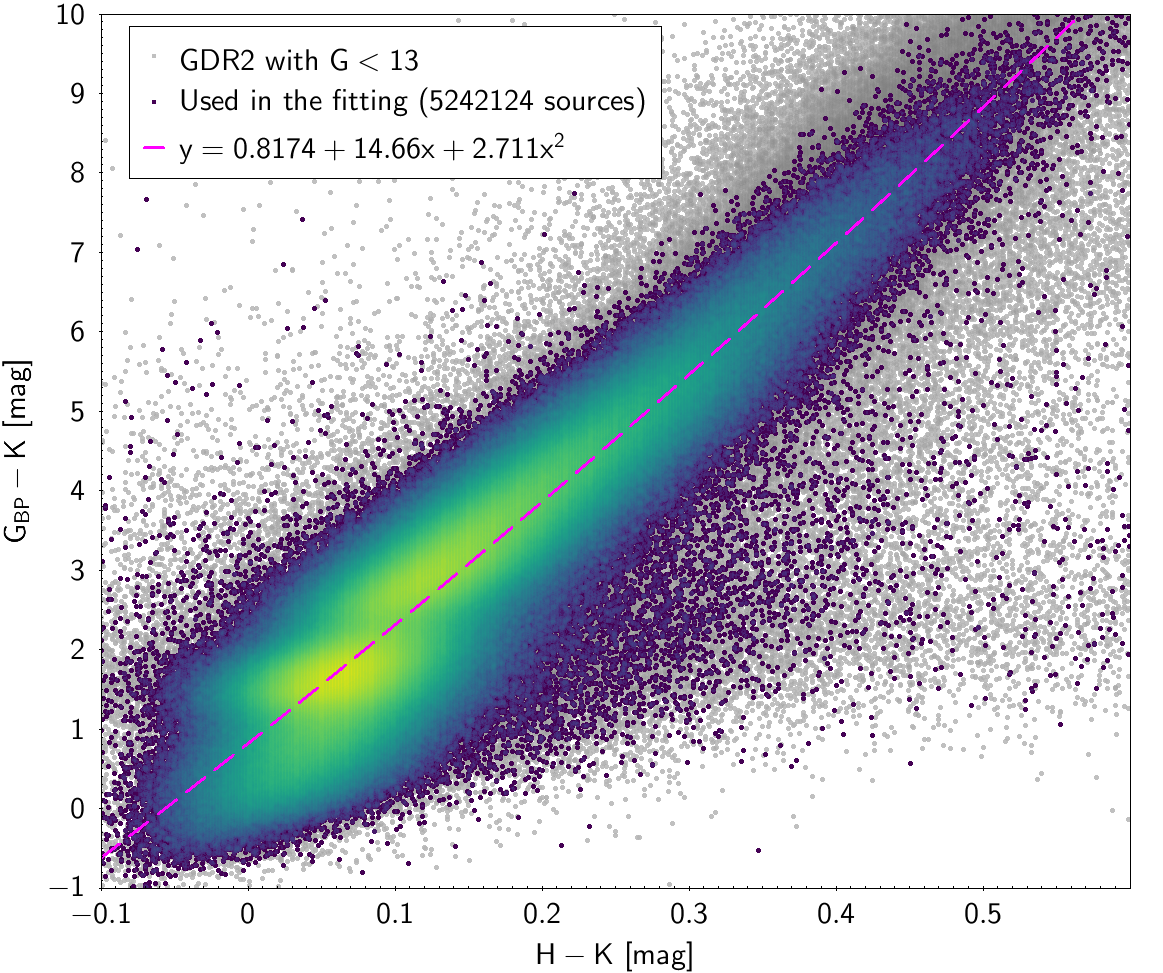
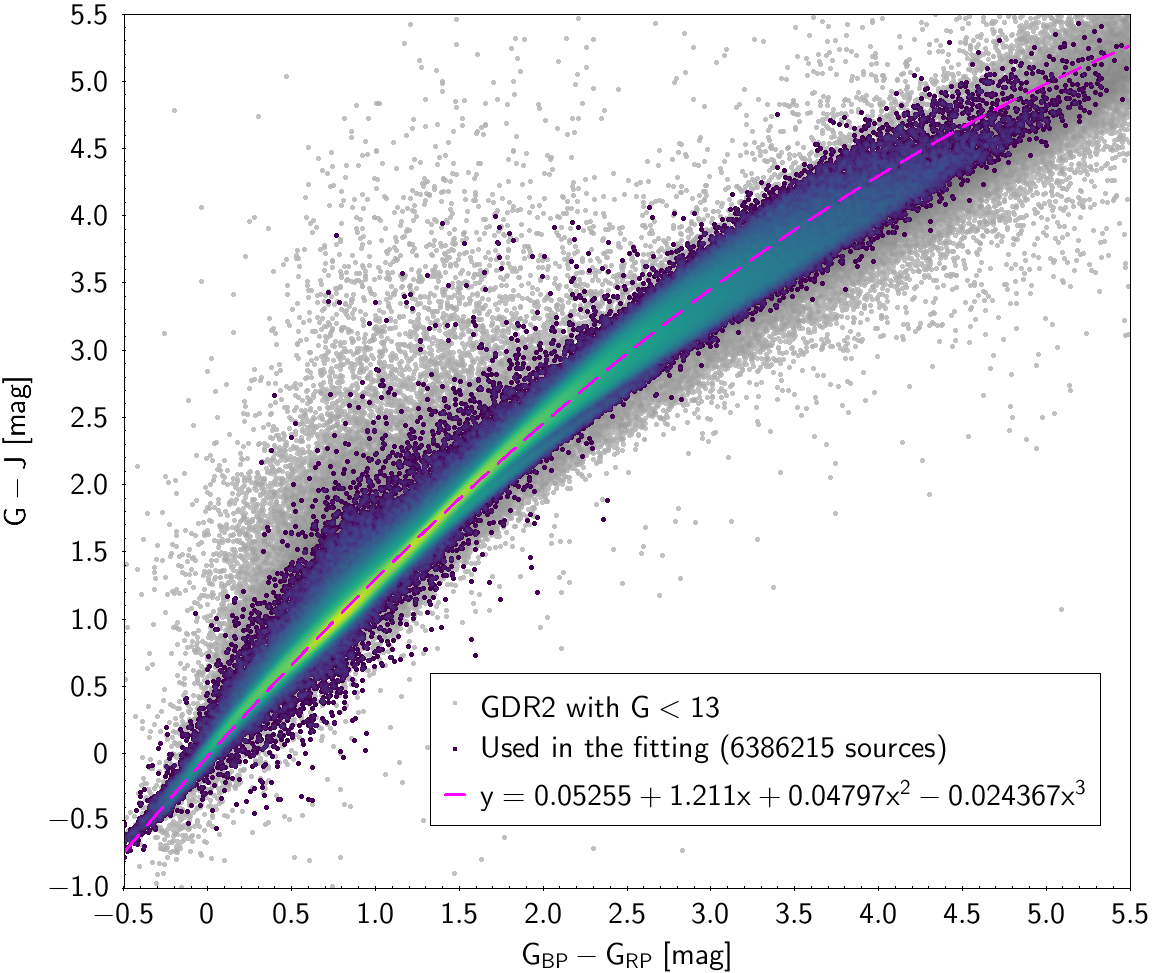
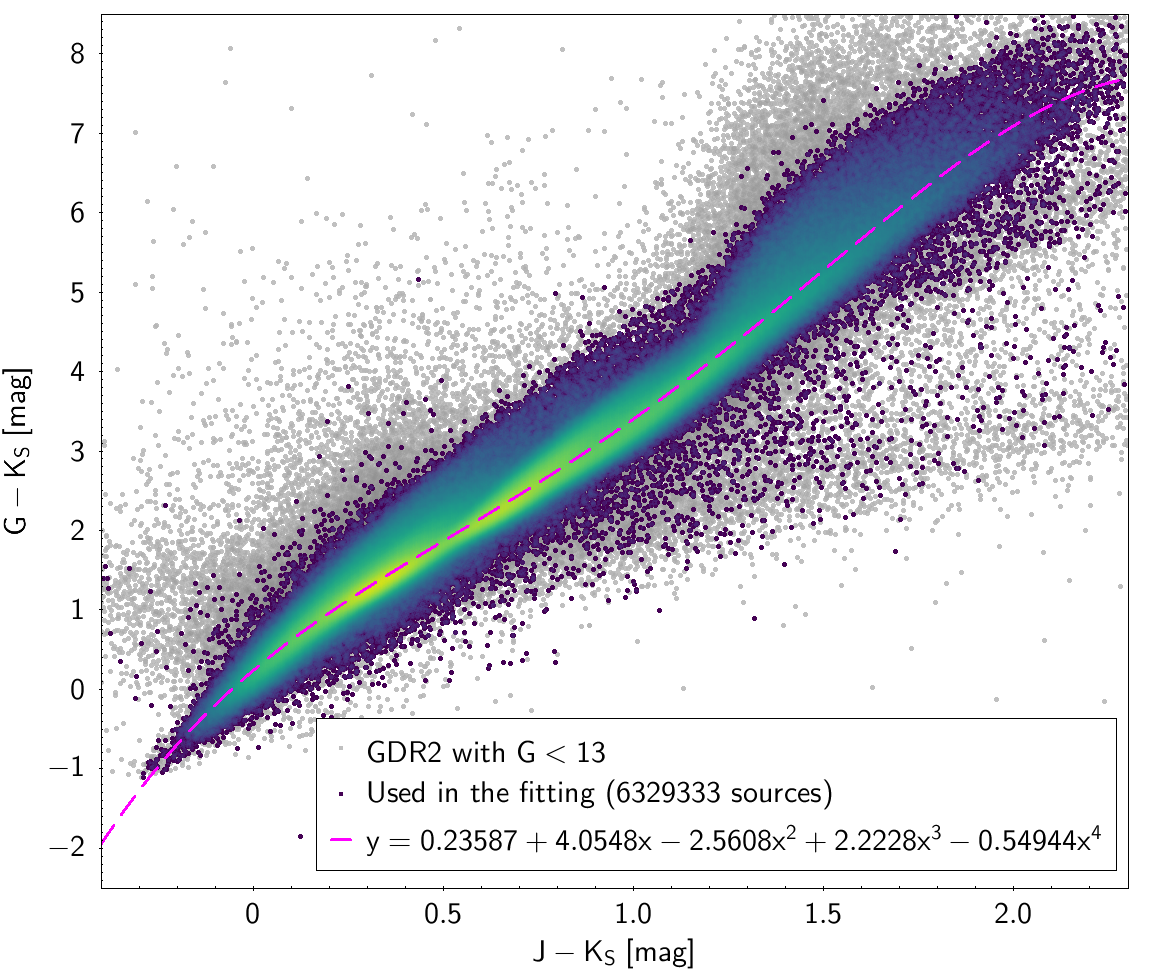
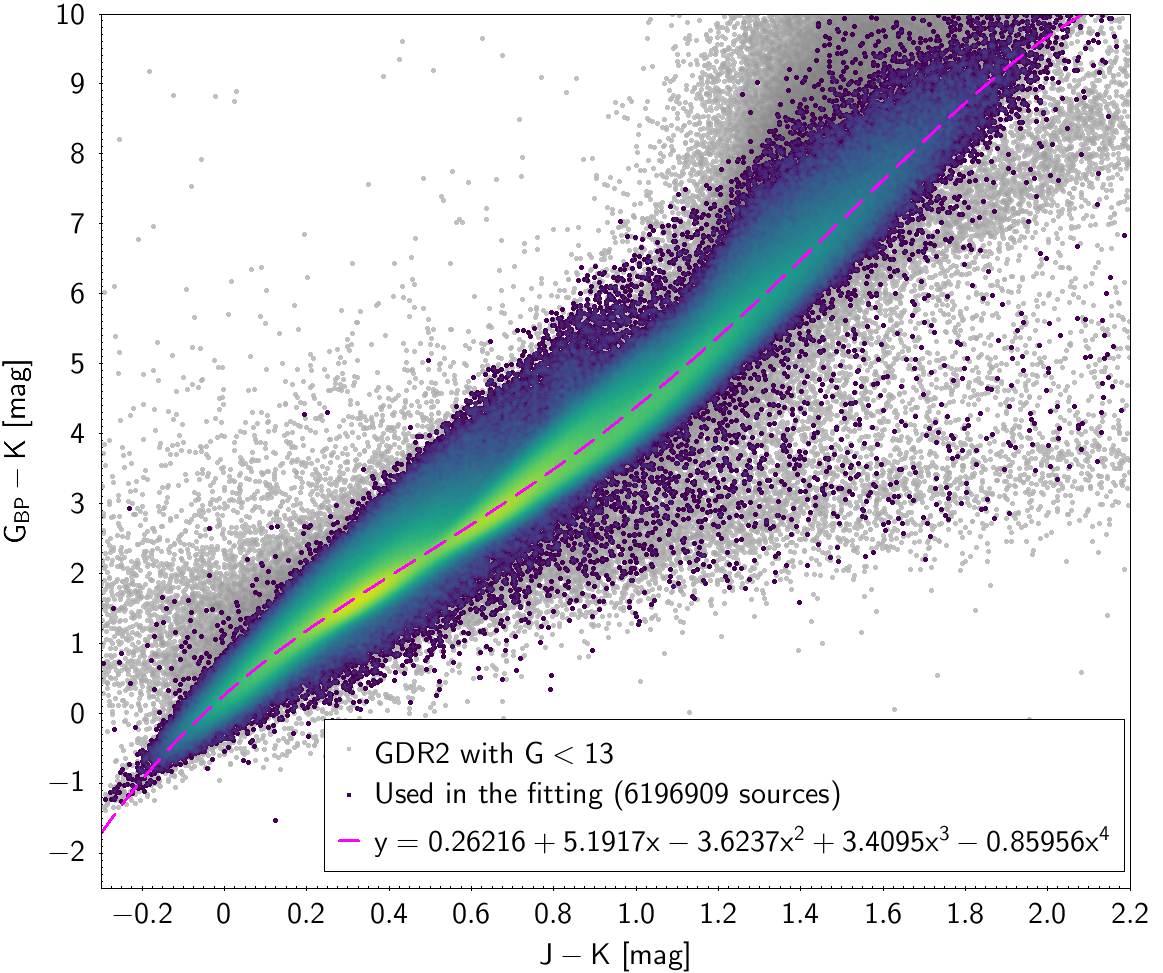
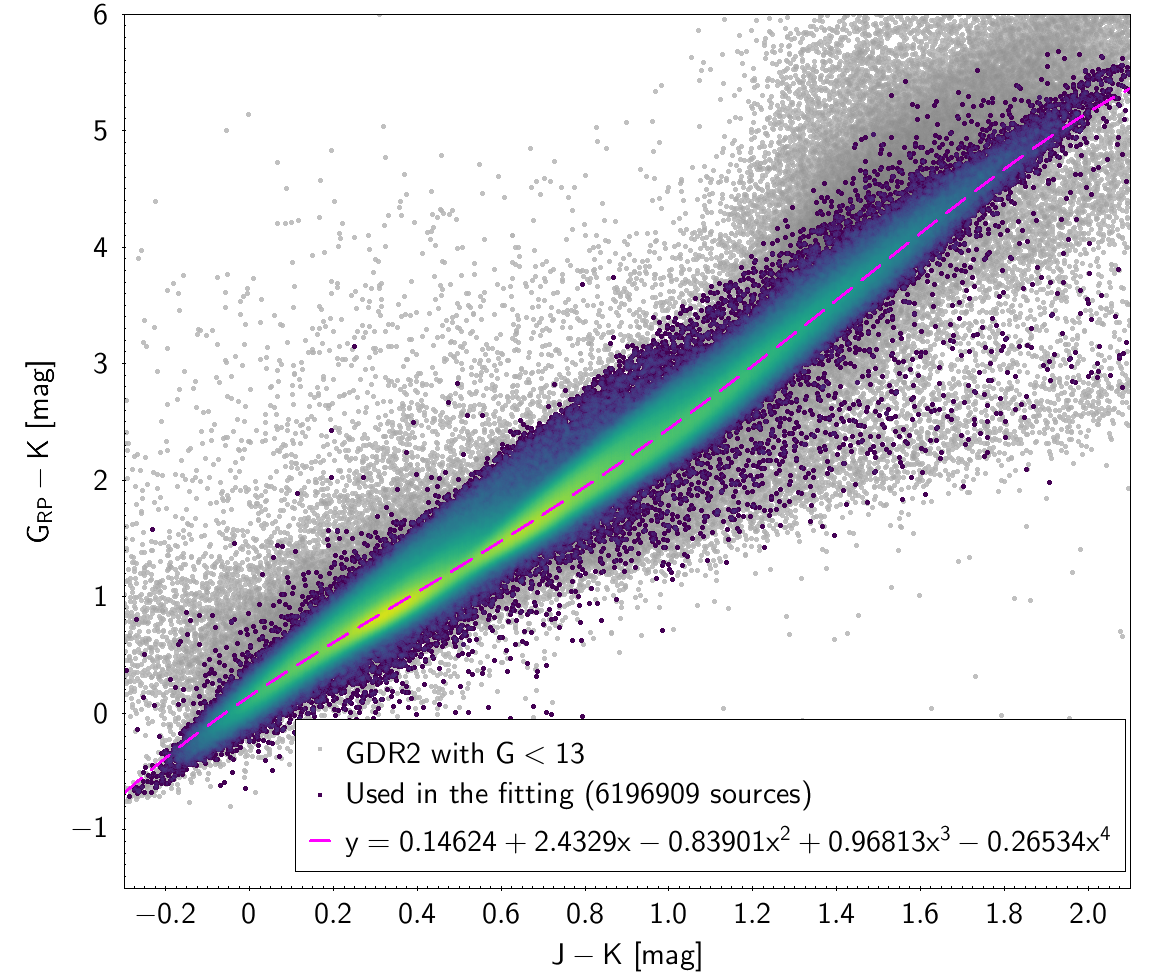
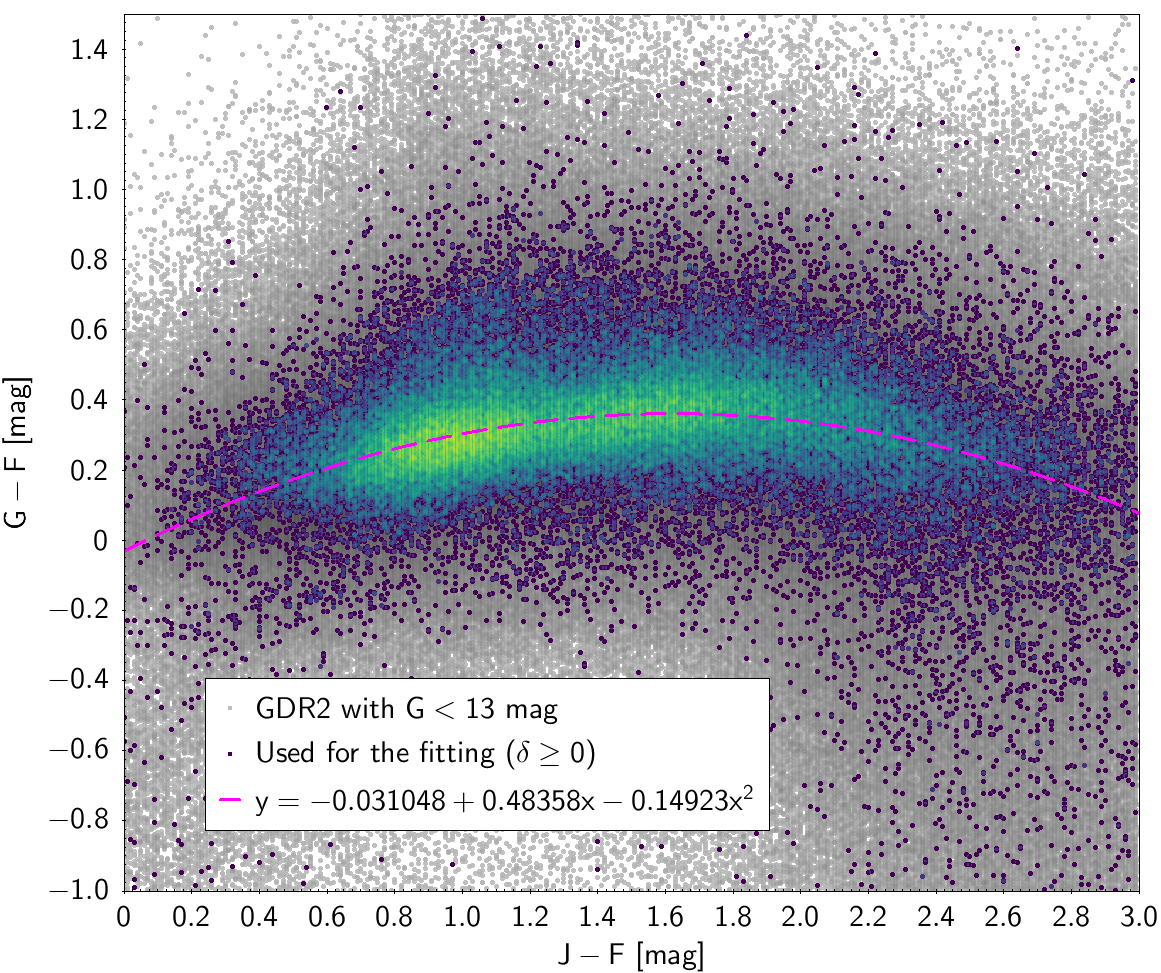
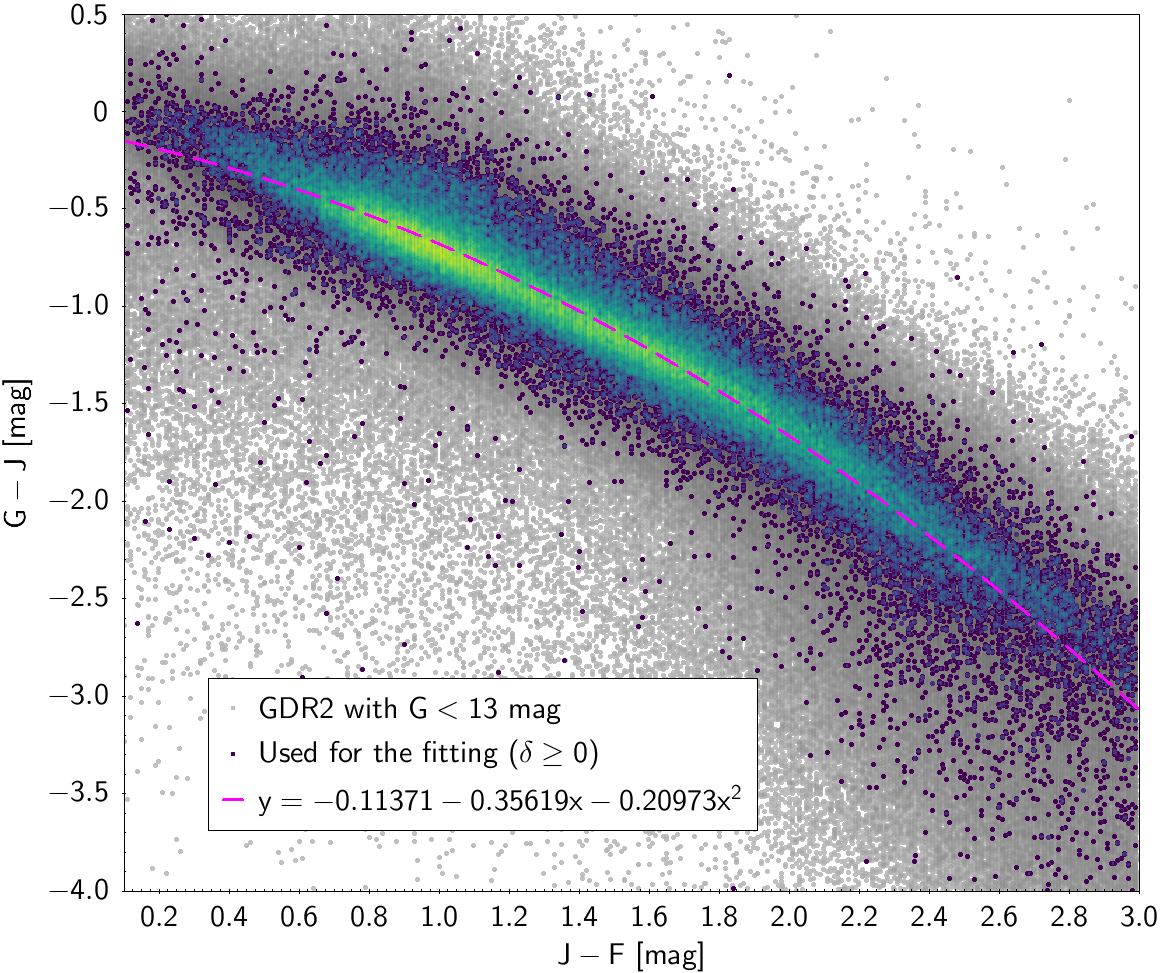
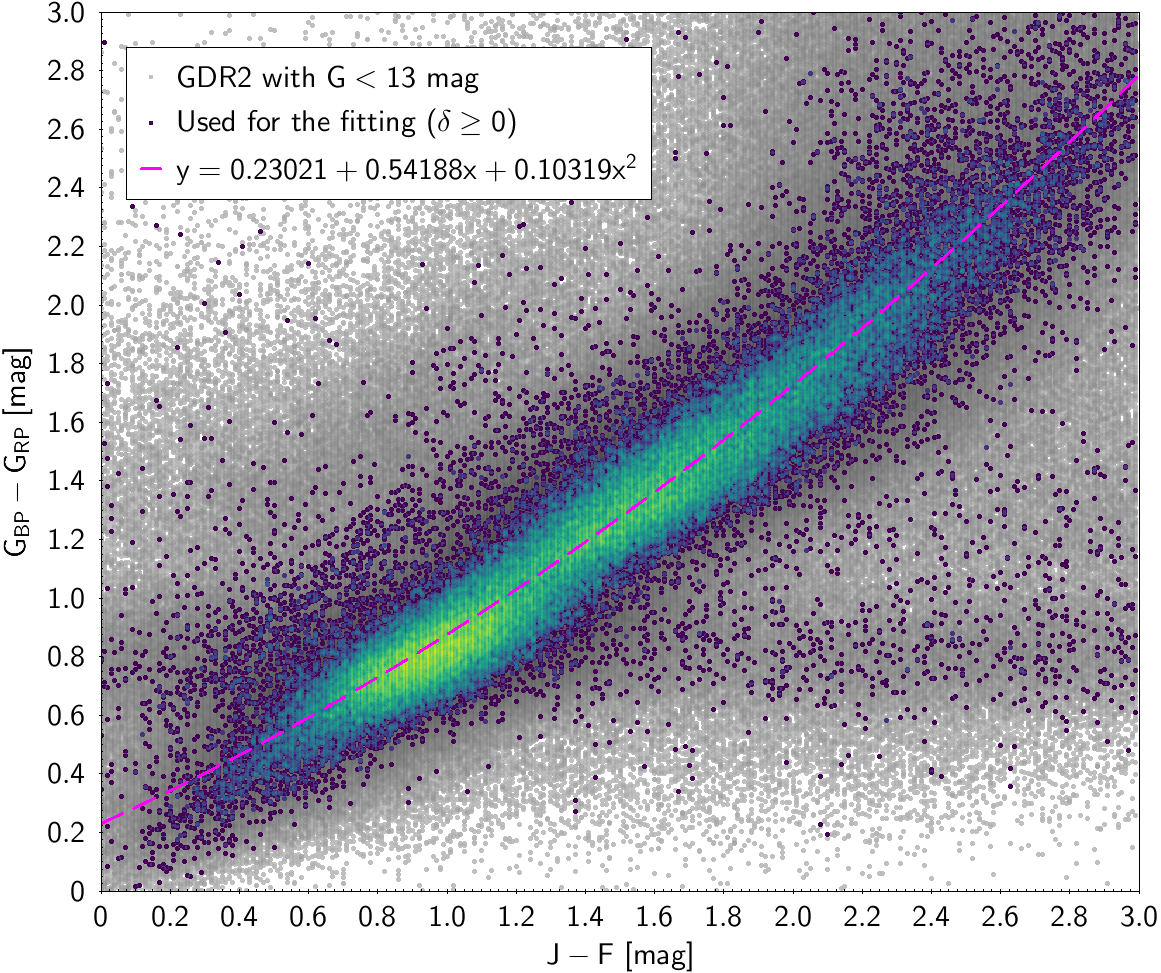
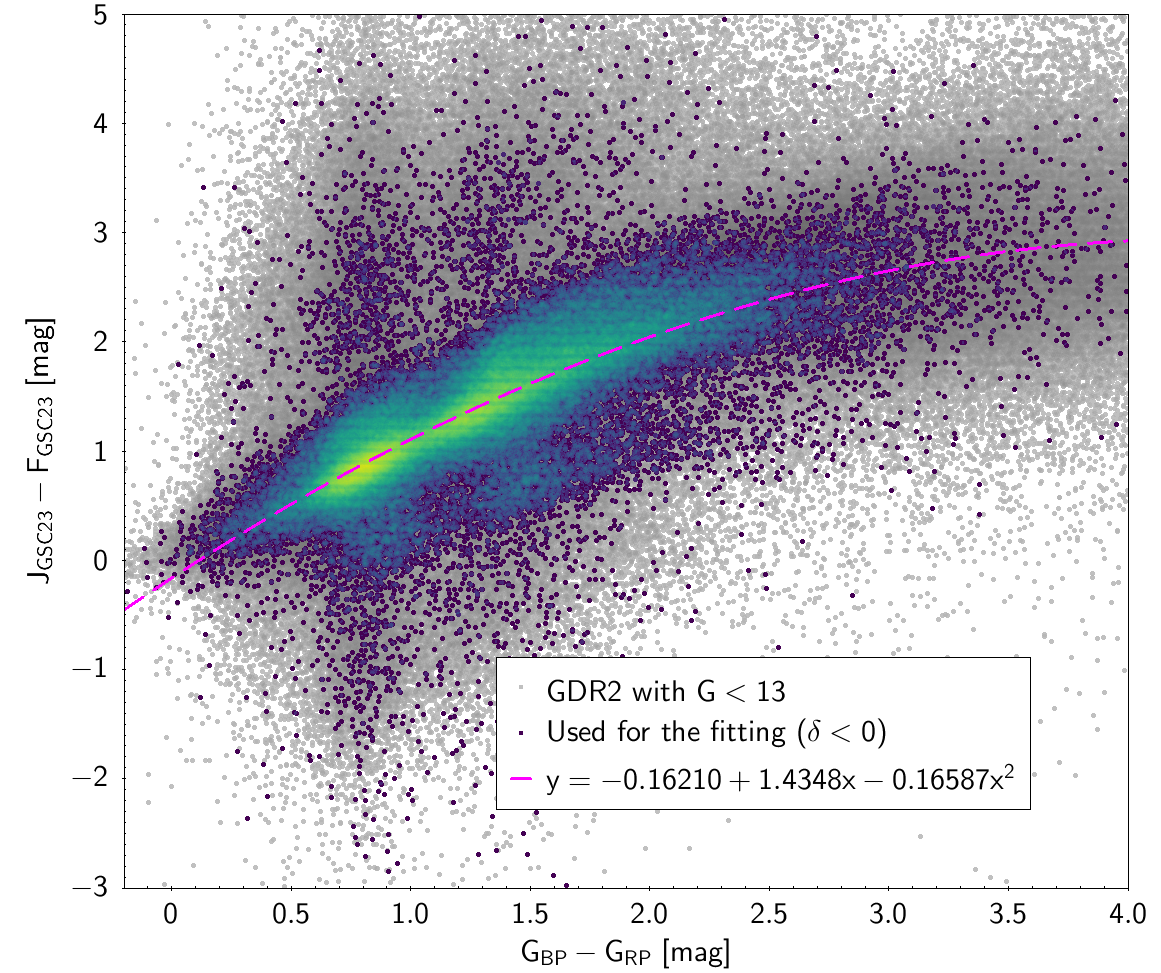
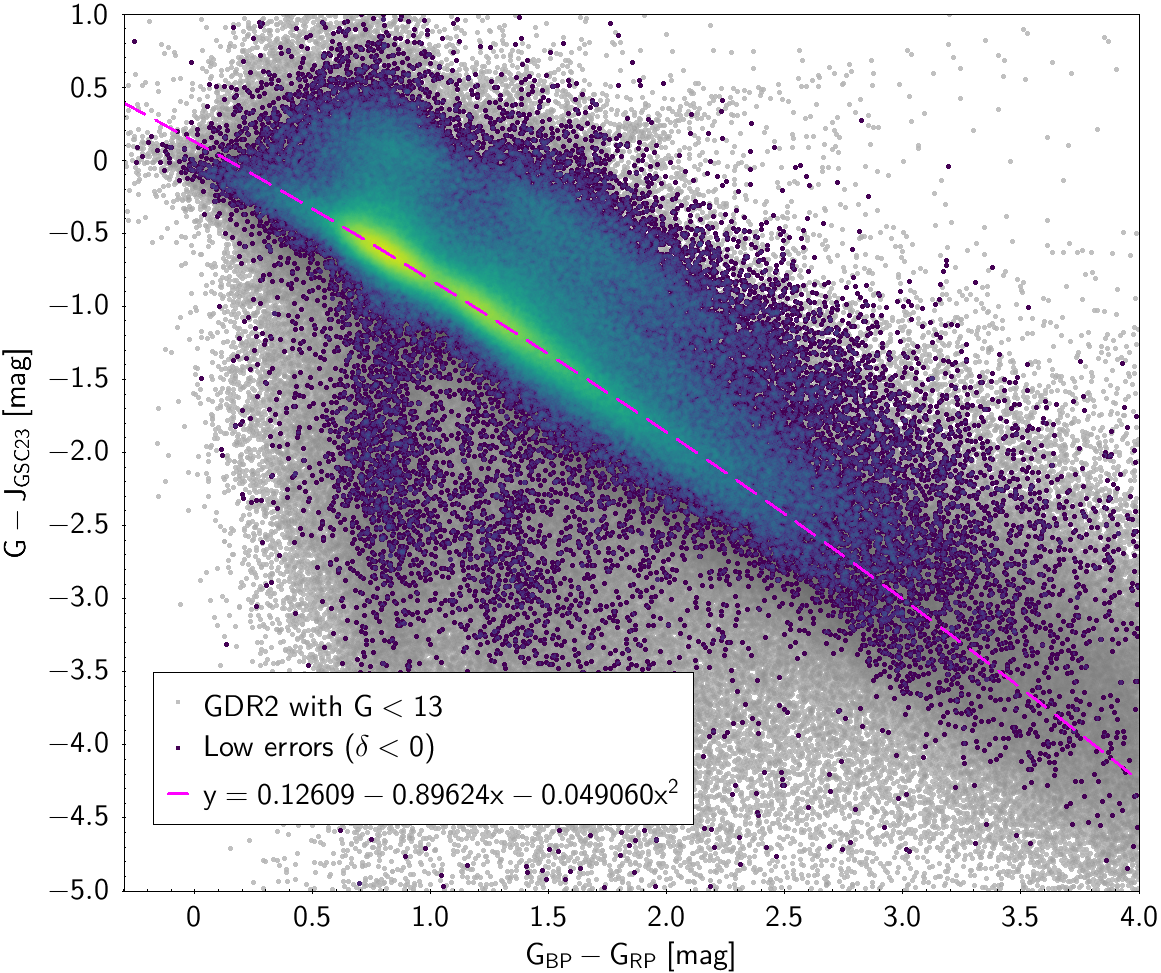
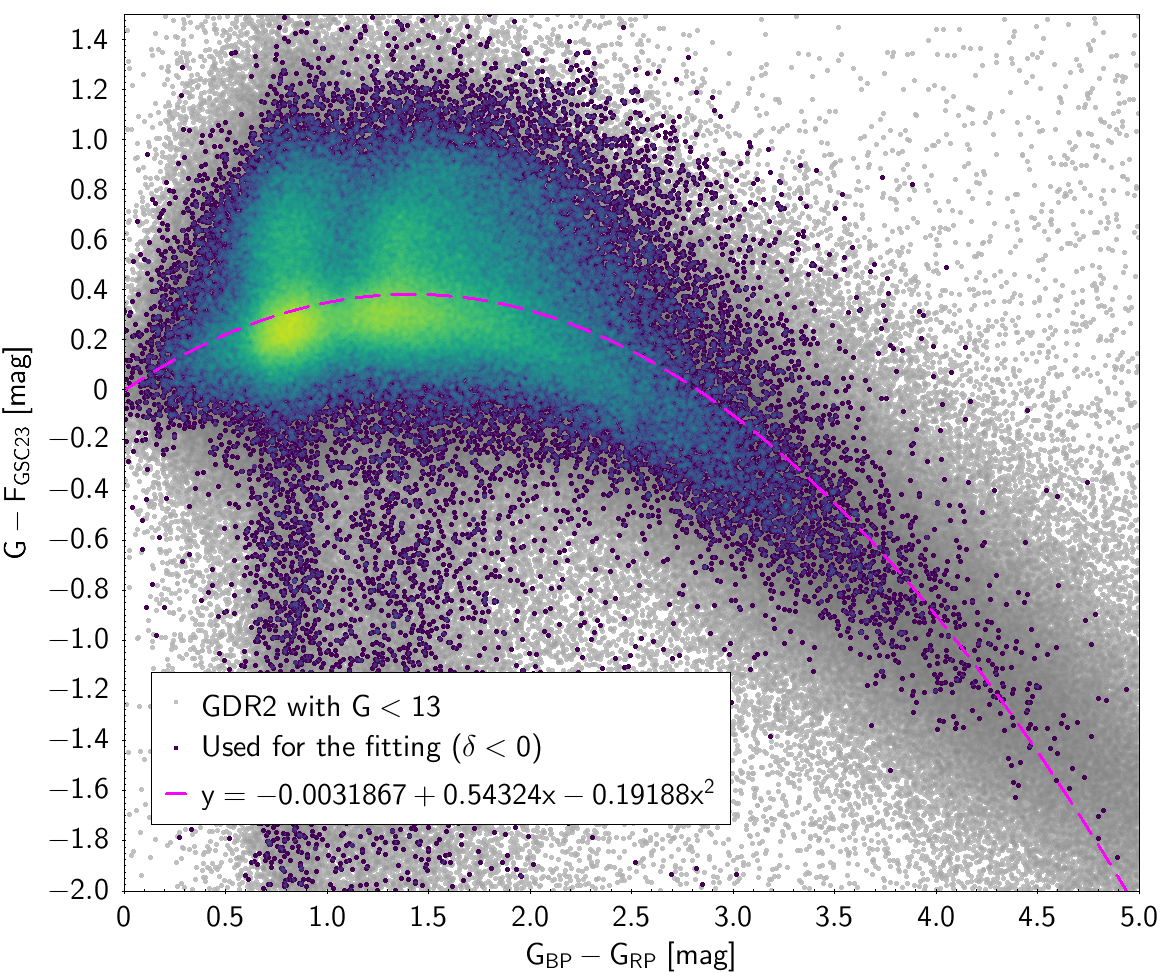
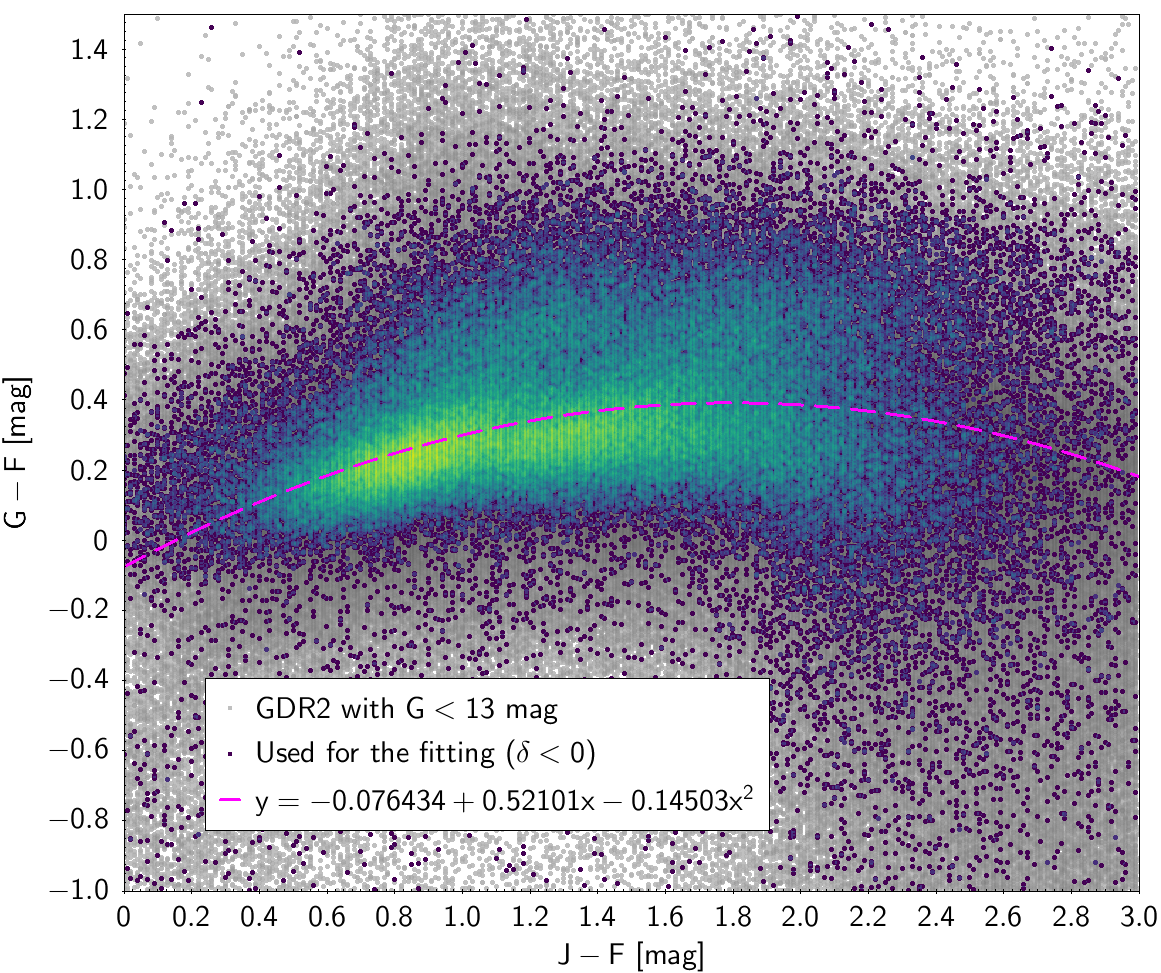
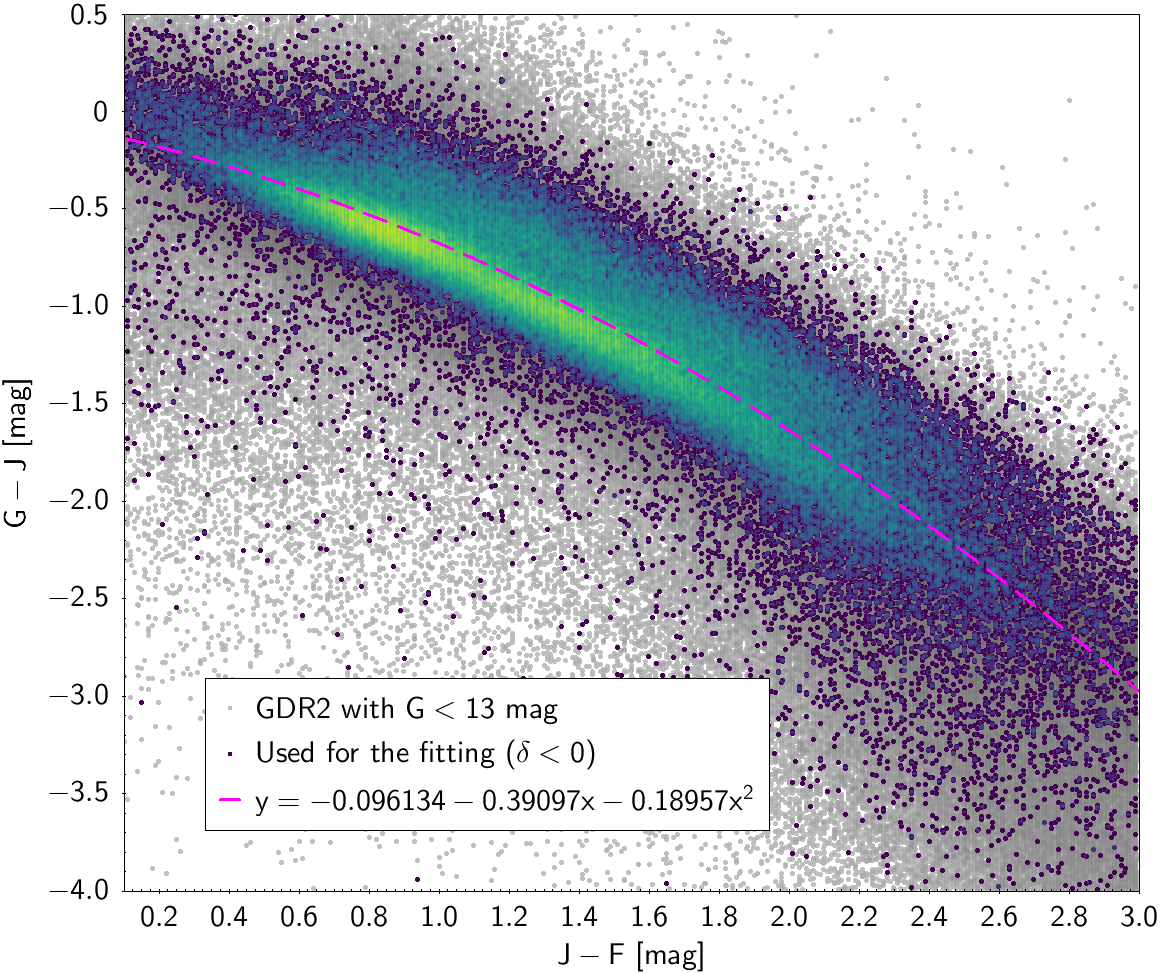
In order to obtain cleaner fittings, some filtering criteria were added to produce each colour-colour diagram. The data filtering to produce the photometric relationships can be checked in Table 5.5 and Table 5.6. The polynomial coefficients obtained with the resulting sources are included in Table 5.7 and Table 5.8. The validity of these fittings is, of course, only applicable in the colour intervals used to do the fitting (see Table 5.9).
| Tycho-2 filtering | ||
| Non-variable sources, , | ||
| , , | 345 837 sources | |
| , | ||
| , , , | 529 127 sources | |
| , , , | 362 674 sources | |
| , , | 345 121 sources | |
| , , | 342 140 sources | |
| , , , | 340 775 sources | |
| Hipparcos filtering | ||
| Non-variable sources, , | ||
| , , , , | 69 616 sources | |
| , , | 78 012 sources | |
| , , , | 76 930 sources | |
| , , | 76 428 sources | |
| , , | 76 660 sources | |
| , , | 76 037 sources | |
| SDSS12 filtering | ||
| Non-variable sources, , cl (stars), mag | ||
| diagram | , mag, mag, , mag, | 279 458 sources |
| diagram | , mag, mag, , mag | 296 068 sources |
| diagram | , mag, mag, , mag | 375 806 sources |
| diagram | , mag, mag, , mag | 375 593 sources |
| diagram | , mag, mag, , , mag | 149 631 sources |
| , | ||
| diagram | , mag, mag, , , mag | 286 712 sources |
| diagram | , mag, , mag, , , , mag | 147 779 sources |
| diagram | mag, , mag, mag | 161 123 sources |
| , , mag, | ||
| diagram | mag, , mag, mag | 149 928 sources |
| , , mag | ||
| diagram | mag, , mag, mag | 186 540 sources |
| , , mag, | ||
| Johnson-Cousins filtering | ||
| Non-variable sources, , | ||
| 402 sources | ||
| 398 sources | ||
| 400 sources | ||
| , | 398 sources | |
| 402 sources | ||
| 402 sources | ||
| , , | 398 sources | |
| , , | 398 sources | |
| , , | 398 sources | |
| 2MASS filtering | ||
| Non-variable sources, , | ||
| , and , | 5 242 124 sources | |
| , and , | 5 177 073 sources | |
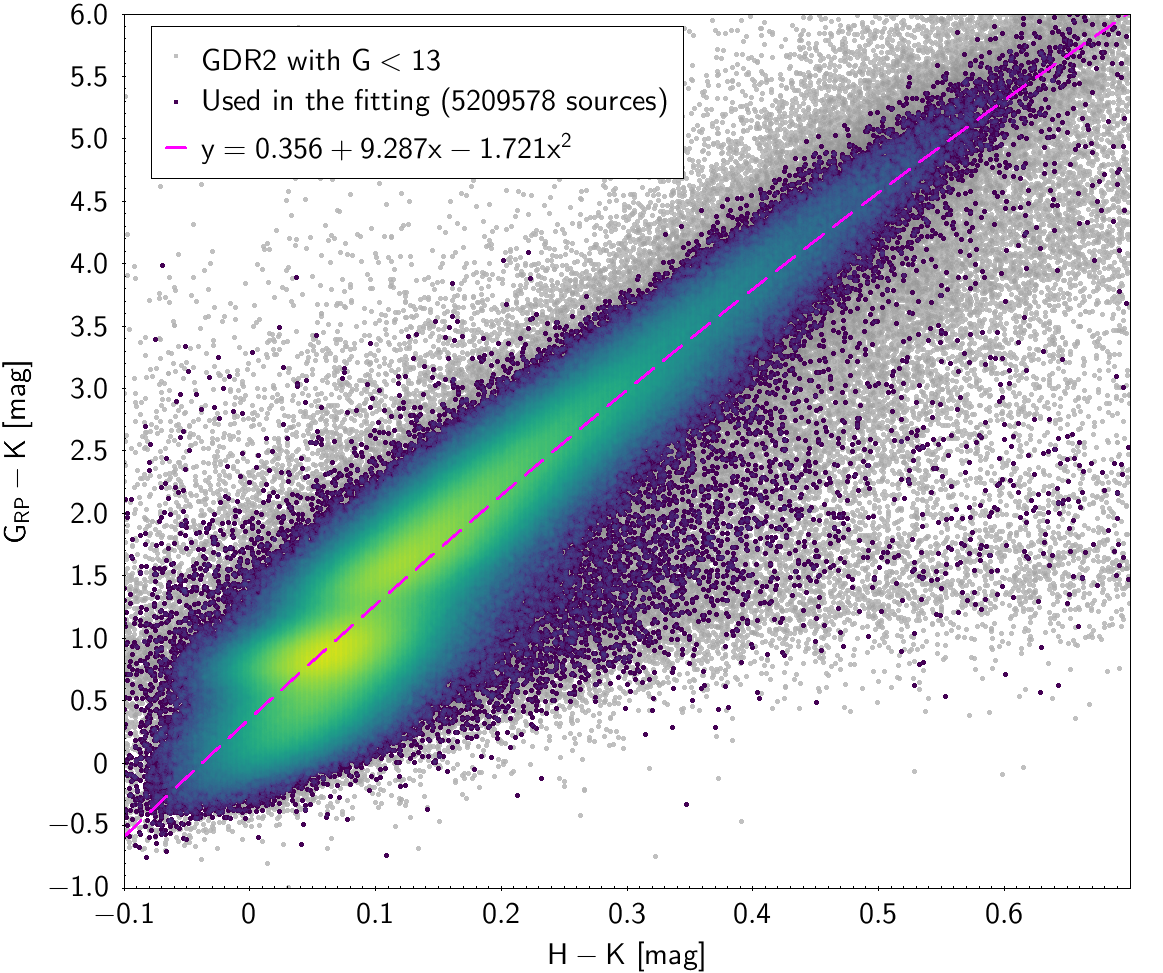
| , and | 5 209 578 sources | |
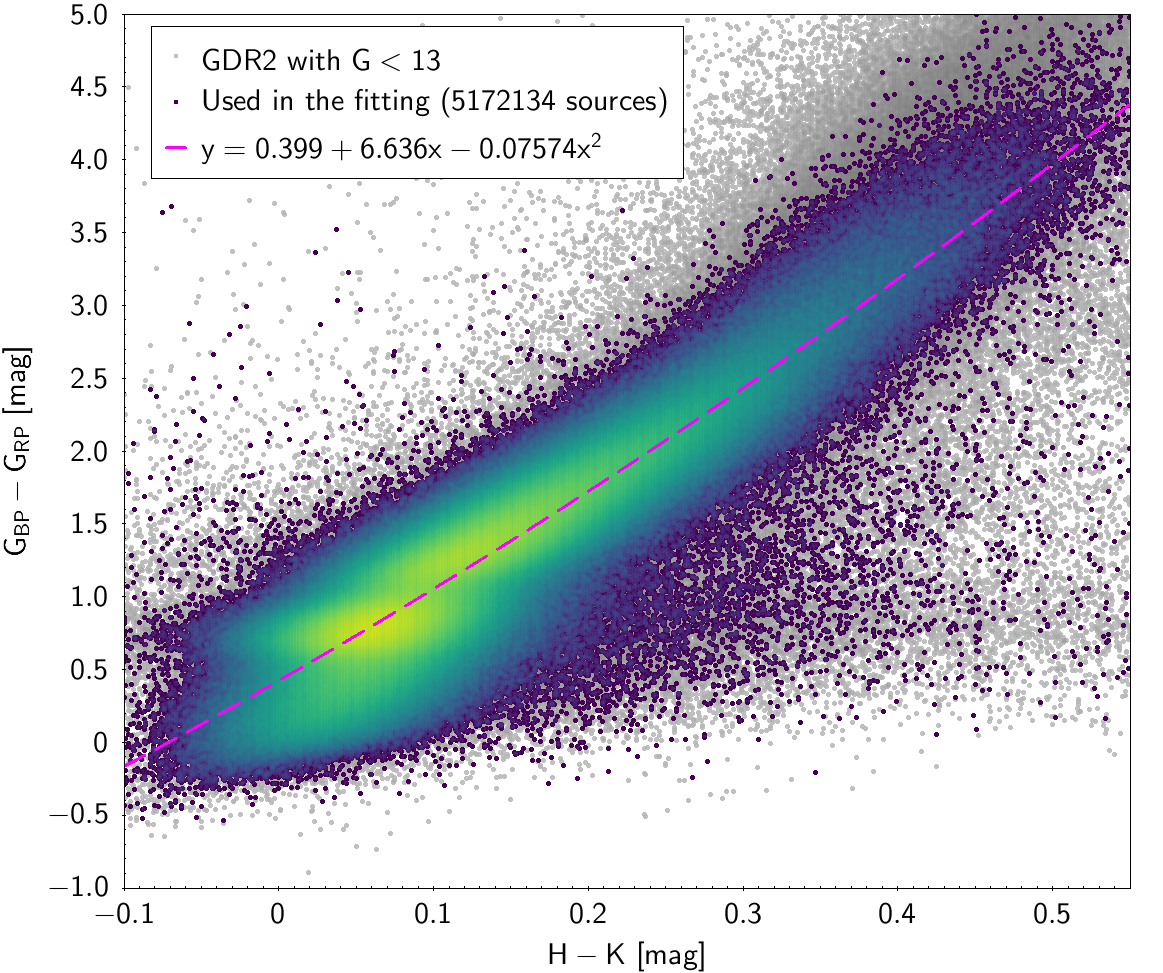
| and , and | 5 172 134 sources | |
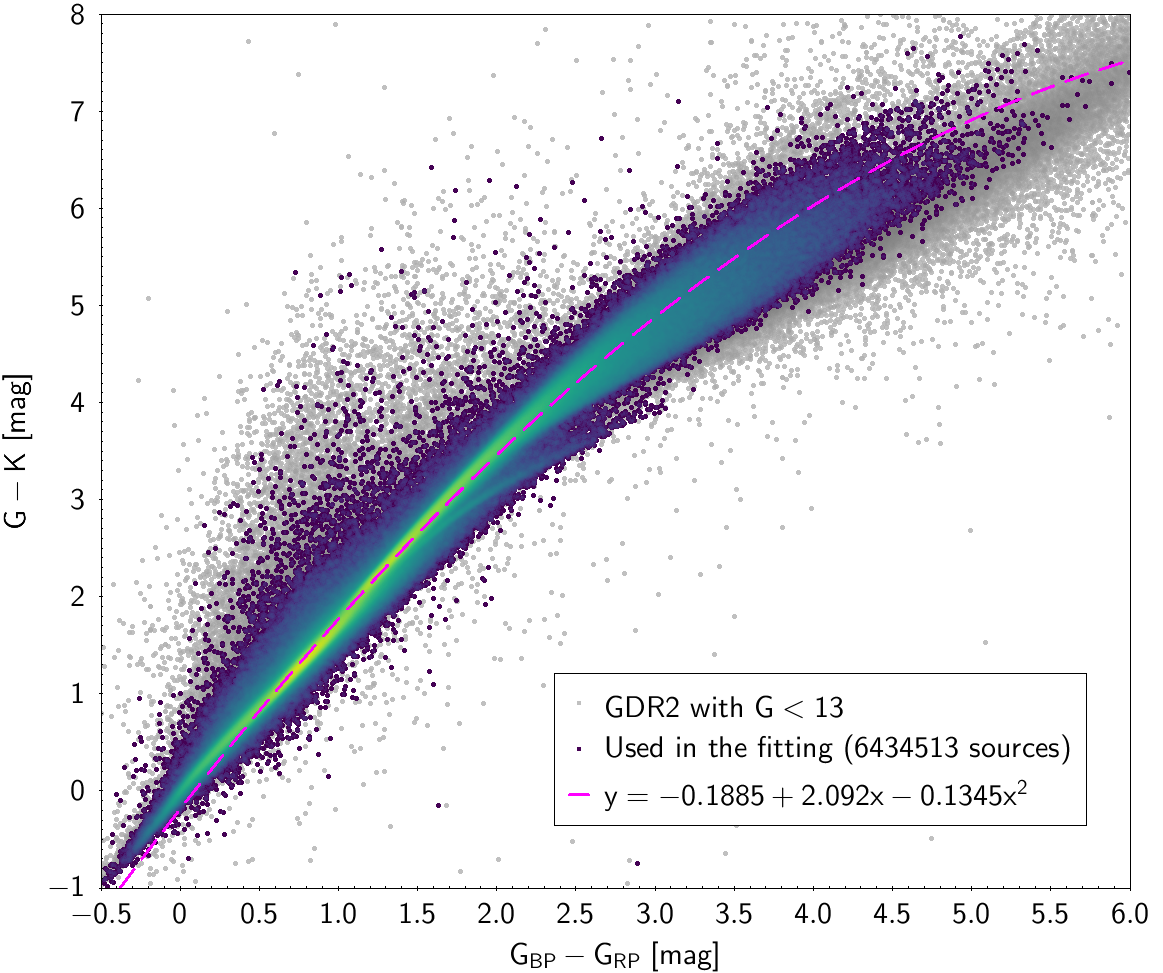
| , and , | 6 434 513 sources | |
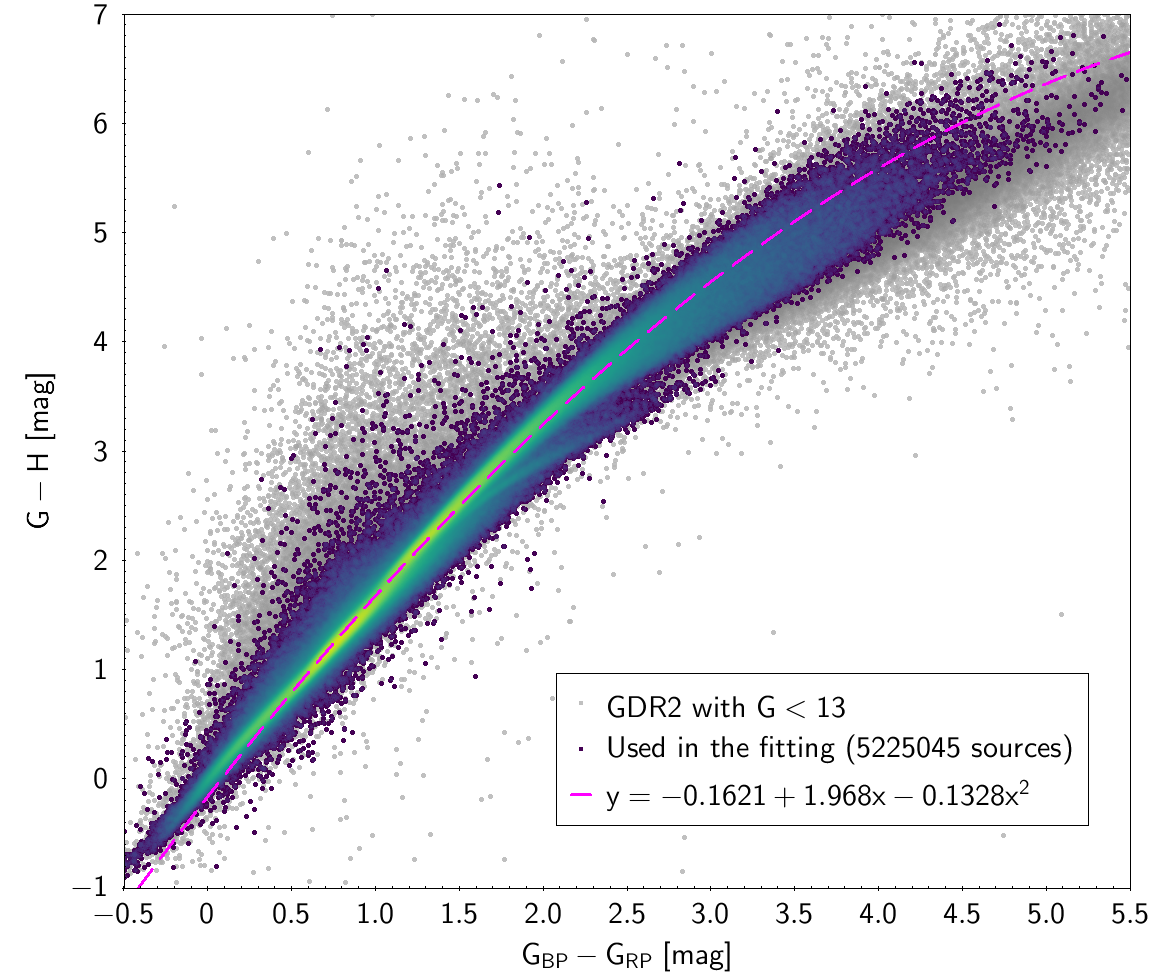
| , and , | 5 225 045 sources | |
| , and , | 6 386 215 sources | |
| , and , ”AAA” | 6 329 333 sources | |
| , and , ”AAA” | 6 196 909 sources | |
| , and , ”AAA” | 6 196 909 sources | |
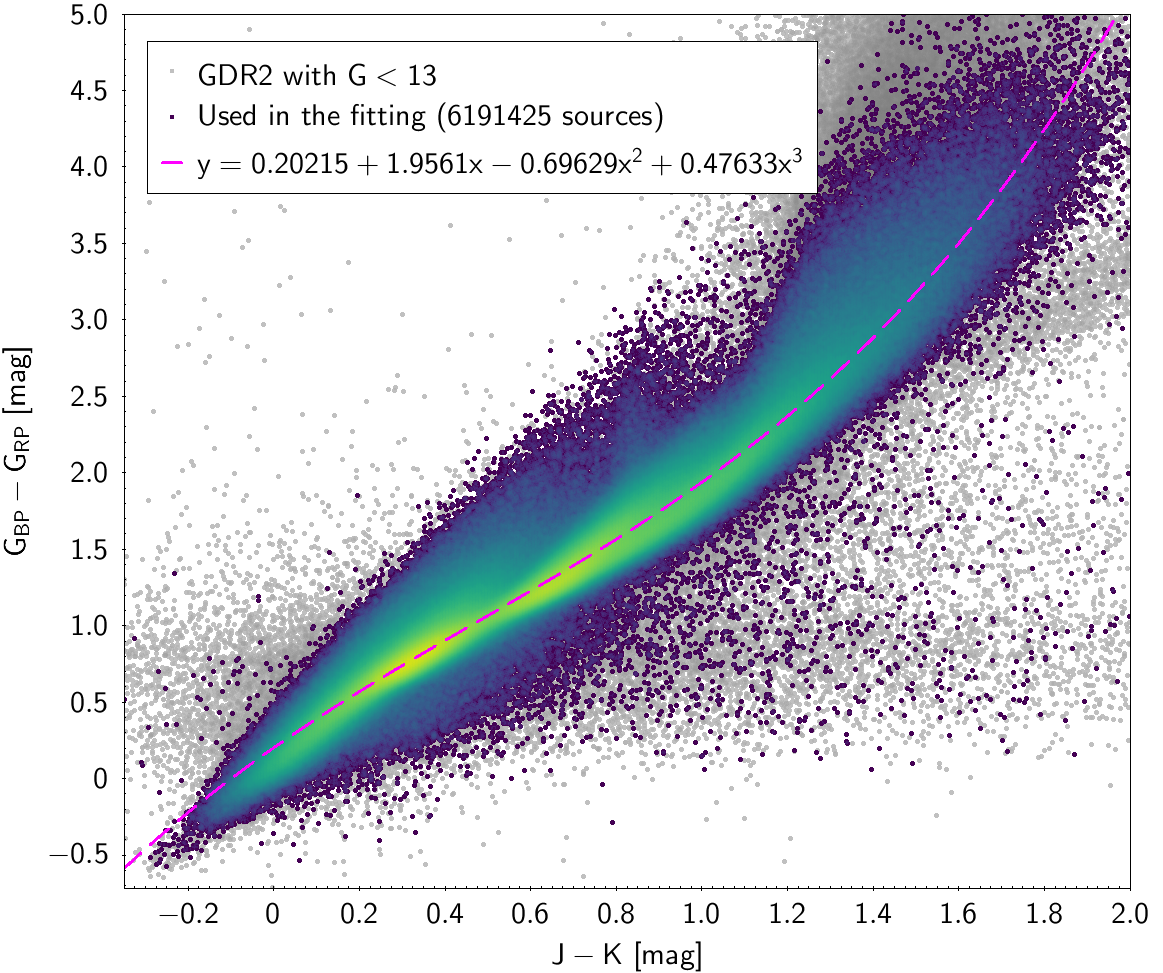
| , and , ”AAA” | 6 191 425 sources | |
| GSC2.3 FILTERING | ||
| Non-variable sources, , | ||
| diagram | and , , | |
| diagram | , and , , | |
| diagram | , and , , | |
| diagram | , , | |
| diagram | , , , | |
| diagram | and , , | |
| Hipparcos relationships | |||||
| -0.03704 | -0.3915 | 0.01855 | -0.03239 | 0.02502 | |
| -0.01259 | -0.3336 | -0.1171 | 0.02244 | 0.09610 | |
| -0.01205 | 0.1105 | 0.06624 | |||
| GSC | -0.00055 | -1.203 | 0.1078 | 0.1089 | |
| -0.01146 | 1.315 | -0.1103 | 0.09390 | ||
| -0.01968 | -0.2344 | -0.1200 | 0.01490 | 0.06875 | |
| Tycho-2 relationships | |||||
| -0.02051 | -0.2706 | 0.03394 | -0.05937 | 0.06373 | |
| -0.006739 | 0.2758 | -0.1350 | 0.01098 | 0.04415 | |
| -0.03757 | -1.188 | 0.4871 | -0.1729 | 0.09637 | |
| 0.03147 | 1.456 | -0.6043 | 0.1750 | 0.07024 | |
| -0.01842 | -0.06629 | -0.2346 | 0.02157 | 0.05501 | |
| -0.02441 | -0.4899 | -0.9740 | 0.2496 | 0.07293 | |
| SDSS12 relationships | |||||
| -0.074189 | -0.51409 | -0.080607 | 0.0016001 | 0.046848 | |
| -0.038025 | -0.76988 | -0.1931 | 0.0060376 | 0.065837 | |
| 0.0014891 | 0.36291 | -0.81282 | 0.14711 | 0.043634 | |
| -0.007407 | 1.4337 | -0.95312 | 0.22049 | 0.041165 | |
| 0.1463 | 1.7244 | -1.1912 | 0.22004 | 0.059674 | |
| -0.29869 | -1.1303 | 0.039156 | |||
| 0.47108 | 2.7001 | -0.97174 | 0.14601 | 0.067573 | |
| -0.12879 | 0.24662 | -0.027464 | -0.049465 | 0.066739 | |
| -0.29676 | 0.64728 | -0.10141 | 0.098957 | ||
| 0.13518 | -0.46245 | -0.25171 | 0.021349 | 0.16497 | |
| Johnson-Cousins relationships | ||||||
| -0.01746 | 0.008092 | -0.2810 | 0.03655 | 0.04670 | ||
| -0.05204 | 0.4830 | -0.2001 | 0.02186 | 0.04483 | ||
| 0.0002428 | -0.8675 | -0.02866 | 0.04474 | |||
| -0.04212 | 1.286 | -0.09494 | 0.02366 | |||
| -0.02269 | 0.01784 | -1.016 | 0.2225 | 0.04895 | ||
| -0.02907 | -0.02385 | -0.2297 | -0.001768 | 0.06285 | ||
| -0.01760 | -0.006860 | -0.1732 | 0.045858 | |||
| -0.003226 | 0.3833 | -0.1345 | 0.04840 | |||
| 0.02085 | 0.7419 | -0.09631 | 0.04956 | |||
| 2MASS relationships | ||||||
| 0.6613 | 12.073 | -1.359 | 0.3692 | |||
| 0.8174 | 14.66 | 2.711 | 0.4839 | |||
| 0.3560 | 9.287 | -1.721 | 0.2744 | |||
| 0.4238 | 6.098 | 1.991 | 0.2144 | |||
| -0.1885 | 2.092 | -0.1345 | 0.08281 | |||
| -0.1621 | 1.968 | -0.1328 | 0.07103 | |||
| -0.01883 | 1.394 | -0.07893 | 0.05246 | |||
| 0.23587 | 4.0548 | -2.5608 | 2.2228 | -0.54944 | 0.14274 | |
| 0.26216 | 5.1917 | -3.6237 | 3.4095 | -0.85956 | 0.18957 | |
| 0.14624 | 2.4329 | -0.83901 | 0.96813 | -0.26534 | 0.089368 | |
| 0.20215 | 1.9561 | -0.69629 | 0.47633 | 0.11034 | ||
| GSC2.3 relationships | ||||||
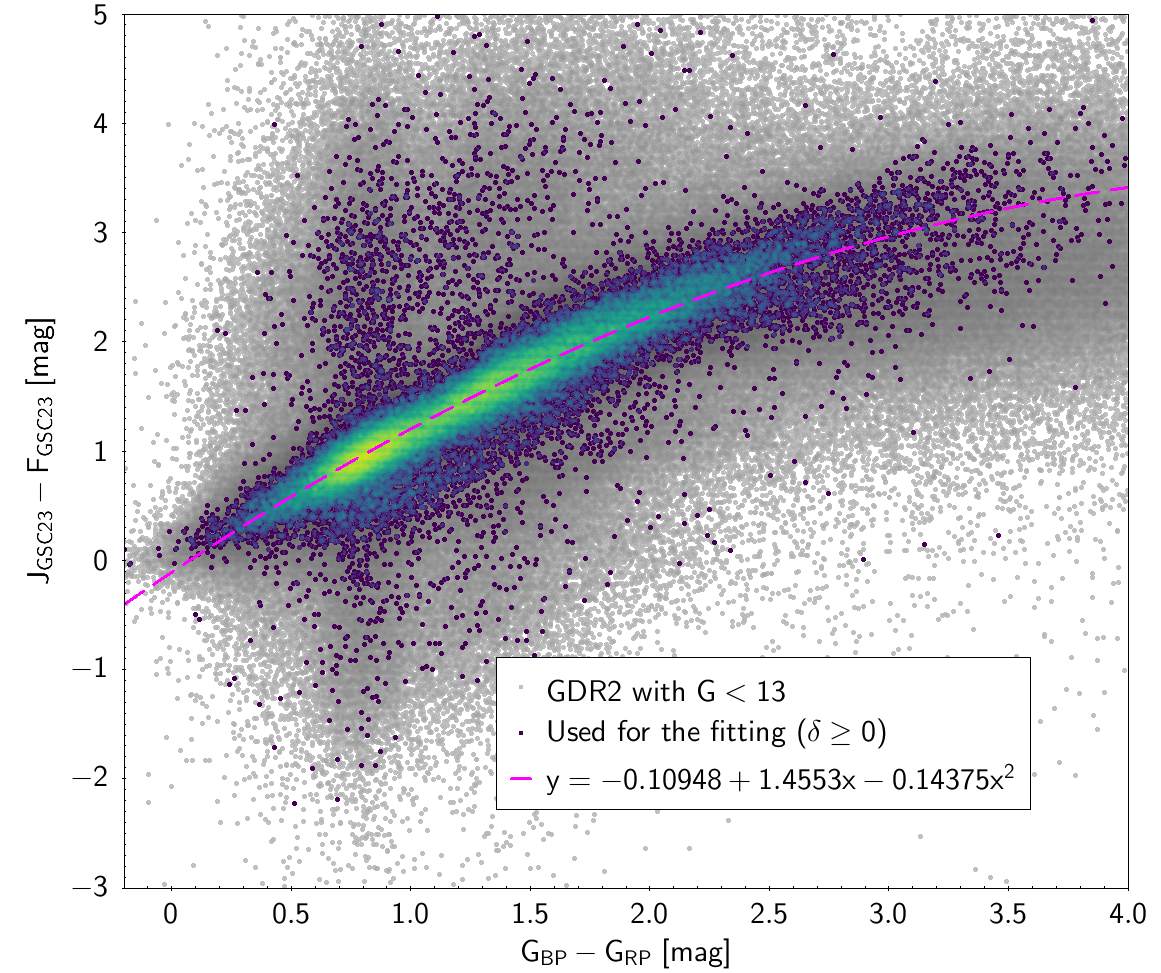
| () | -0.10948 | 1.4553 | -0.14375 | 0.32231 | ||
| () | -0.1621 | 1.4348 | -0.16587 | 0.40361 | ||
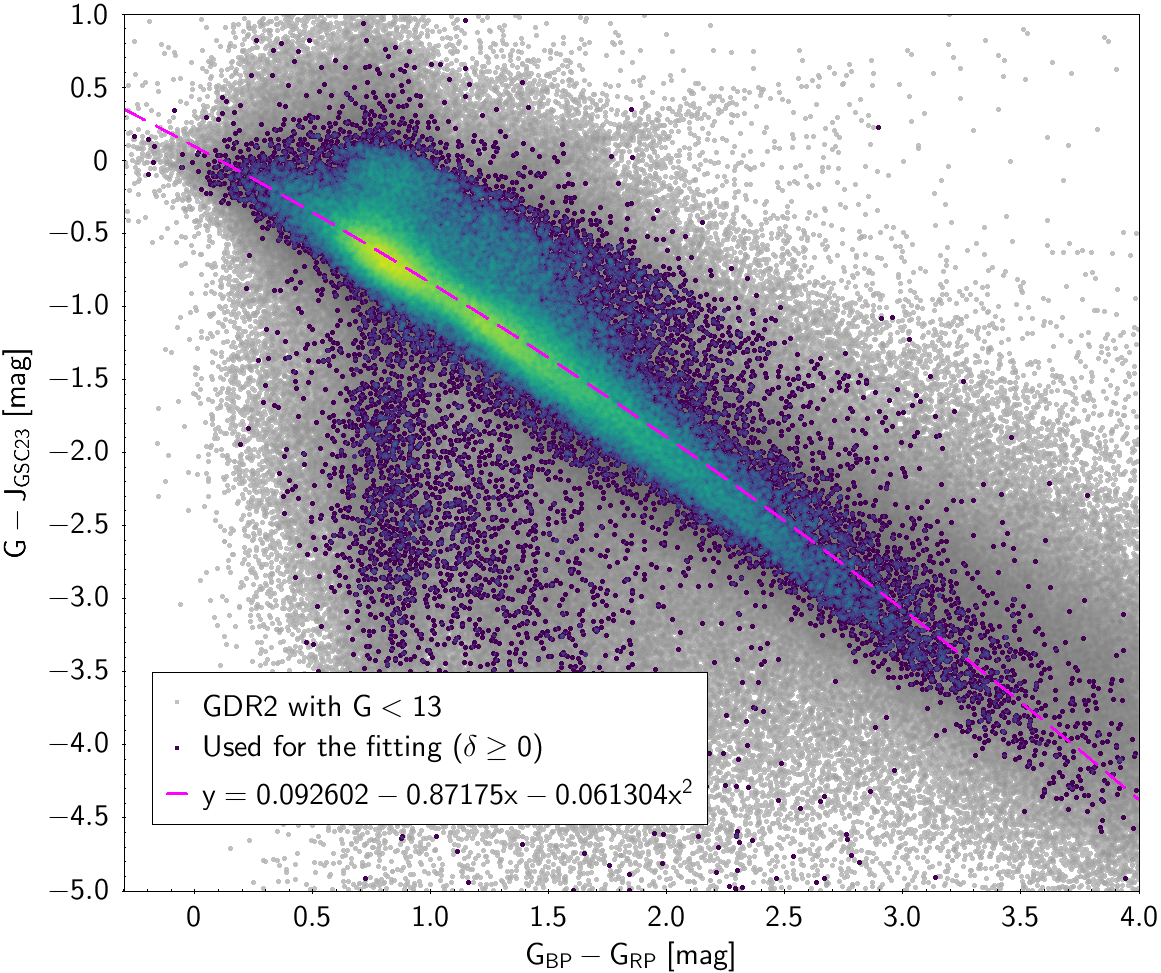
| () | 0.092602 | -0.87175 | -0.061304 | 0.3658 | ||
| () | 0.12609 | -0.89624 | -0.04906 | 0.24571 | ||
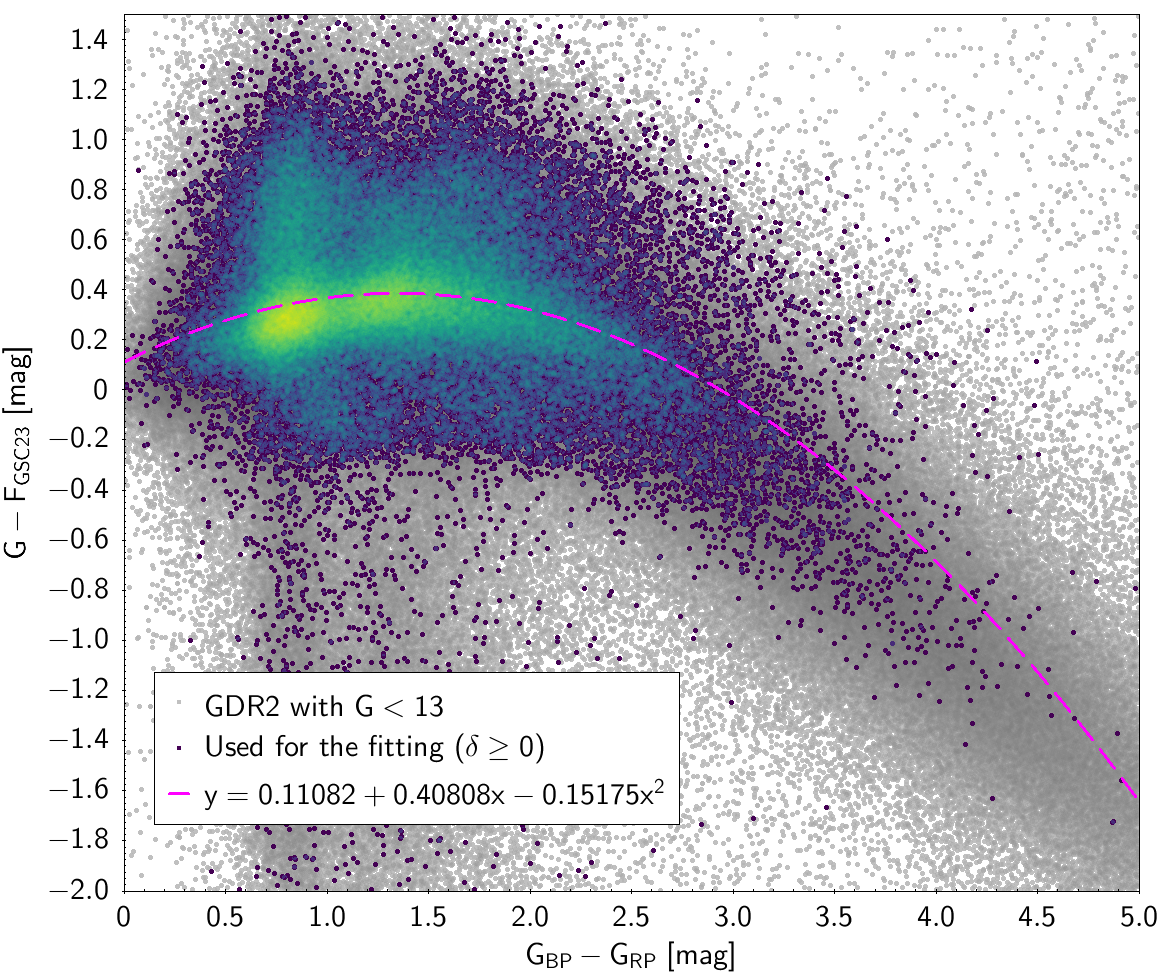
| () | 0.11082 | 0.40808 | -0.15175 | 0.29104 | ||
| () | -0.0031867 | 0.54324 | -0.19188 | 0.32779 | ||
| () | -0.031048 | 0.48358 | -0.14923 | 0.2302 | ||
| () | -0.076434 | 0.52101 | -0.14503 | 0.28117 | ||
| () | -0.11371 | -0.35619 | -0.20973 | 0.19187 | ||
| () | -0.096134 | -0.39097 | -0.18957 | 0.25026 | ||
| () | 0.23021 | 0.54188 | 0.10319 | 0.15494 | ||
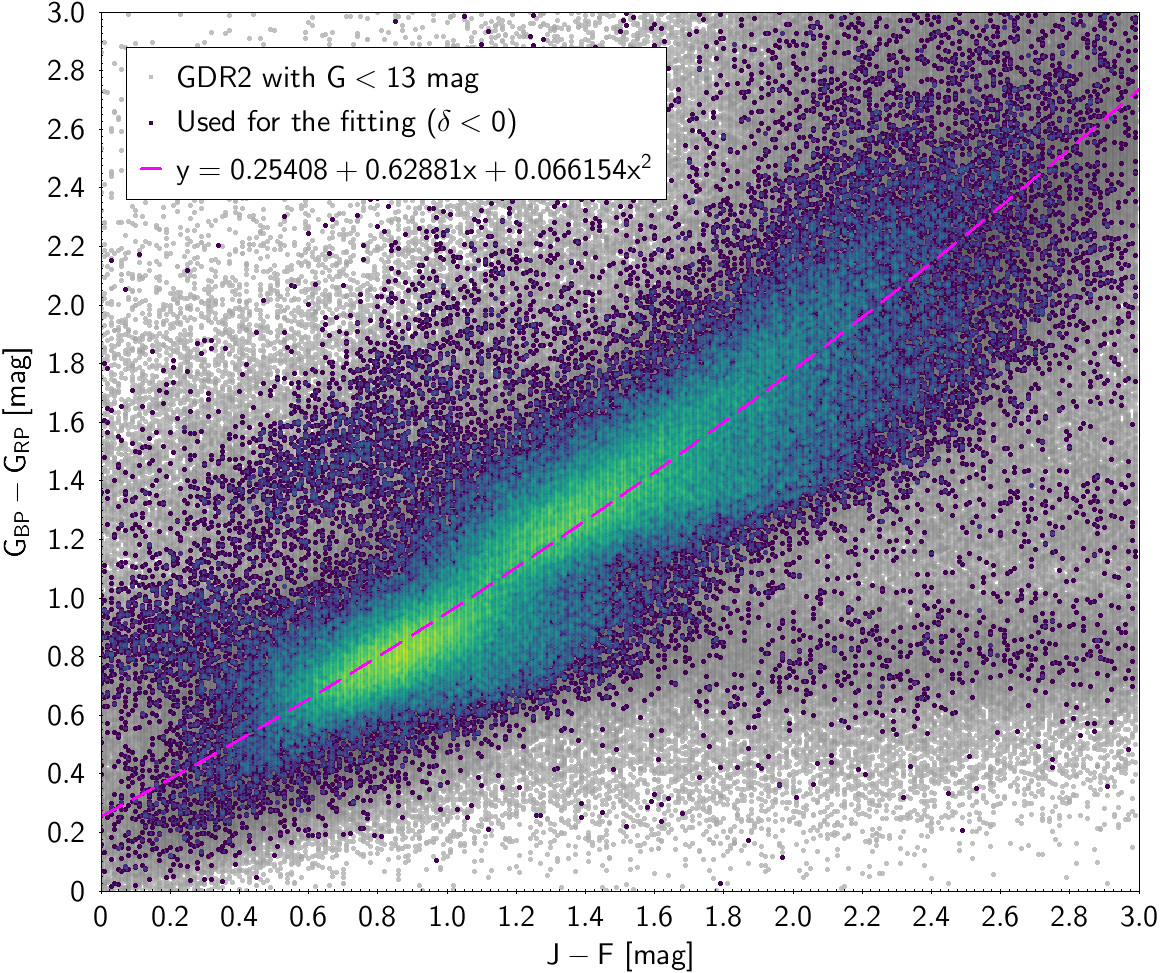
| () | 0.25408 | 0.62881 | 0.066154 | 0.2028 | ||
| Hipparcos relationships | |
| Tycho-2 relationships | |
| SDSS12 relationships | |
| Johnson-Cousins relationships | |
| 2MASS relationships | |
| GSC2.3 RELATIONSHIPS | |
Photometric relationships derived between Gaia and Hipparcos, Tycho-2, SDSS12, Johnson, 2MASS and GSC2.3 can be seen in Figures from 5.11 to 5.21.
