8.3.2 Line-of-sight extinctions
Author(s): René Andrae
 |
 |
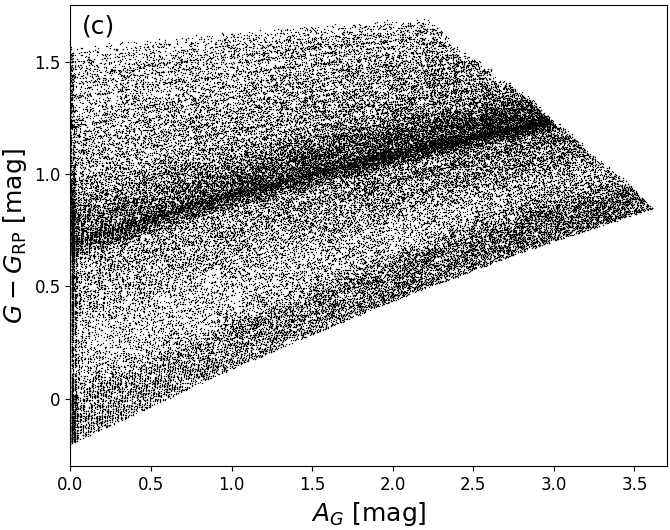 |
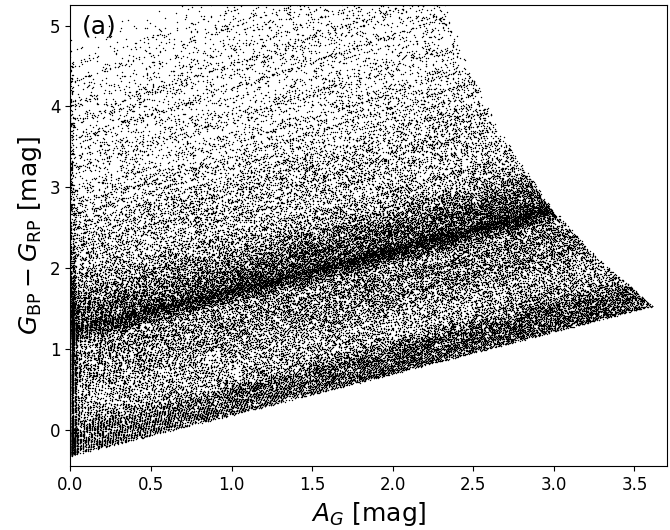
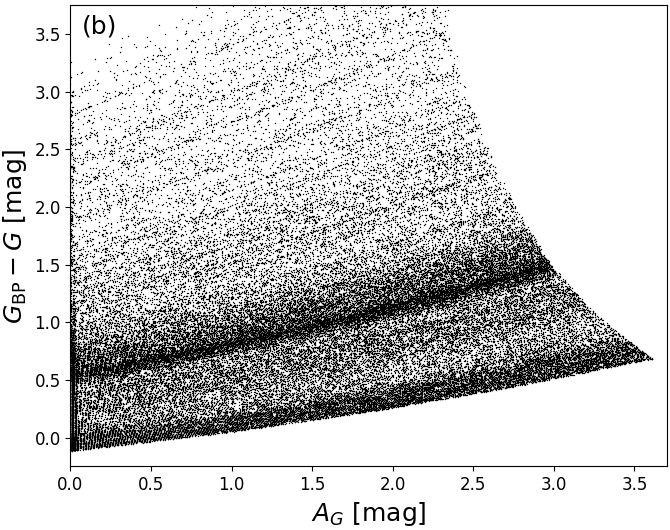
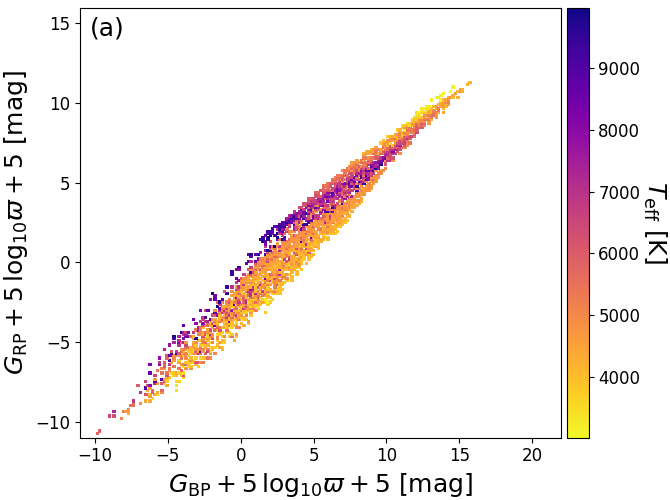
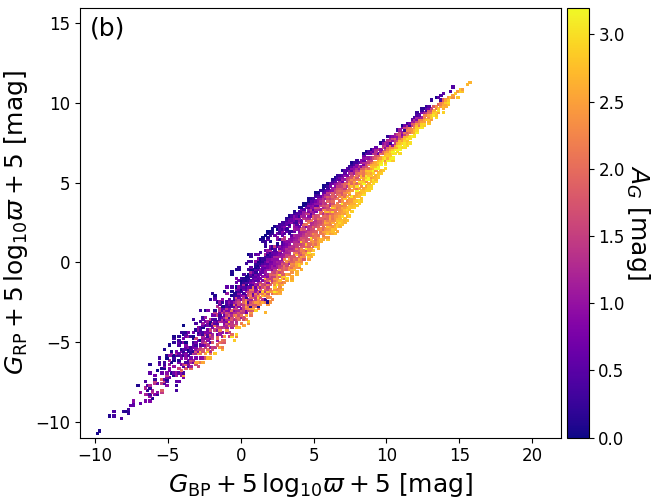
We estimate line-of-sight extinction in the -band and reddening of the colour. As it is obvious from Figure 8.4, there is not even an approximate one-to-one relation between extinction and any of the Gaia colours (as opposed to the temperature-colour relations shown in Figure 8.3). Furthermore, Figure 8.1b also shows that the extinction signature cannot be disentangled from effective temperature in the two Gaia colours and . (Extinctions could be estimated by using other photometry in addition, e.g. from 2MASS or WISE, but the point of DPAC processing is to use only Gaia data). Instead, we employ the parallax as an estimate of the distance and use Equation 8.1 to compute for all three bands. As shown in Figure 8.5b, there is a clear extinction trend in these observables. We thus use the three observables (with expressed in arcsec)
| (8.3) | |||
| (8.4) | |||
| (8.5) |
as features and and as labels for training. Note that the use of parallax means that sources with missing or non-positive parallaxes do not receive extinction estimates (see flags in Table 8.1).
 |
 |
The extinction estimation employs ExtraTrees (Geurts et al. 2006). Since this algorithm is univariate, we have two separate ExtraTrees models for and . The resulting estimates of and are therefore independent of each other, but use the same training data. For both models, we use them for regression with an ensemble of 201 trees, whose median value provides the parameter estimate. Further ExtraTrees regression parameters are random trials per split and minimal stars per leaf node. As uncertainty estimates, we provide the 16th and 84th percentiles of the ExtraTrees ensemble, which form a central 68% confidence interval. These uncertainty estimates in general form an asymmetric confidence interval. Note that we do not propagate the flux or parallax errors through ExtraTrees such that the reported uncertainty interval is solely due to the degeneracy of or with the three observables from Equation 8.3–Equation 8.5 as well as the intrinsic spread of the ExtraTrees ensemble. However, off-line testing has shown that propagating the flux and parallax errors through ExtraTrees has no noteworthy impact on the resulting parameter or uncertainty estimates.
We cannot train these models on literature values since the literature does not provide or but rather or E(). We instead train on synthetic photometry from the PARSEC 1.2S models (Bressan et al. 2012) which adopt the extinction law from Cardelli et al. (1989) and integrate synthetic ATLAS9 spectra (Castelli and Kurucz 2003) with the Gaia nominal passbands (Jordi et al. 2010). More precisely, we use synthetic PARSEC photometry for –4mag in steps of 0.01mag, a temperature range 2500K–20 000K and solar metallicity (). The extinctions , , and the reddening can then be easily worked out from the resulting PARSEC model grid by taking the differences of the apparent magnitudes for minus those for . We emphasise that the features on which we train ExtraTrees are the observables given in Equation 8.3, Equation 8.4, and Equation 8.5: We do not infer from any measurement of any colour. Indirectly, colours of course play a role (although ExtraTrees never computes differences between its attributes) but the parallax also plays a major role as we could not obtain any useful extinction estimates from the colours alone. Recall that ExtraTrees cannot extrapolate beyond the training data range, so it will be impossible to obtain negative parameter or uncertainty estimates of or .
 |
 |
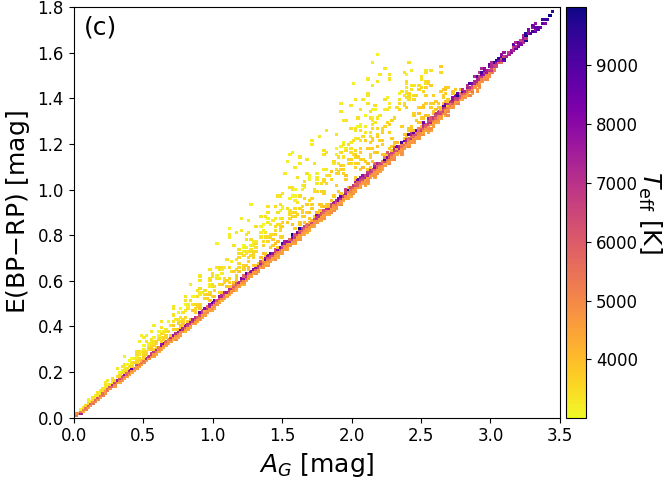 |
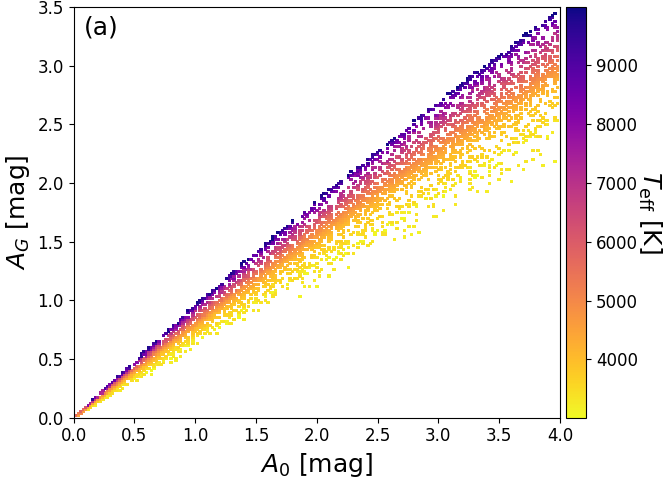
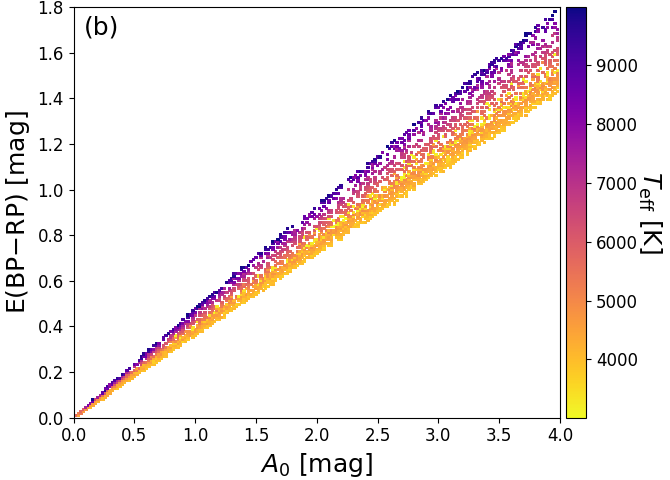
Given that the PARSEC training data is based on the extinction law from Cardelli et al. (1989), Figure 8.6a and b show the relation between and , and and , respectively. Since the Gaia passbands are very broad (Jordi et al. 2010), both and are strongly dependent on the intrinsic SED shape, which is characterized roughly by the colour coding with in Figure 8.6. Furthermore, Figure 8.6c shows that the PARSEC models have the relation built into them (except for very cool stars). Therefore, we should not be surprised finding this relation in our results. However, we note that Jordi et al. (2010) used different stellar evolutionary tracks with different underlying synthetic spectra, such that they find a different relation between and .
Finally, let us also emphasise that while we cannot estimate temperatures from these models, the adopted range of 2500K–20 000K for the PARSEC models allows us still to obtain reliable extinction and reddening estimates for intrinsically very blue sources such as OB stars, although the method described in Section 8.3.1 cannot provide good estimates for them.