10.7.6 Extinction validation
On a star-by-star basis, the individual estimates of span a wide range of values from =0 to =2 or 3, including at high Galactic latitudes. Halo Globular Clusters in particular are marked with high values of while extinctions in the halo are expected to stay in the range 0.05 to 0.09.
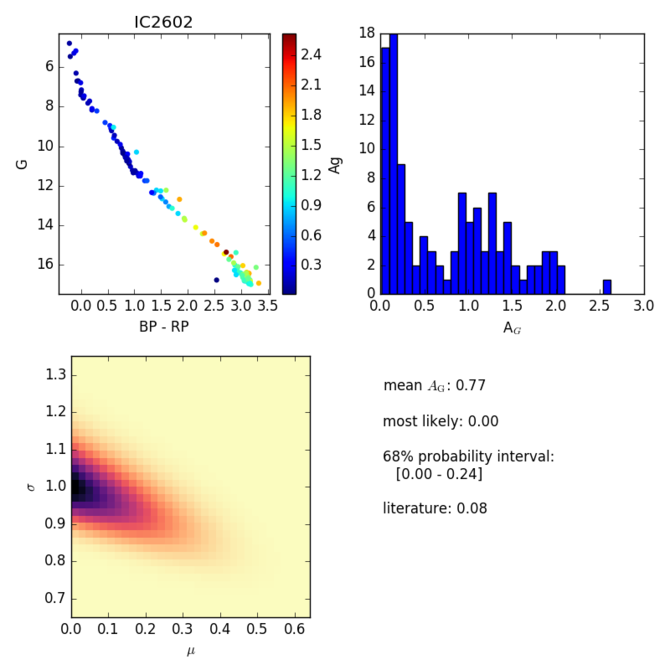
The extinction also varies within a single cluster, depending on the position of the star in a CMD. Redder stars such as red giants, low main sequence stars, or unresolved binaries, tend to be attributed higher extinctions (see, e.g., Figure 10.58). In crowded GCs, stars at the centre tend to have higher values of than in the outer regions, owing to the poor quality of the photometry.
A major issue one has to face when combining values of several sources is that the individual extinctions are affected by large uncertainties (0.4 to 0.6 Andrae et al. 2018) and constrained to be non-negative. This means that even for a sample of stars that all have a true extinction =0, the individual stars will all have positive values and the mean can never converge to zero. Andrae et al. (2018) indicate a maximum likelihood (ML) approach to help solving this issue. Applying this method to the open cluster IC 2602 returns a most likely =0, with 68% of probability contained in the range 0 to 0.24 (Kharchenko et al. 2013, report , corresponding to =0.08). For comparison, the simple average for this sample is 0.77.
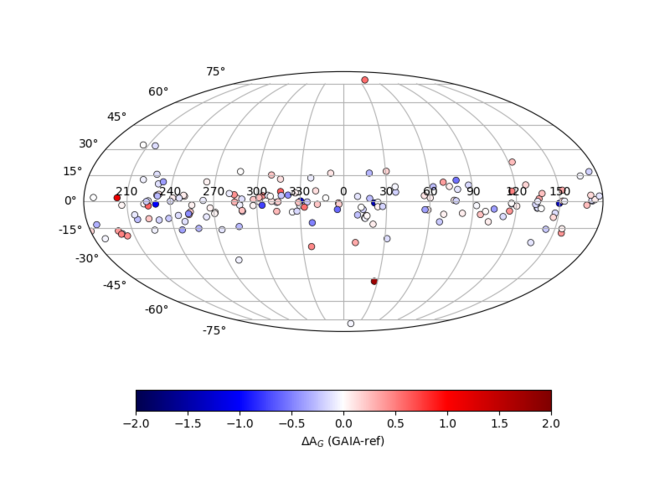
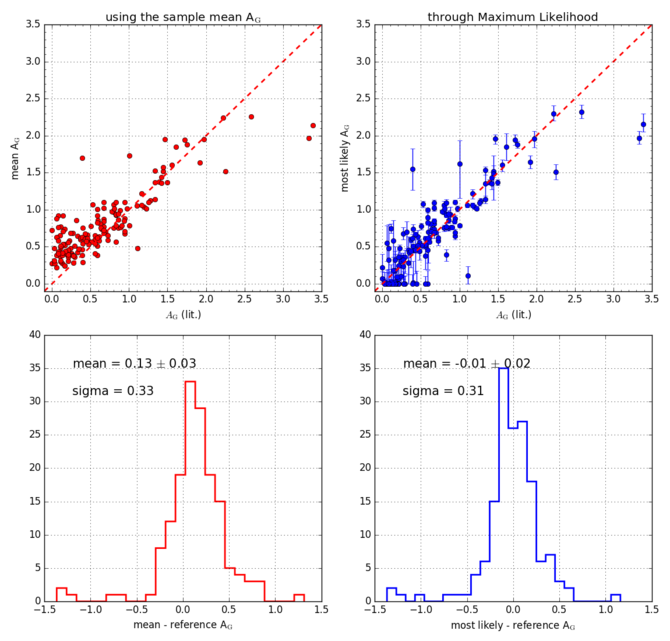
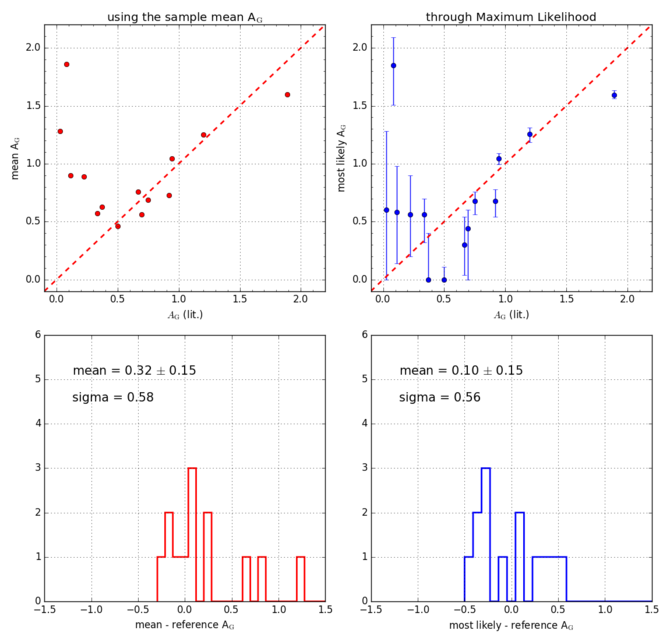
We have compared the extinctions recovered through the ML approach with the values listed in Kharchenko et al. (2013) for about 100 clusters. Figure 10.59 shows the difference between derived and reference extinction for the whole cluster sample in Galactic coordinates, while Figure 10.60 and Figure 10.61 present the open and globular clusters, respectively. The agreement is globally good, with an average difference for open clusters, but with a significant scatter of 0.31.