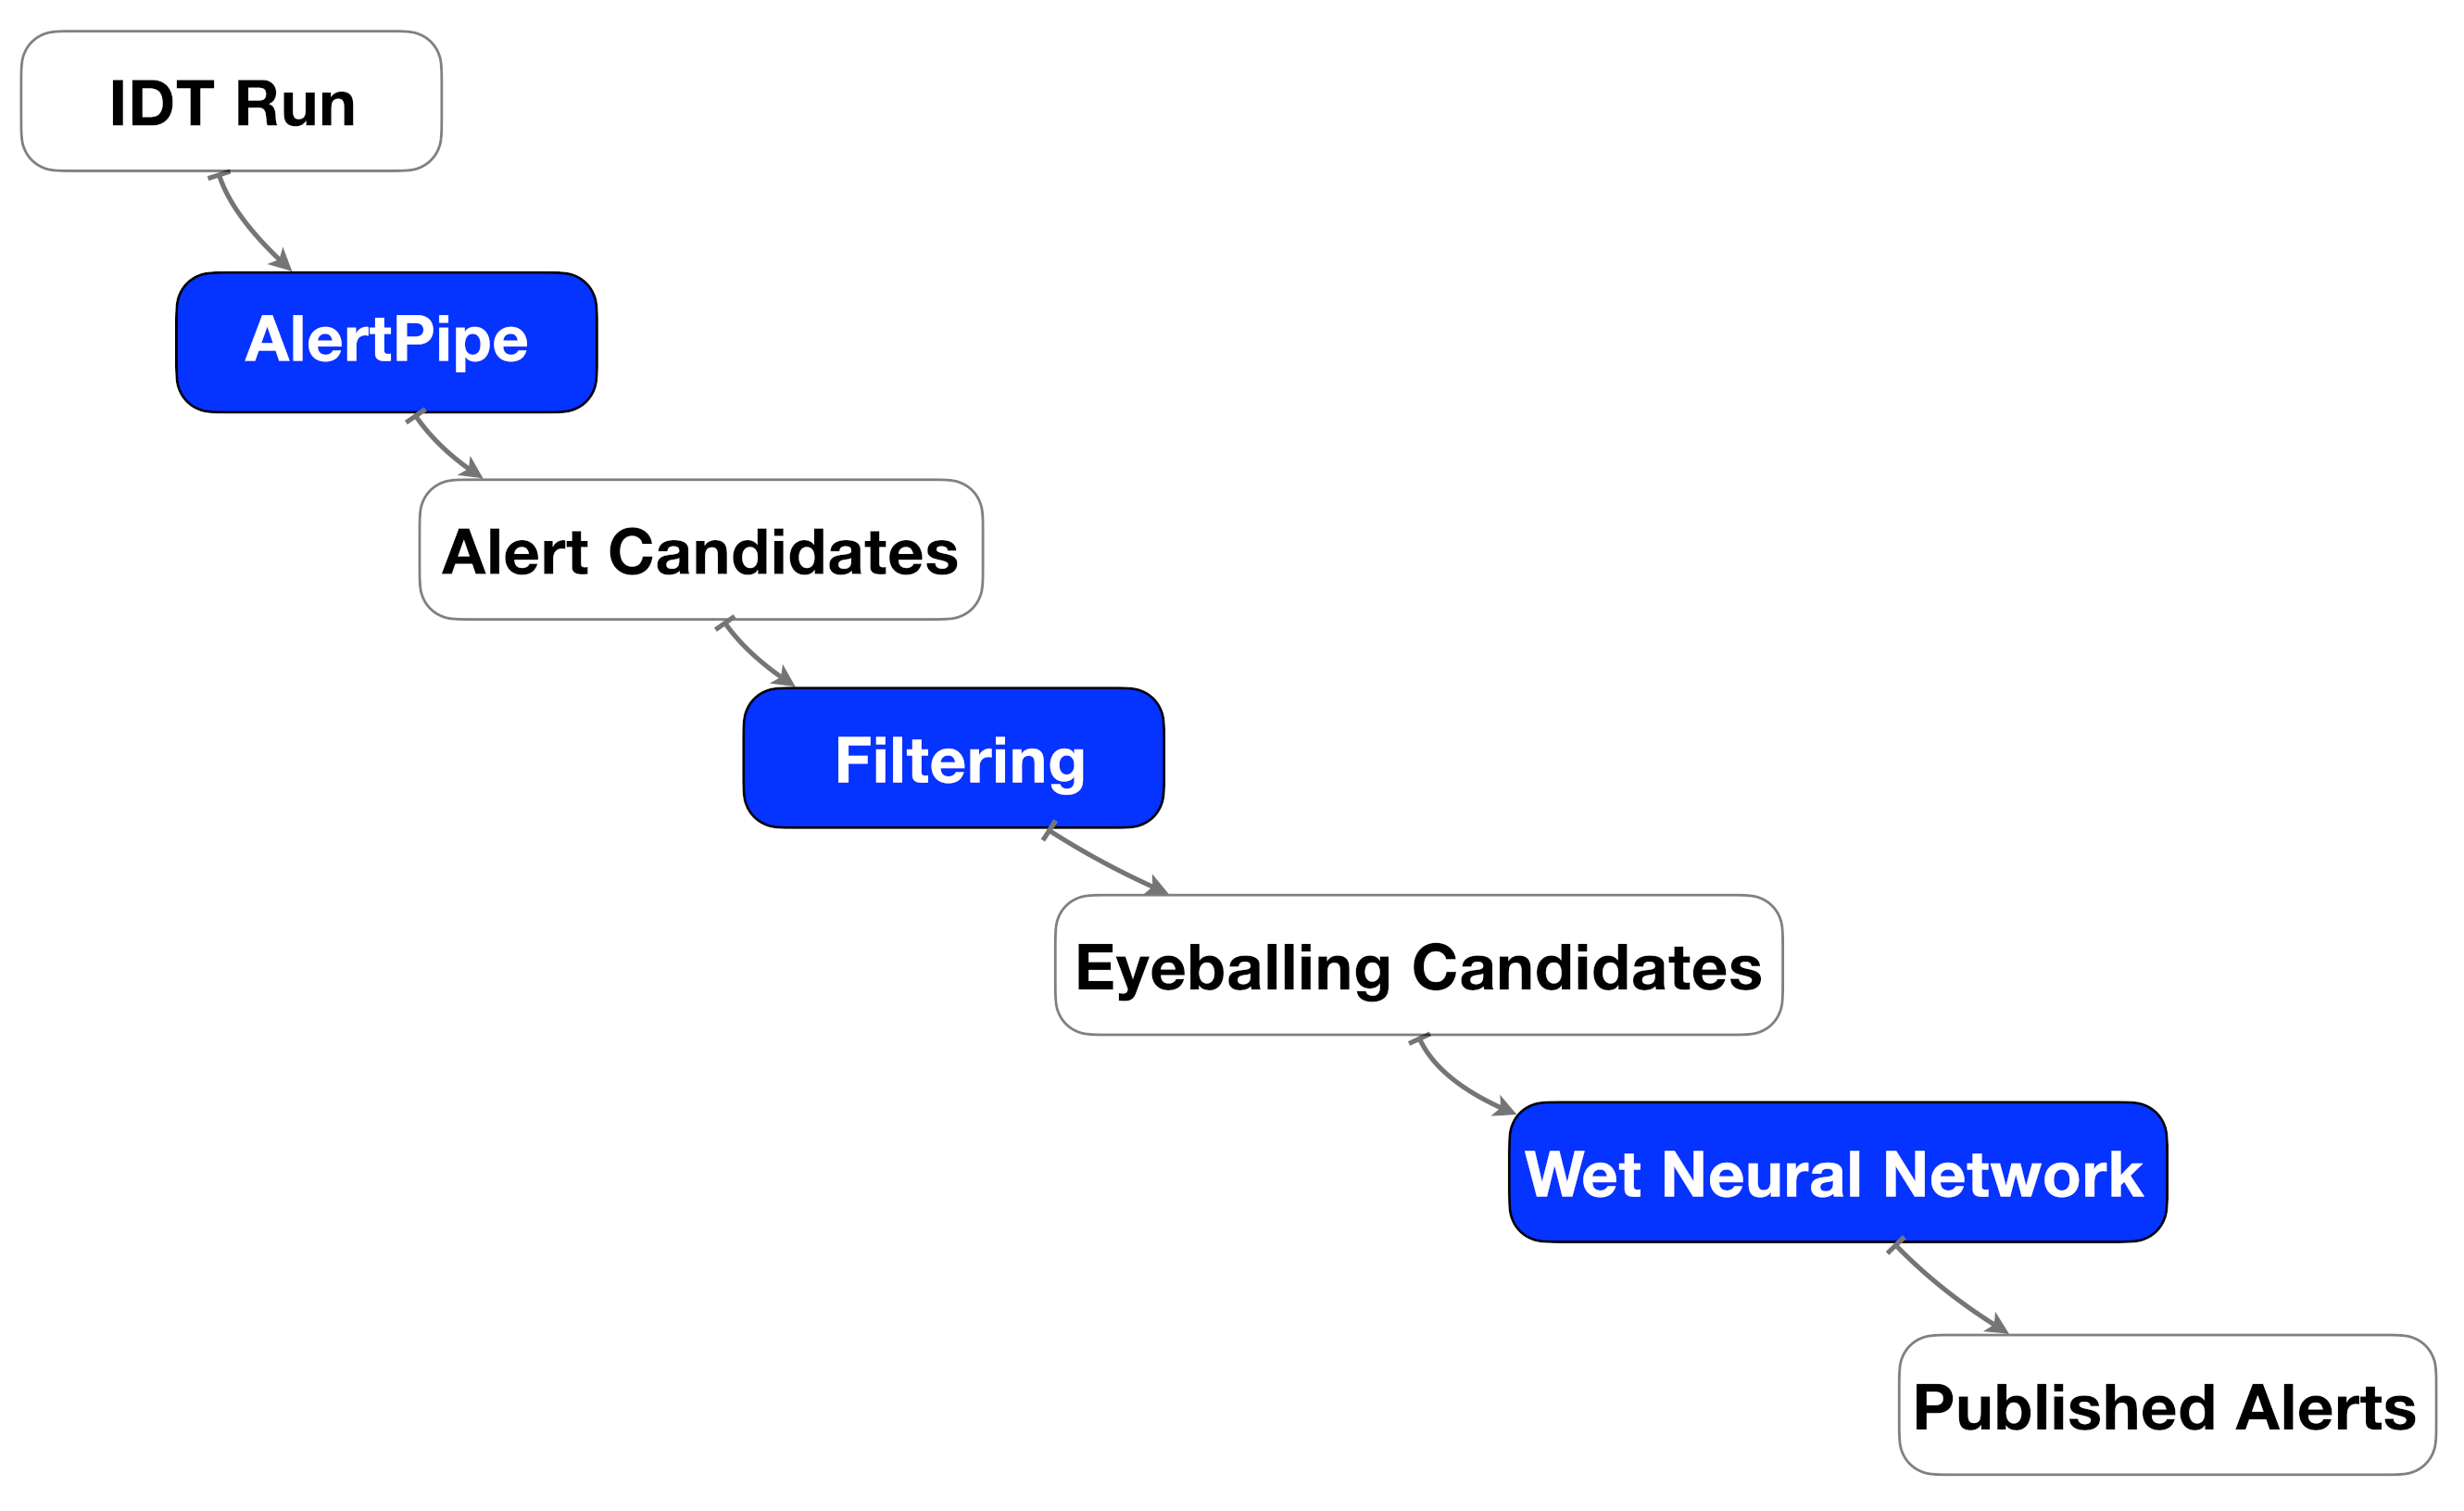
5.7.2 Data flow: from transits to alerts
The IDT daily processing cannot accumulate, and iteratively calibrate, data with the same methods used for the main Gaia data releases. In this section we discuss how GSA proceeds from the on-board measurements taken by the Gaia spacecraft to the eventual publication of transient astronomical phenomena. An overview of the principal steps is described here (see also Figure 5.48).
-
•
Sources are detected and observed by Gaia as the spacecraft rotation and precession brings them through the fields of view (FOV, Section 5.7.2).
-
•
Observations are downlinked and forwarded via the Mission Operations Centre (MOC) to ESA’s Science Operations Centre (SOC) for processing.
-
•
SOC collates the telemetry from Gaia and performs the Initial Data Treatment (IDT), extracting positions and fluxes of the sources from the pixel data.
-
•
The results are copied to the various data-processing centres of the Data Processing and Analysis Consortium (DPAC, Mignard et al. (2008)), including the one at Institute of Astronomy Cambridge (DPCI) where alerts processing takes place. All data are handled by the GSA PostgreSQL database which make use of the Quad Tree Cube (Q3C) software (Koposov and Bartunov 2006)).
-
•
GSA processes the data of the current IDT run, filtering the observations by quality, applying an on-the-fly photometric calibration, detecting transient features in the lightcurves, and flagging events suspected to arise from specific instrumental effects, as well as transients of astrophysical sources that are not worthy of alerts (e.g. known periodic variable stars and Solar System objects). Processing requires having all of the IDT output relating to a given source, but IDT’s output is not organised cleanly by source, because to do so would be expensive and inefficient. In practice, the alerts pipeline runs once per IDT run (typically one day of observation) and cannot begin until the last output for that run arrives at DPCI.
- •
-
•
Human inspection (i.e. eyeballing) identifies those candidates suitable for publication (Section 5.7.2).
-
•
Finally, the chosen alerts are published immediately to the World Wide Web via the Alerts Website, TNS entries and VOEvents (see Section 5.7.2).
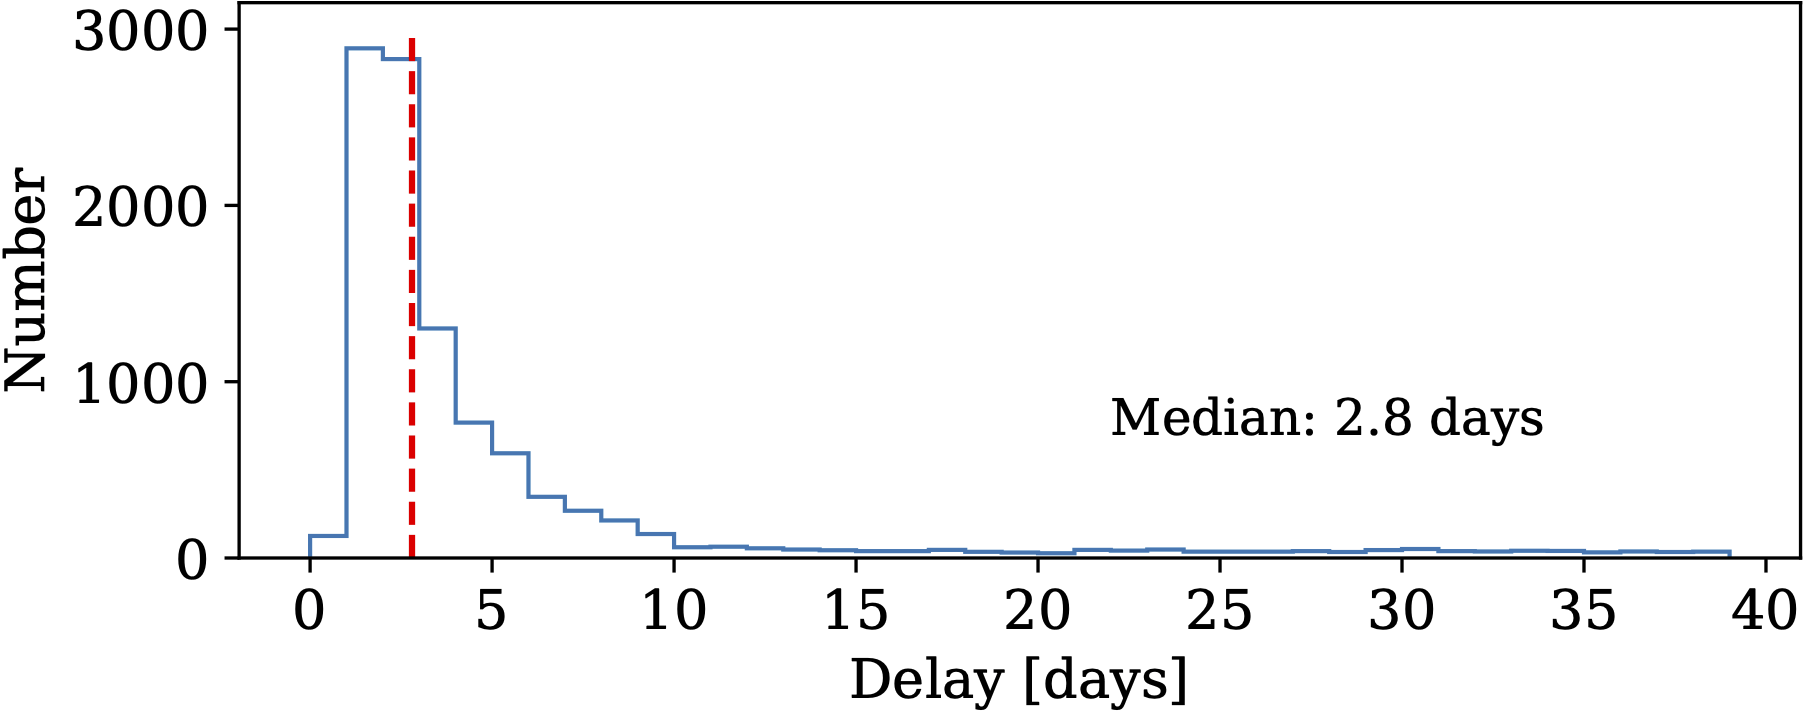
Each alert is published with a timestamp corresponding to the observation time by Gaia (in barycentric coordinate time, TCB) as well as the time of publication of the alert (in Coordinated Universal Time, UTC). The latency between the two timestamps is the sum of:
-
1.
the time from observation until downlink of the data to MOC (commonly less than 12 hours, but significantly more in exceptional cases),
-
2.
processing time at MOC and SOC, mainly in IDT (typically around 10 hours),
-
3.
time for automatic processing at DPCI (typically from 3–6 hours, but rising to 24 hours for scans that run tangentially along the Galactic plane), and
-
4.
time for human evaluation at DPCI (see Section 5.7.2).
Alerts, therefore, typically appear between 24 and 96 hours after the triggering observations (median delay is 2.8 days, see Figure 5.49). There is also a long tail, which corresponds to the delay between detection in two different FOVs (up to 40 days), discussed in Section 5.7.2.
Observations and data types used
In alerts processing, use is made of the following IDT data: (1) fluxes measured on each astrometric field (AF) CCD; (2) positions of the source on each AF CCD along and across the scan direction, extracted by means of a PSF/LSF fitting (Point/Line Spread Function, Fabricius et al. (2016)); (3) the calculated RA, Dec; (4) integrated fluxes for the transit in blue and red photometers (BP and RP), plus the colour derived from their combination; (5) individual pixels of the BP and RP measurements; (6) matching of transits to sources in the working catalogue; (7) status flags describing the reliability of the IDT results.
Alerts processing does not use the sky mapper (SM) data, the raw pixel values from the AF CCDs, or the Radial Velocity Spectrometer (RVS) data (although RVS data were reported for 12 alerts, between August 2016 and September 2017, see Section 5.7.2).
Initial Data Treatment
Initial data treatment, or IDT (Section 3.4.2) , is a (roughly) daily operation which is run at SOC (near Madrid). IDT is responsible for the generation of self-contained raw data records, and measures the centroids and fluxes for the SM, AF and BP/RP CCDs (see also Table 3.5 and Figure 3.11). In GSA we ignore the SM data, and use the BP/RP in only the filtering, eyeballing and publication phases.
IDT generates the first on-ground attitude for Gaia (OGA1, see Section 3.4.5), and thus enables to computation of source positions in RA, Dec (to a required precision milliarcseconds, Fabricius et al. (2016)). The astrometrically calibrated transits are then positionally matched to the IDT working catalogue.
If a transit can be cross-matched to an IDT working catalogue source, then it is assigned the same sourceId. If it cannot, then a new sourceId is generated, and it is added to the working catalogue.
Updates to the working catalogue
The Gaia data releases (Gaia DR1, Gaia DR2, Gaia EDR3, Gaia DR3) are derived from cyclical processing of the entire dataset up to the end of the appropriate data segment (see Section 3.4.2 for more details).
Cyclic processing happens long after GSA transients have been raised and published from a given set of observations. Of necessity, alerts processing uses IDT’s working source-catalogue to build the lightcurves.
At the start of operations, the working catalogue was the Input Gaia Source List (IGSL, (Smart and Nicastro 2014)). On two occasions, IDT has updated its working catalogue to the most-recent cyclic catalogue. This happened only once in the date range included in Gaia DR3, at the boundary between data segments 2 and 3, on UTC 2016-05-23T11:35. To accommodate this, the alerts database had to be updated to the new catalogue, such that old and new observations could still be combined into lightcurves. A second rematch occurred in October 2017. IDT has not updated its working catalogue since then.
There is never a one-to-one mapping between the old and new working catalogues: cyclic processing uses an improved astrometric solution, which can result in splits and mergers of IDT’s sources to best fit a new clustering analysis of the sky (see Torra et al. (2021)). And importantly for GSA, a magnitude criterion was employed in the clustering algorithm to help disentangle valid and spurious detections into different clusters. This means that transits forming a lightcurve of a published alert could end up assigned to different sources in the new catalogue, especially for a highly variable (e.g. transient) source, where the bright and faint parts of a lightcurve may appear in the catalogue as distinct sources. An additional algorithm was later added to the cyclic processing in an attempt to improve matching for these variable sources.
When IDT’s working catalogue is updated, we map the transits of published alerts to their new sourceIds (if they have changed). Where the updated results in multiple sourceIds associated with a single alert, the alert lightcurve is visually inspected including all positionally coincident transits, and if necessary additional sourceIds are assigned to the published alert (these are called mixed-in sources). In this event the published lightcurve will be updated with future transits belonging to any of the sources assigned to the published alert.
Preparation of lightcurves
Each IDT run contains new observations of sources in the IDT working catalogue, as well as observations of new sources. The GSA processing begins with ingestion of these new data into the GSA database. Next we build lightcurves for these sources dynamically. A lightcurve is the union of all transits assigned to that sourceId by IDT across all runs. If a photometric calibration was available, this was applied on-the-fly (in the database we store raw fluxes).
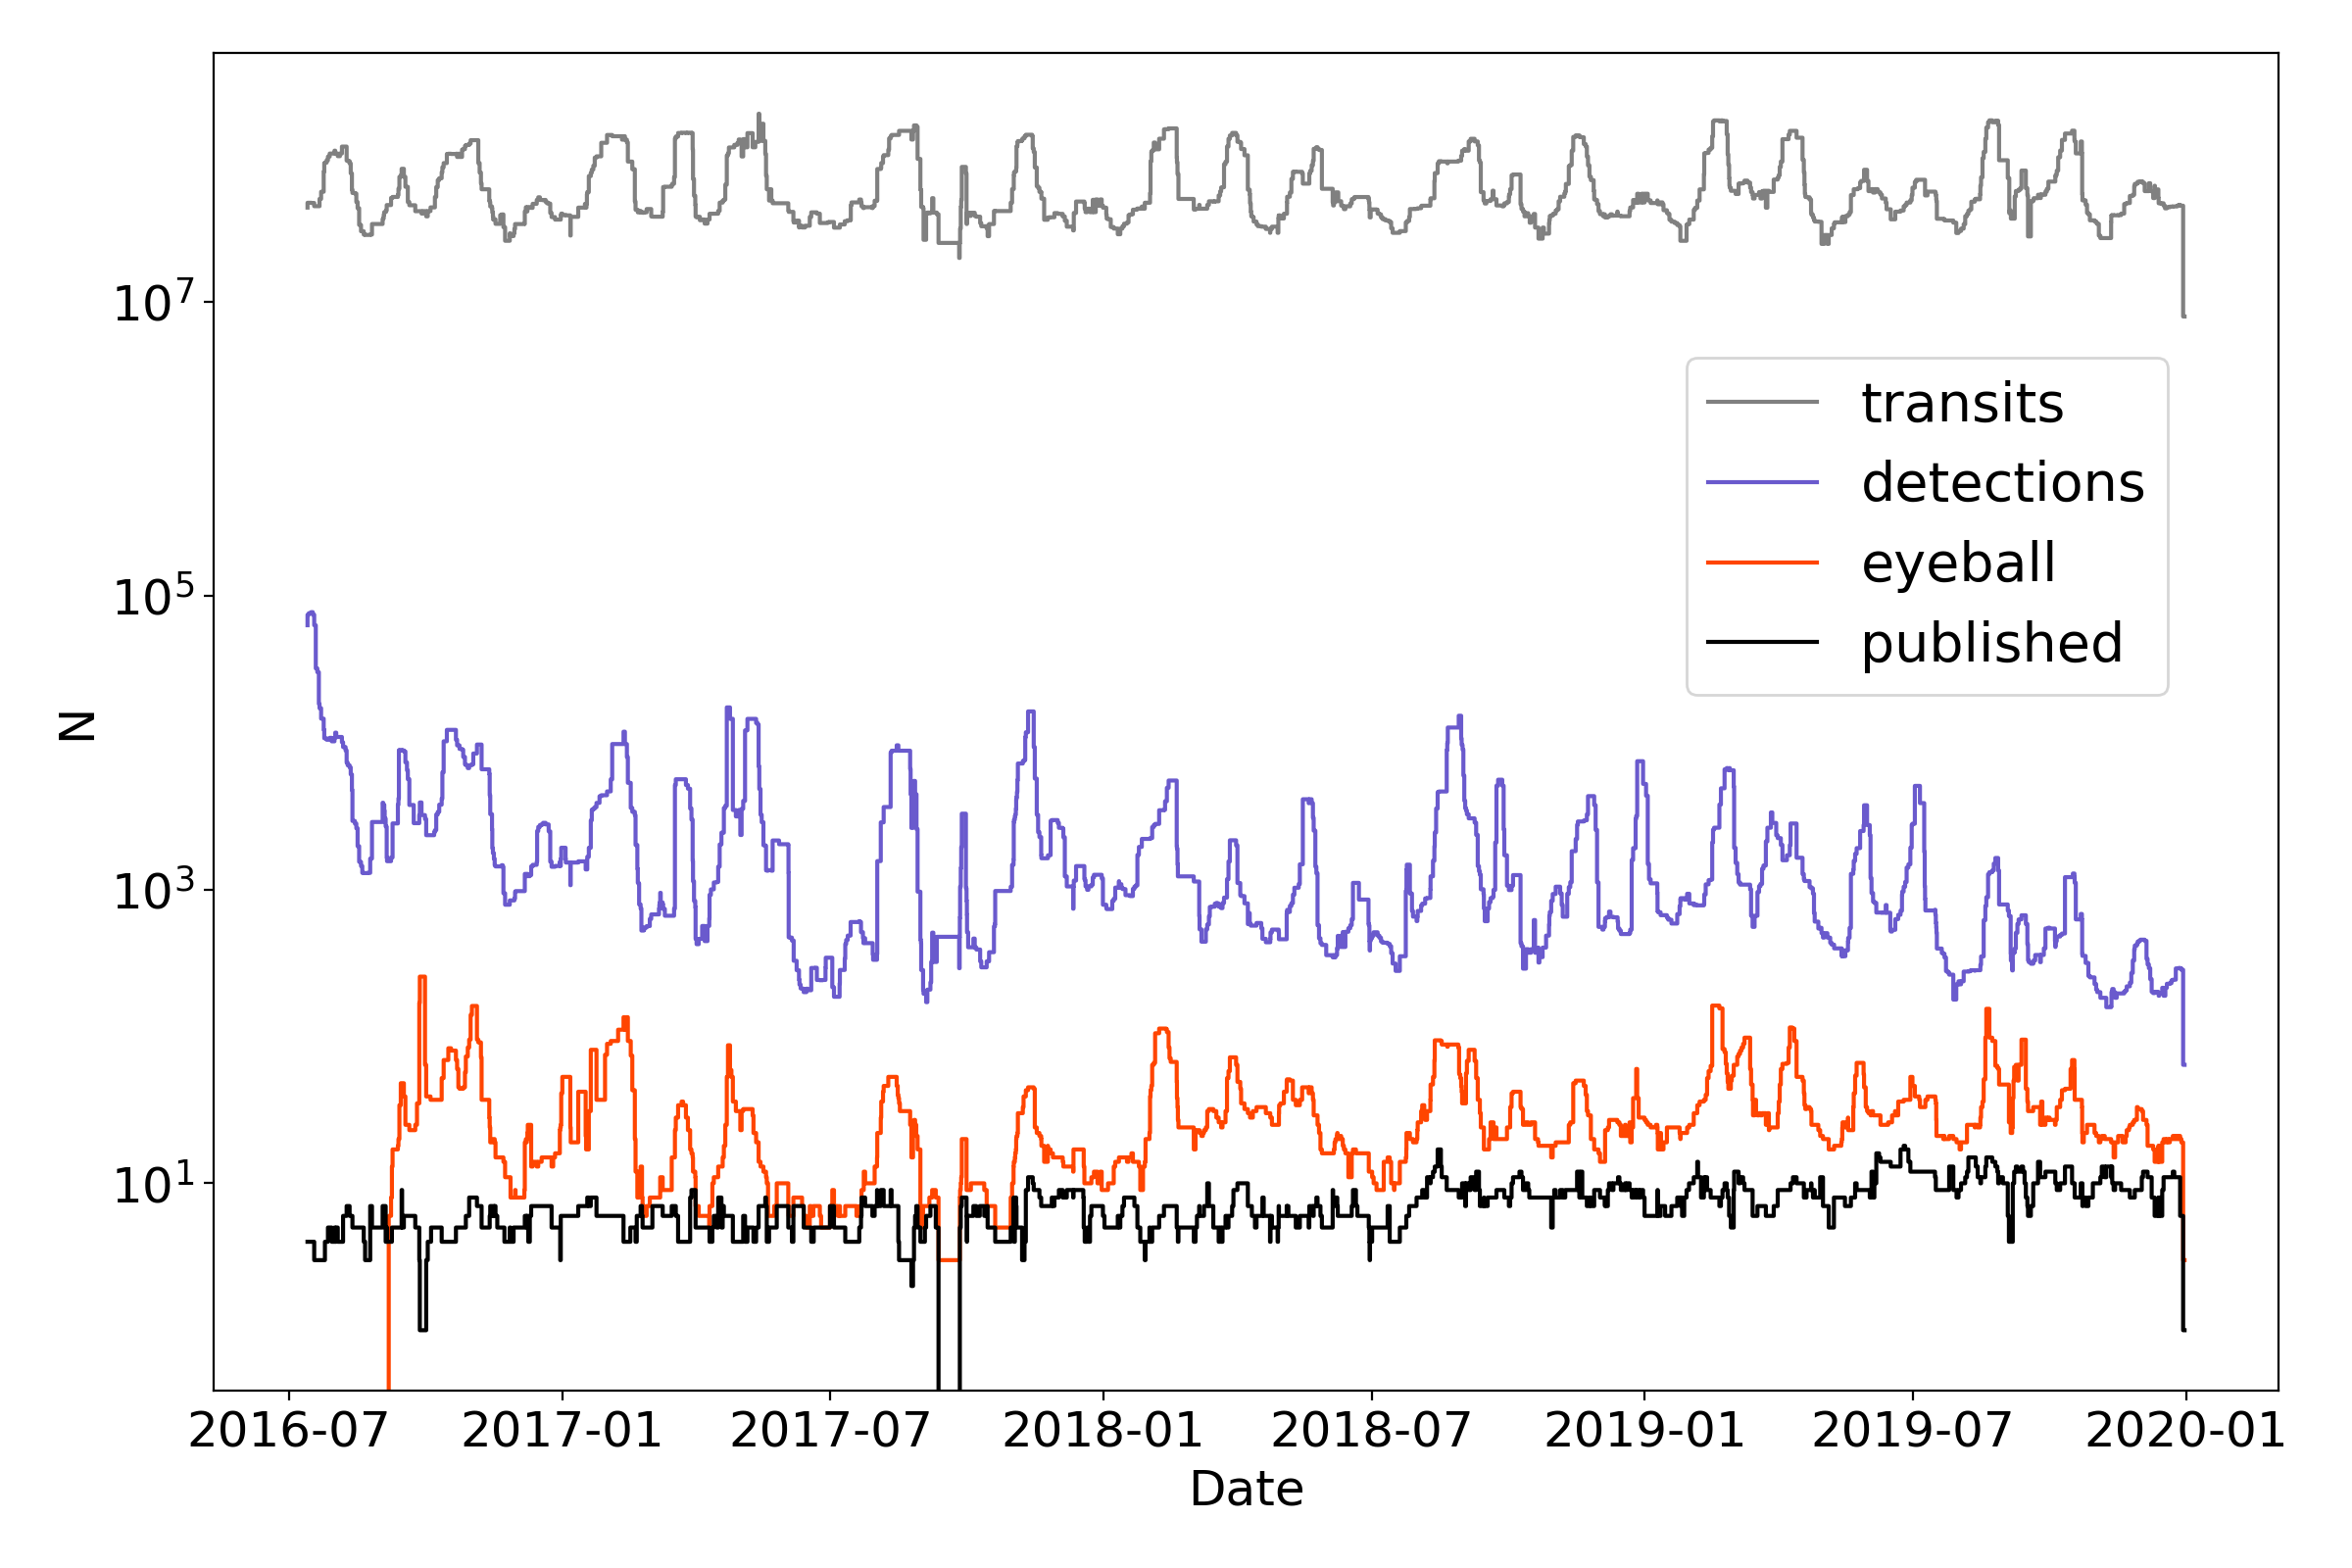
A typical IDT run contains on average 60 million transits arising from some 37 million sources, but this can increase dramatically when Gaia is scanning along the Galactic disc (see Figure 5.50).
Filtering bad transits
We filter transits from the lightcurves for a number of reasons:
-
•
IDT flags suggest improper extraction of flux or position
-
•
Observations taken when Gaia was in an unstable state (e.g. mirror heating)
-
•
On-board readout parameters inconsistent with source magnitude: specifically, multiple sources can be observed simultaneously on the same TDI (time-delayed integration) line (de Bruijne et al. (2015)). The readout parameters are set to suit the brightest source, and this may compromise observations of fainter sources (see Section 1.1.3).
-
•
Scatter between individual CCD fluxes significantly higher than expected for the median transit flux, suggestive of interference from a source in the opposite field of view.
Where a transit is rejected, its flux is not used for transient detection. And if an alert is published for the source, the lightcurve includes no magnitude value for the rejected transit (although the time is preserved).
Alert detection
For the data included in Gaia DR3, GSA ran three transient detection algorithms on each -band lightcurve.
New source
A source which is not previously seen by GSA, and which rises to can be classified as a NewSource alert candidate, so long as it passes a number of other criteria:
-
•
The source must be seen in both fields of view (FOV). This reduces potential contaminants arising from solar system objects, planets, epochs of initially bad astrometry, or sources in the alternate FOV (e.g. the diffraction spikes of a bright star).
-
•
The position of the source must have passed through Gaia’s FOV at least 10 times previously without detection (calculated using HEALPix with a resolution of 40 arcseconds).
A complication is that observations of a NewSource may be split between different IDT runs. In order to avoid missing these candidates, the detector aggregates all observations of the source in the current and all previous IDT runs. We allow a window of 40 days in which any detected transits from the same source are included and are potentially from a NewSource candidate. Any transits of the source older than 40 days are considered to indicate a previously known source, and the NewSource detector is not triggered.
Old source delta-magnitude
The detector is designed to identify large-amplitude variations in sources in the IDT working catalogue. It responds to both brightening and dimming events.
Measurements in the lightcurve obtained within 40 days of the most recent measurement are analysed for transient behaviour, while the mean and standard deviation of older measurements are taken as a historic baseline for comparison. For historic magnitude, we use the average magnitude instead of a median as it generated fewer spurious events. To become an alert candidate, the lightcurve must have at least two transits that differ from the historic mean by at least one magnitude and by three times the standard deviation of the baseline.
To survive as an alert candidate, the source must have a standard deviation in position of less than 0.1 arcseconds. This can help to rule out cases where transits from two separate (but barely resolved) sources have been mixed. But this may also have a negative impact on transients arising in marginally resolved sources such as galaxies.
OldSourceMeanRms
This detector is similar to the old source delta-magnitude detector, but detects smaller changes in quieter lightcurves. The minimum change in brightness is reduced to 0.15 magnitudes, but the deviating transits must change by at least six times the standard deviation of the baseline flux.
Astrometry
As discussed in Section 5.7.2 GSA uses astrometry derived by IDT. Previously, Wevers et al. (2019) has shown that the median separation between the Gaia alert coordinates and Gaia DR2 is 62 milliarcseconds (with a standard deviation of 40 milliarcseconds). We independently compared the per-transit RA and Dec positions for 10 461 distinct alerts comprising just over 240 000 individual transits, measured between 15 January 2016 and 31 December 2019, with the positions published in Gaia DR2. We find the separations between the two coordinate systems are reasonably well described by a Rayleigh Distribution, albeit with a slight excess in the tail to larger separations, presumably arising from systematic differences between the actual and predicted Gaia, spacecraft attitude (i.e. consistent with spacecraft hits, Fabricius et al. (2016)). The best fit model results in an average offset of 55 milliarcseconds, with no dependency on magnitude.
We also note that Yaron et al. (2019) compared the transient positions between published Gaia alerts and a number of surveys, finding the following median separations (amongst others): Gaia–ZTF: 0.12 arcsec; Gaia–Pan-STARRS1: 0.12 arcsec; Gaia–ASAS-SN: 1.17 arcsec. They conclude that GSA astrometric measurements will be treated as ground truth, which is to say that the TNS coordinates will be updated to the Gaia positions if and when published.
Filtering spurious alerts
To all intents and purposes, GSA is a catalogue-driven transient survey, because two-dimensional AF pixel data are not available for the vast majority of sources. The strength of many of the extant ground-based transient surveys, including ZTF (Bellm et al. 2019), ASAS-SN (Shappee et al. 2014) and PanSTARRS (Chambers et al. 2016), is that they employ difference-imaging techniques, thus the operators and users can ultimately inspect the images, and decide on the veracity of each event. For GSA this lack of an image, and constraints on the release of Gaia data ahead of formal data releases, pushed us to deliver a high-purity alert stream, whereby a high degree of candidate vetting and rejection was performed in house.
Automated filters were designed to handle the largest number of spurious events, and these evolved significantly, especially during the earliest phases of GSA, specifically throughout the data segments included in Gaia DR3. Some statistics on the processing of GSA (but spanning a longer baseline) are shown in Figure 5.50. Each run of AlertPipe handles on average 60 million transits for 37 million sources (maximum values can reach in excess of 300 million transits for 200 million sources). The vast majority of these measurements are not unusual, or are easily identifiable as spurious (e.g. big dippers, attitude excursions etc, see below), leading to a median raw detection rate of alerts per run, thus about 30 per million sources show anomalous flux behaviour. More detailed filtering, particularly exploring the environment of the candidates leads to a reduction in the median number of candidate alerts by a further factor of . Thus about 20 candidates per run survive to the phase of human eyeballing, and about half of these are published.
Not everything which is found by the detectors is something we wish to alert on and publish. There are many types of false positives, some of which are the real behaviour of real sources (such as periodic variables and asteroids), some of which are spurious behaviour of real sources (such as an increase in flux due to a bright star or planet lying nearby in the along-scan (AL) or across-scan (AC) direction from the source), and some are completely spurious sources (such as apparent new sources reported during attitude excursions, which are in effect the misplaced detections of old sources). Here we describe the mitigations we have put in place for some of the leading causes of false positive alerts. It is worth noting that there has been significant evolution in the rates of the differing types of false positives throughout the Gaia mission. These have arisen from (i) changes to the on-board Gaia detection parameters, (ii) improved mitigations in IDT, combined with updates to the working catalogue, (iii) evolution in our own understanding of the data and identification of spurious events. As an example, in the first half of operations during 2016, we employed a source-density map of the sky to reject all transients found in the most crowded regions (the density map was constructed from the GSA database). Once more thorough environmental filters were developed and tested, the use of the density map was discontinued (i.e. by June 2016).
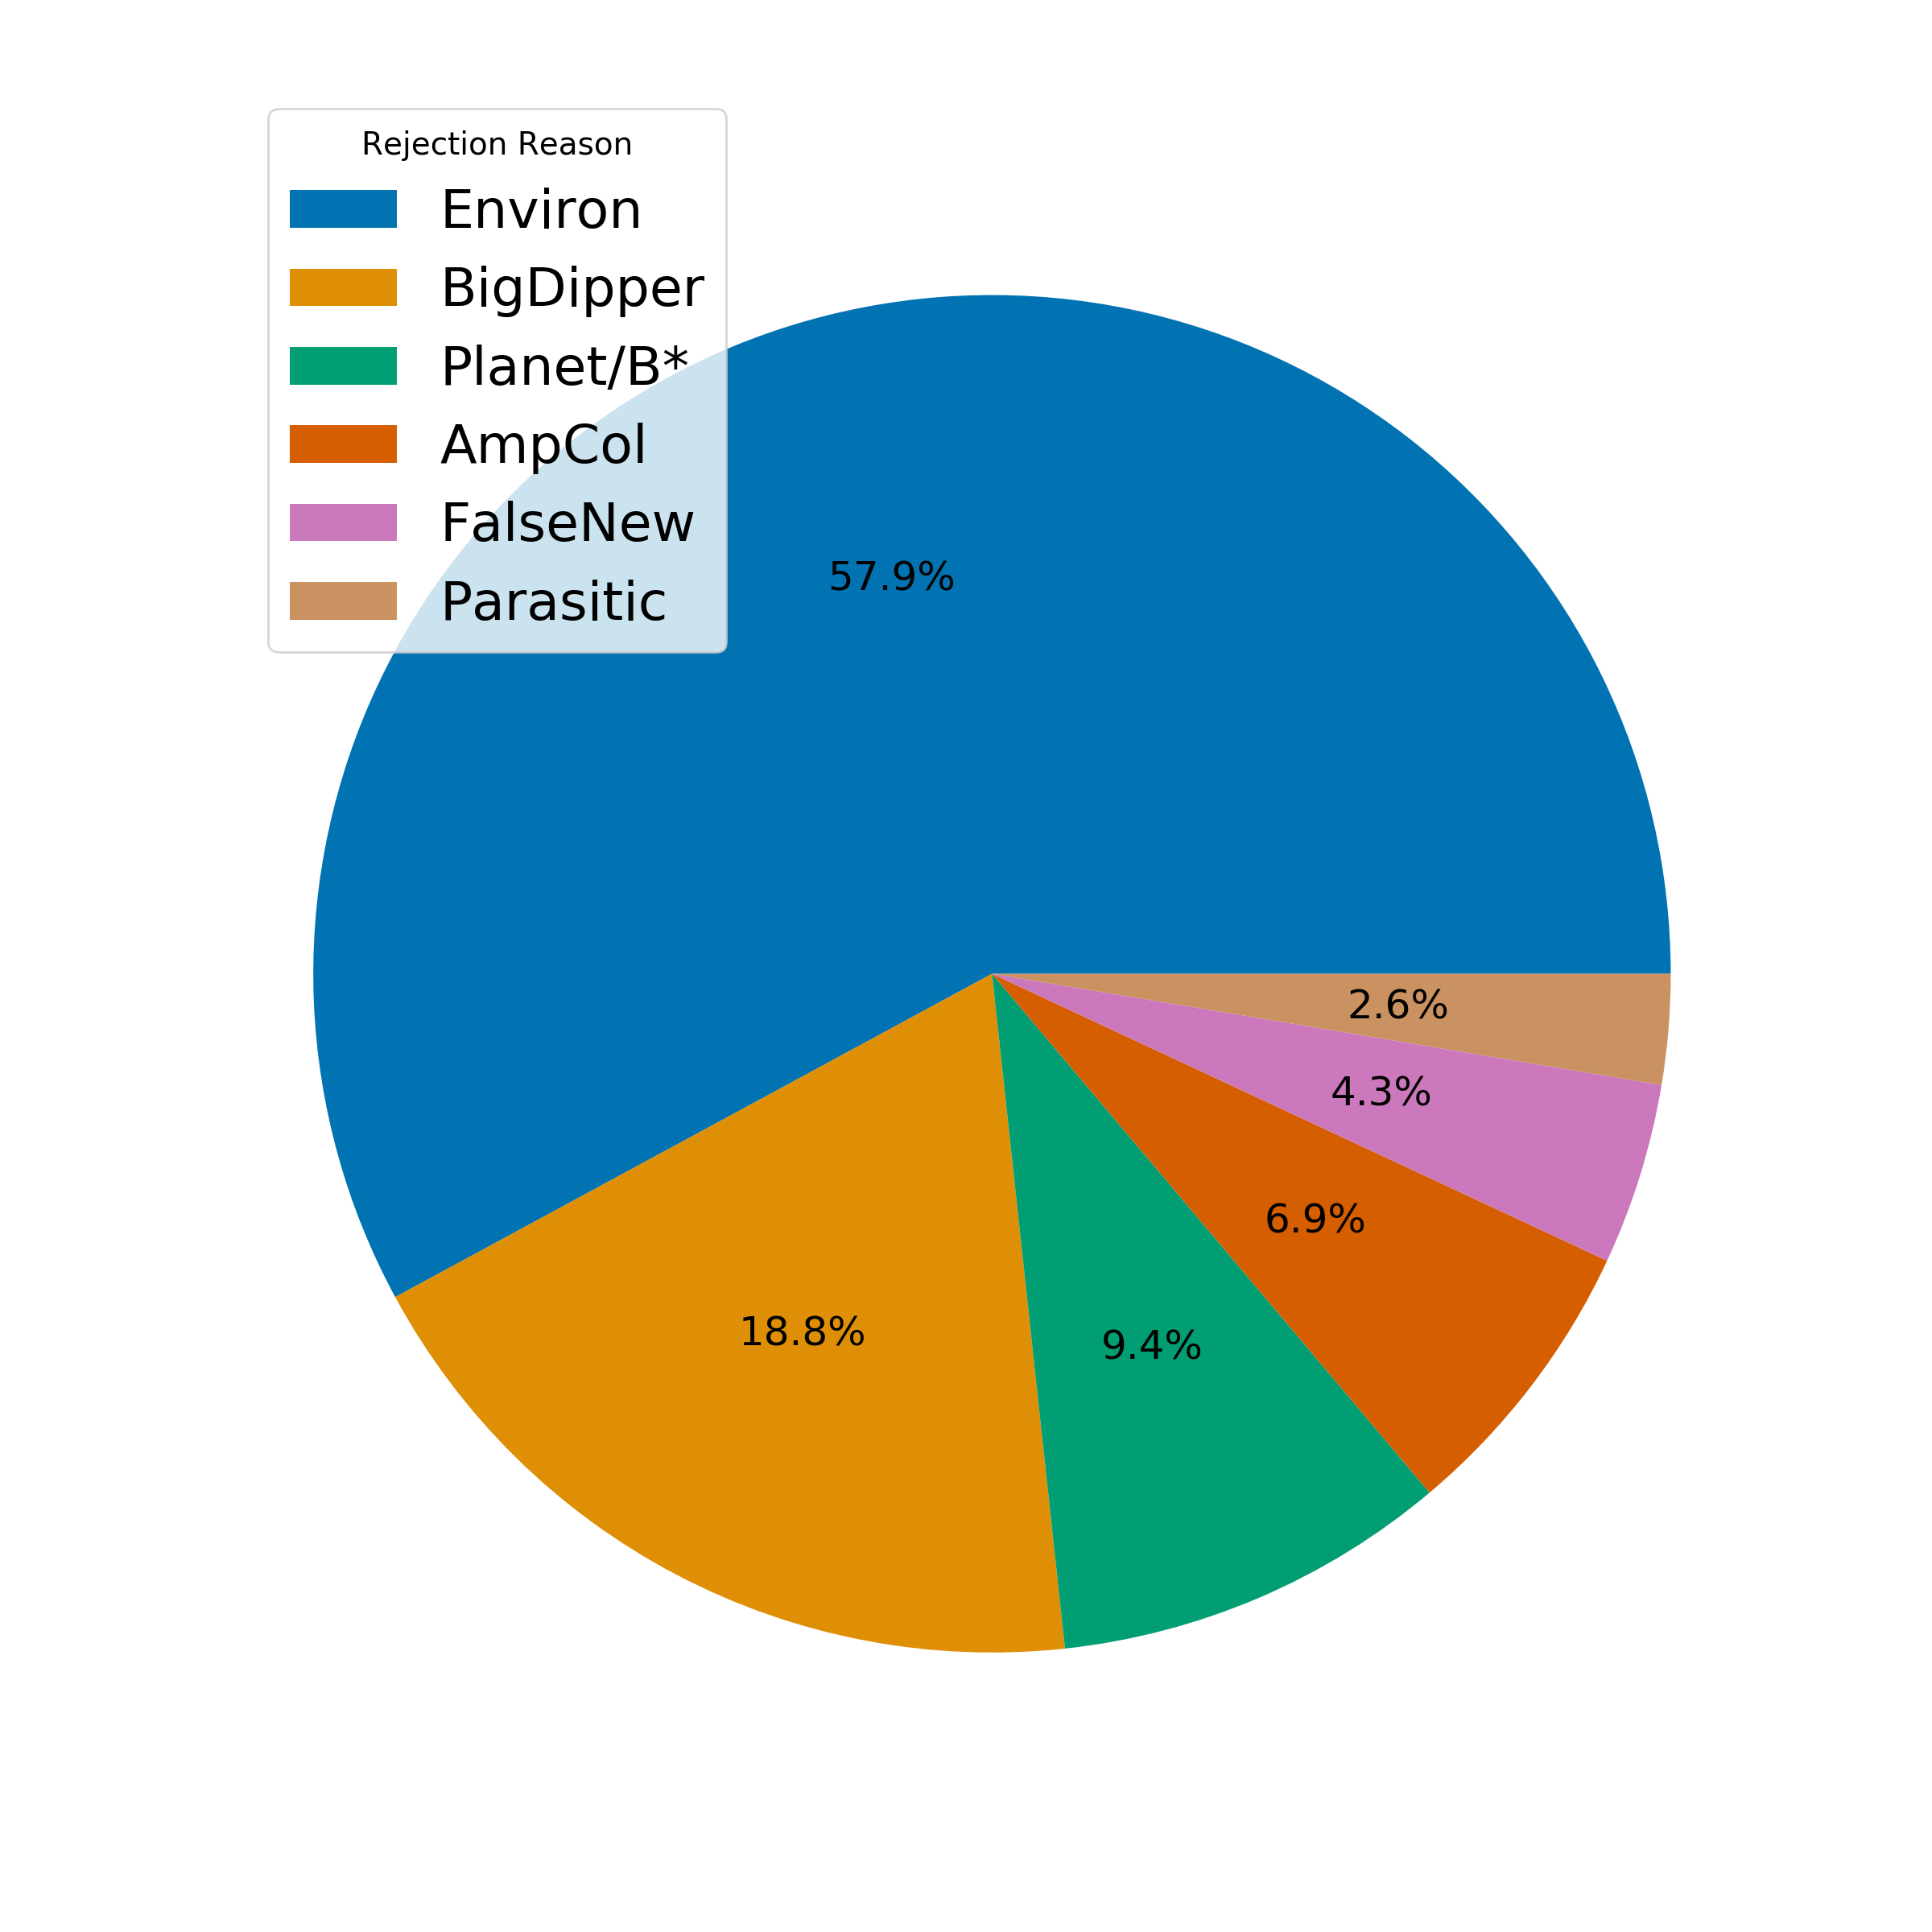
In the following sections we detail the most common types of false positive, which are either trapped and rejected in AlertPipe, or in two cases, flagged for inspection by the eyeball team. The most common types of automatically rejected alerts are summarised in Figure 5.51. The two classes of candidate false alert that require a human decision are (i) Solar System objects (SSO), and (ii) variable star in Gaia DR2. The first case is very rare, and almost always is unrelated to the alert (e.g. a faint SSO is reasonably close to a bright CV candidate). For the second case, the human almost always follows the flag, however due to occasional misclassifications in the variable catalogue, we do not automatically reject candidate alerts that are cross-matched to classified variable stars in Gaia DR2.
Environment: Bright stars and planets
While planets and the very brightest of stars can induce spurious alert candidates over a large area ( degree radius, Fabricius et al. (2016)), less bright stars still have an impact, albeit over a smaller area around their locations. A bright star can cause a spurious alert candidate as a result of flux from a diffraction spike entering into the window of the alert candidate, and producing an apparent increase in magnitude. The amount of additional flux depends on the magnitude of the bright star, the separation, and the alignment with respect to the orientation of the scanning direction (the spikes are asymmetric and aligned in AL and AC).
Alignments in the AC direction between the bright star and the candidate are particularly difficult to deal with as there is no noticeable impact on the goodness-of-fit statistics of the candidate.
Environment: Alignments in AL/AC directions
A common arrangement which produces a large population of spurious OldSourceMeanRms candidates is a neighbour between 1 to 2 arcseconds away in the AC direction. This alignment can result in a significant amount of flux from the neighbouring source entering into the window of the alerting candidate source and producing artificial brightness variations. This arrangement and its effects is illustrated in Figure 5.52.
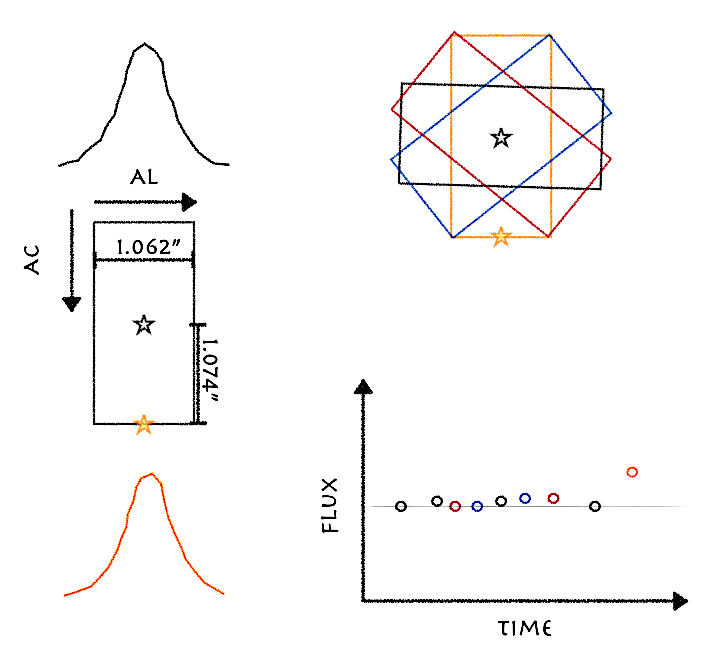
The environment of every alert candidate, therefore, must be examined to reject such artificial flux variations. This assessment is performed in sky coordinates, rather than Gaia detector coordinates. Although sources from both FOVs can be adjacent in pixel coordinates, their differential motion will vary their separation, and thus lead to a variation in flux across the AFs (i.e. within a transit). These alerts are weeded out. The amount of additional flux required to induce an alert candidate depends on the historical magnitude of the candidate and the detector type (faint OldSourceMeanRms alert candidates are the most vulnerable to this effect). Mitigation of this effect may then be expected to depend on the detector, the historical magnitude of the alert candidate and the magnitudes and angular separations to neighbouring stars which are as bright or brighter than the alert candidate.
The exact implementation of the environmental assessment is based on empirically derived magnitudes and angular separation distances as well as computational considerations. Extending the environmental search out beyond 10 arcseconds for every alert candidate becomes infeasible in terms of CPU time. Instead for the brightest of sources (planets and the top 30 brightest stars) the environmental search is done in reverse by finding all the alert candidates near them. There is a subset of alert candidates caused by environmental effects, therefore, which could survive to the eyeballing stage (see Section 5.7.2) should there be a bright enough star beyond 10 arcseconds. However, these are sufficiently few in number to be dealt with at that stage.
While not an every day occurrence, when the location of Jupiter, Saturn or Venus is near the scanning path of Gaia they can cause many spurious alert candidates by increasing the apparent fluxes of sources. The same is true for some of the brightest stars in the sky. Hence all alert candidates within 2 degrees of a planet or one of the top 30 brightest stars in the sky are assessed.
The local (within 10 arcsecond) environmental assessment is performed as follows:
-
•
All alert candidates are rejected if they are not the brightest source by at least 1 magnitude in a 1.5 arcsecond radius about their median position. For DeltaMag and OldSourceMeanRms alert candidates this radius is extended to 2 arcseconds.
-
•
NewSource, DeltaMag and OldSourceMeanRms alert candidates are rejected if there is a neighbouring source within 10 arcseconds which is brighter than mag.
-
•
NewSource alert candidates with a source in the AL or AC direction within 10 arcseconds and may be rejected depending on the relative magnitudes of the two sources, as spurious non-excluded detections may still occur due to the AL/AC PSF spikes of these sources.
-
•
The rejection criteria for DeltaMag and OldSourceMeanRms alert candidates are stricter, as sources fainter than in the AL/AC directions may still cause a brightening in an existing source even if they cannot cause an entirely spurious detection. For these alert candidates, if the alert is due to the brightening of the candidate, any source within 10 arcseconds in the AL/AC direction may lead to a rejection, again depending on the relative magnitudes of the two sources.
-
•
Note that OldSourceSkewVonN candidates undergo less filtering as the detector is sensitive to long-term changes rather than short term ones produced by unfavourable alignments.
All DeltaMag and OldSourceMeanRms alert candidates with an historic magnitude fainter than 19, and within 2 degrees of a planet or one of the top 30 brightest stars in the sky, are immediately discarded. For the remaining alert candidates, their positions in AL and AC with respect to the planet or bright star are evaluated, and any candidates in a predetermined box around the planet are rejected. The size of the box is determined by the area in which there is a clear excess of alerts. The size of the box is larger in area for OldSourceMeanRms candidates, than for DeltaMag candidates, whereas OldSourceSkewVonN alert candidates use the same exclusion region as the DeltaMag candidates if the change in magnitude from the historic magnitude is less than 0.5 magnitudes. If the change in magnitude is greater than this, they are not automatically discarded. The box size is always at least a degree wide in AL and always more than 1.5 degrees in AC.
Environment: Big Dippers
Early on it was noticed that there were large numbers of alert candidates which had alerted due to their associated source having dimmed by several magnitudes. These sources were predominately in the magnitude range . Further investigations revealed the position of the alerting transit to be offset from the median source position. It is thought that these observations are due to bright-star artefacts, where the on-board algorithm detects the spikes of the point-spread function, resulting in a fainter measurement for the same sourceId.
For brighter stars () these spurious offset transits are successfully excluded by IDT, at least in the vicinity of the star itself, and hence removed from the data-stream for AlertPipe. However, this proved not to be the case for fainter stars and additional processing was required to remove the resultant alerts from the list of candidates. This was done by evaluating the median position of the source and rejecting any alert caused by a drop in magnitude and a transit located more than 0.3 arcseconds from this position. Note a transit which brightens and is offset is not rejected, to allow the discovery of supernovae whose host galaxies are detected by Gaia. This source of spurious alerts was significantly reduced once IDT updated their algorithm to include the region around fainter sources when excluding transits which are due to this effect.
Attitude excursion
Large scale attitude excursions are rare events, but when they occur they can render the data unusable. In GSA, an indicative measure of the reconstructed attitude is achieved per IDT run by accumulating the offsets in AL and AC of each transit of a NewSource alert candidate to the median position of the source in question (we recall that a NewSource alert must have at least two transits in order to be an alert candidate). The width of the distribution of the AL and AC offset may then be compared against that expected. These offsets may also be displayed as a function of time, highlighting periods of excess error. Diagnostic plots are created for each IDT run, and form part of the final verification process described in Section 5.7.2. Additionally, as large scale attitude excursions generate many spurious NewSource alert candidates, any NewSource alert candidate which does not have at least two transits located within 0.3 arcseconds from the median position of the source, is rejected automatically. Smaller shorter-term attitude excursions rely on the final inspection step prior to publication for their rejection, where the location of the alerting transits are compared to those of the other transits belonging to the source.
Prompt particle events
Prompt particle events (PPEs) are high-energy particles, such as cosmic rays or trapped protons from the Solar wind, which may cause noise in the signal read out from Gaia’s CCDs.
Parasitic sources
Parasitics are instances where a source from the other FOV happens to be projected onto the same location on the AF CCDs (see Fig. 1 in (Wevers et al. 2018)). As the AC rate is different for the other FOV, and thus the star-path is not parallel, this projection only contributes to a few of the AF CCDs along the transit rather than all of them. It is for this reason that we require eight reliable (as defined using IDT’s flags) AF flux measurements per transit and take the median value (and its error computed by median absolute deviation statistics) for the value of the transit’s flux and its error.
In addition, for the OldSourceMeanRms alert candidates, the goodness-of-fit (GoF) measures of the PSF/LSF to the transits are used as an additional means to reject suspicious candidates. The GoFs belonging to the alerting transits are compared against the expected GoF from the historical transits, and if there are too many significant outliers in the alerting transits the candidate is rejected. Note that the GoF has a magnitude dependence so this method is not applied to the DeltaMag alert candidates.
Solar System Objects
As part of the DPAC processing system, the predicted Gaia transits of SSOs are calculated roughly every year and shared with GSA (Mignard (2016)). The transit times are accurate to seconds and account for planned changes to the Gaia Nominal Scanning Law.
If an alert candidate is found to be within 2 arcminutes of the expected location of a known SSO as seen by Gaia the candidate is flagged as a tentative match, if it is within 2 arcseconds then it is flagged as a probable match. An associated match probability is calculated, which depends not only on angular separation, but also on the magnitude difference between SSO and alert candidate. The flagging does not remove the candidate automatically, but this information is retained for the final verification step prior to publications, see Section 5.7.2, where the likelihood that the alert candidate is due to the observation of the SSO may be assessed.
Eyeballing
After detection and filtering, surviving alert candidates are subject to human evaluation using a bespoke web application (the current version was implemented in April 2018). This presents team-members with a series of figures and charts displaying Gaia and ancillary data. These data are used by the eyeballer to rank the candidate with a score between -1 and +1. A comment box is provided for the eyeballer to describe the event for the community, and a dialogue box enables internal discussion between eyeballers. The published comment is limited to 100 characters, and draws on the eyeballer’s experience to try to describe the event as succinctly as possible. The eyeballer may sometimes make an estimate of a possible classification. Votes from a minimum of two eyeballers, with a net score of +2, are required for an alert to be deemed publishable. A total of 15 people have contributed to the eyeballing of Gaia Alerts over the duration.
The Gaia data currently made available to the eyeballer include the following items:
-
•
the calibrated lightcurve, including the photometric scatter within a transit;
-
•
the line spread function goodness-of-fit vs. time of the alerting source, derived from the image parameter determination in IDT (Fabricius et al. 2016);
-
•
all near-neighbour Gaia transits within 10 arcsecs of the alert, projected in RA-Dec and AL-AC directions;
-
•
radial distribution of all neighbour transits out to 10 arcseconds (magnitude versus separation);
-
•
uncalibrated BP/RP spectra showing the evolution of the source before and after alert (if available);
-
•
the probability of a known Solar System object crossing the FOV;
-
•
a flag if the source is already classified as a long-period variable star in Gaia DR2 (Holl et al. (2018));
-
•
Gaia DR2 parameters (including parallax, proper motion, BP/RP colour);
-
•
HR diagram with the candidate superimposed (when possible).
Between 2014 and August 2018 we also applied a classifier (GS-TEC, Blagorodnova et al. (2014)) to the raw BP/RP spectra, and shared the results with the eyeballers. GS-TEC takes a Bayesian approach to model observed spectra, using a constructed reference spectral library and literature-driven priors. GS-TEC can classify SN, AGN and stars down to =19, however the classifier was disabled due to its significant execution time.
Auxiliary data are parsed from a variety of sources, and presented to the eyeballers, to help understand the context of a Gaia transient detection.
-
•
To allow a visual inspection of the alert’s location, the Eyeballing App shows the Aladin Lite (Boch and Fernique 2014) and SDSS finding charts.
-
•
Results of positional queries to the Simbad (Wenger et al. 2000), NED and VSX databases, to determine whether it is an already-known transient or variable object. (The NASA/IPAC Extragalactic Database (NED) is funded by the National Aeronautics and Space Administration and operated by the California Institute of Technology. VSX is the International Variable Star Index database, operated at AAVSO, Cambridge, Massachusetts, USA.)
-
•
The list of YSOs described in (Hodgkin et al. 2021).
-
•
To aid the rejection of spurious transients arising from contamination by Solar System objects, we also display data on nearby planets, their satellites, and minor planets. In the early phases of GSA we used SkyBot (Berthier et al. (2016)), but we now exploit ephemerides shared within DPAC (see also Section 5.7.2).
-
•
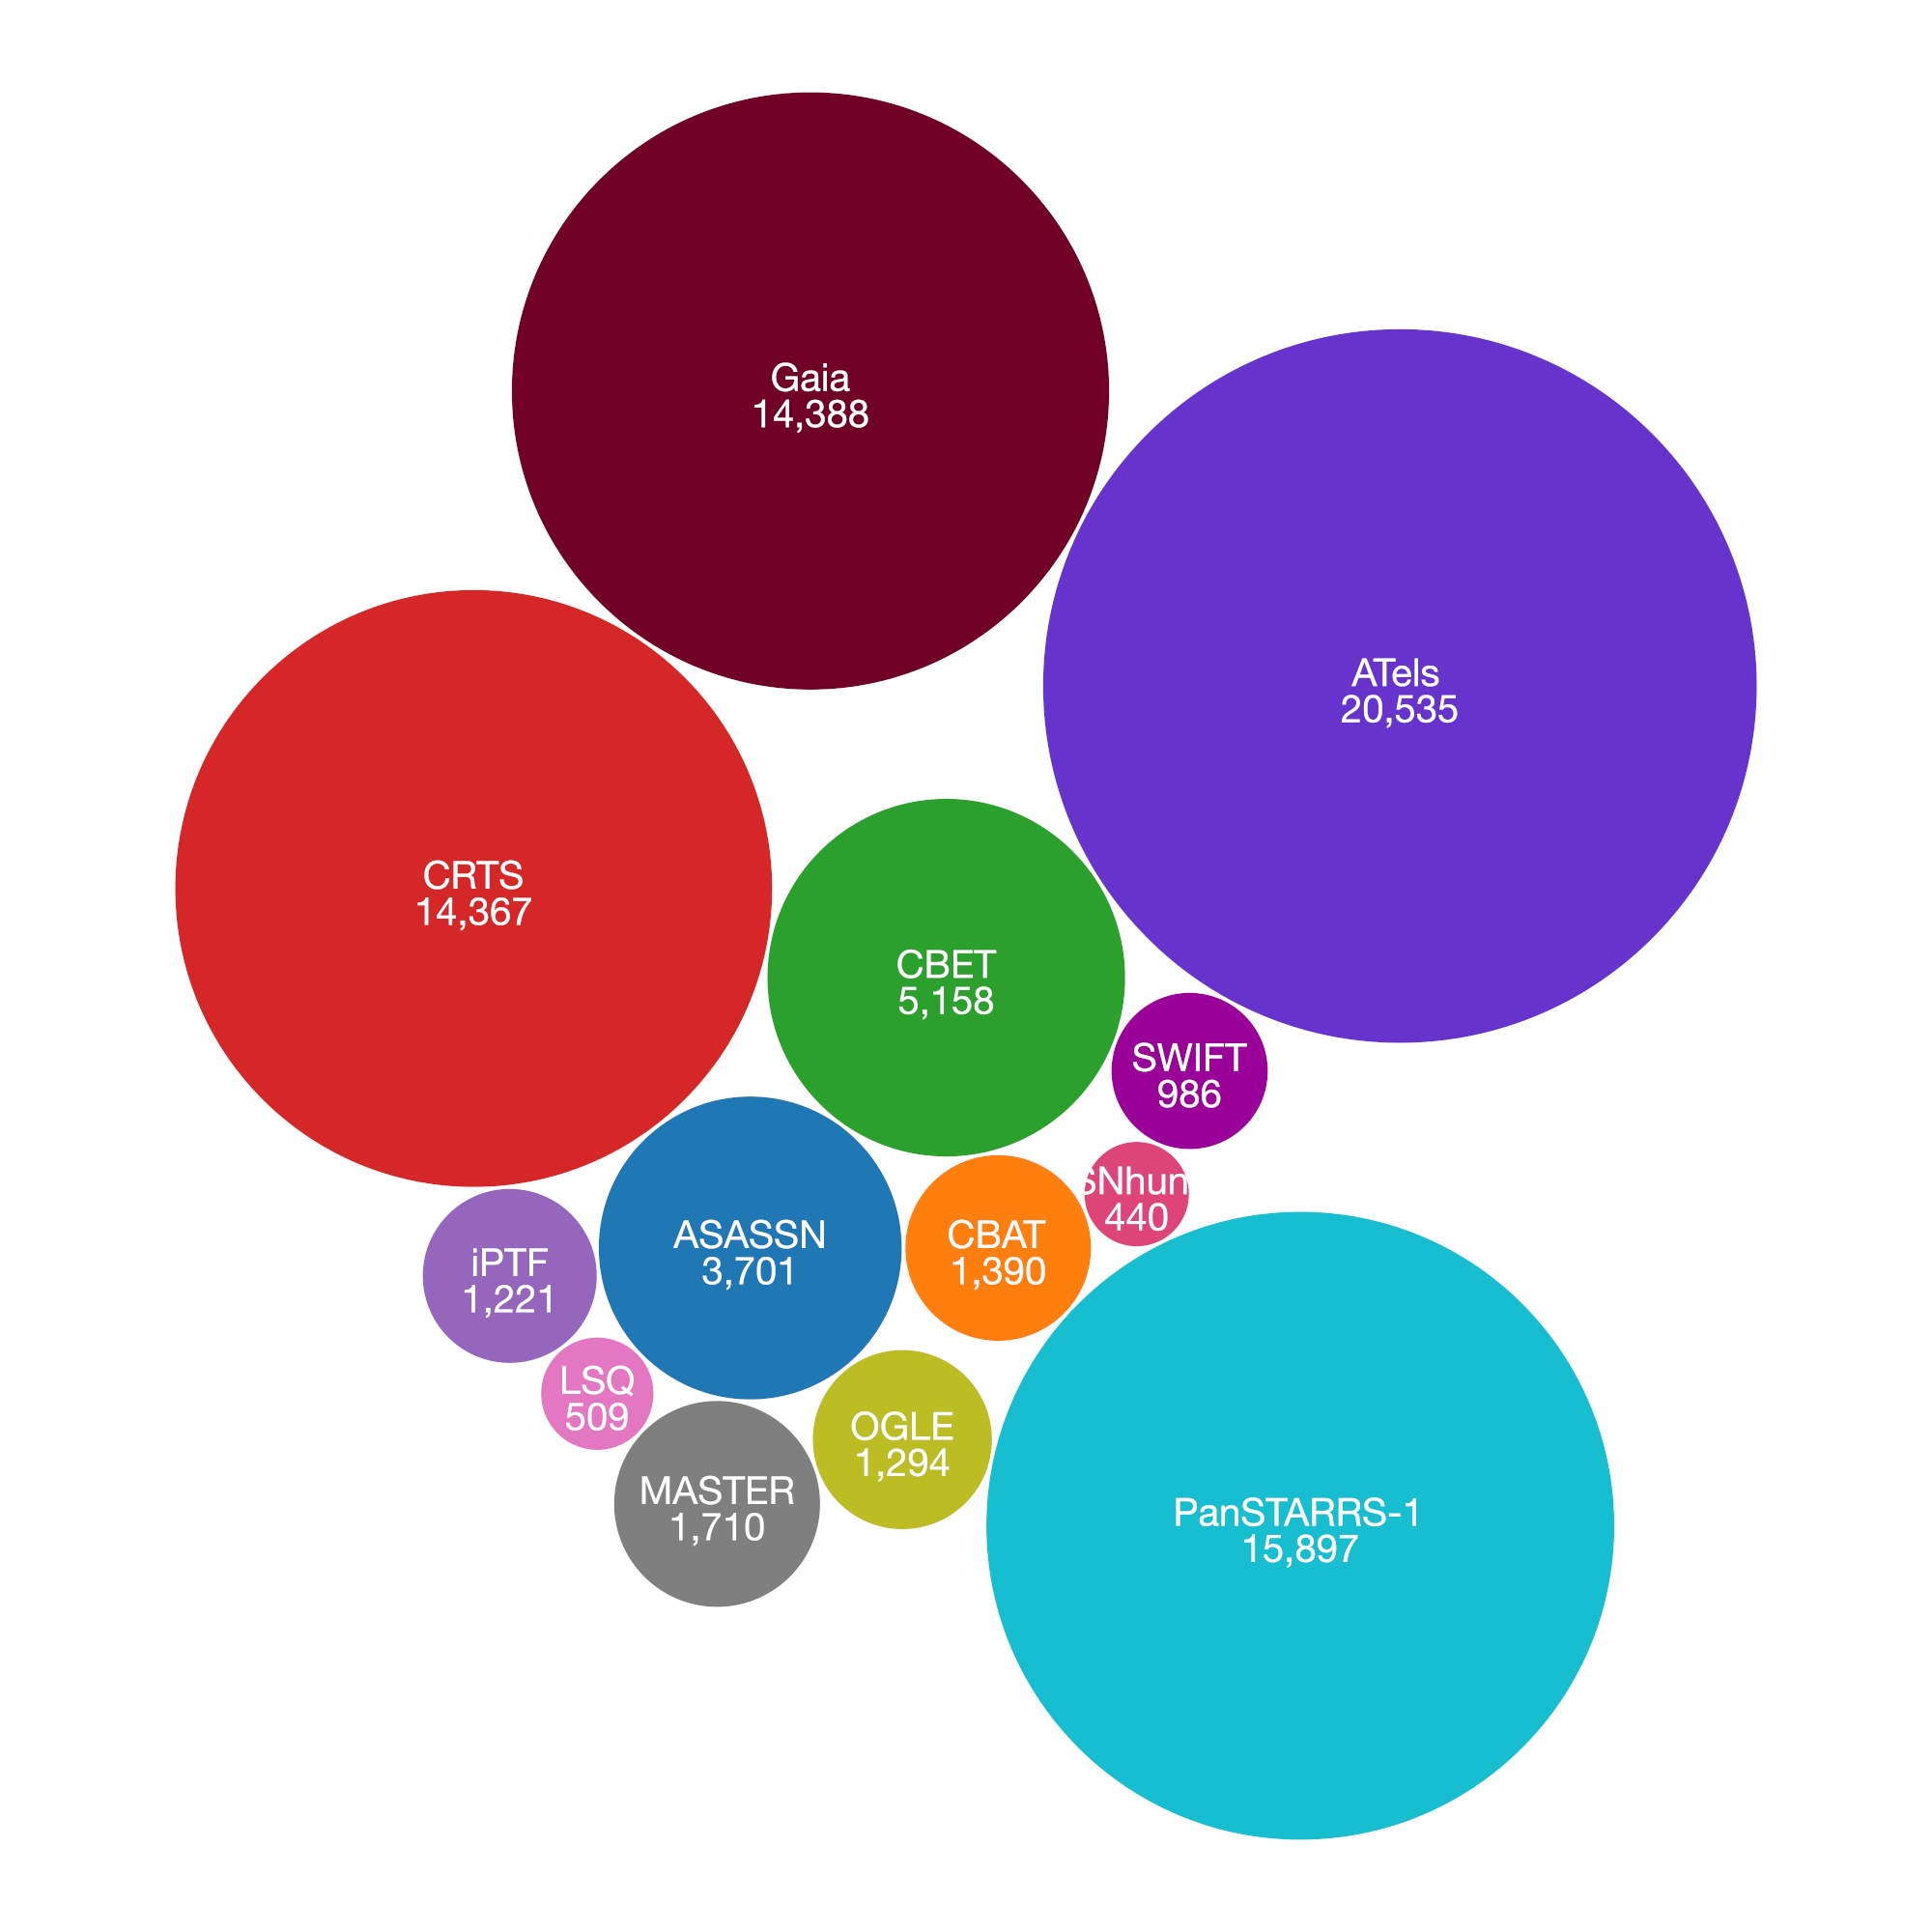
Results of positional cross-match against our own tables of transient events, assembled from the hourly parsing of a significant collection of other publicly available transient surveys. An ETL (Extract Transform Load) system gathers discoveries reported by the major transient survey websites: Transient Name Server (TNS), Catalina Real-Time Transient Survey (Drake et al. (2009)), ASAS-SN (Shappee et al. (2014), Pan-STARRS1 (Kaiser et al. (2010)), OGLE IV (Kozłowski et al. (2013), Wyrzykowski et al. (2014)), MASTER (Lipunov et al. (2010)), iPTF (Law et al. (2009)), La Silla Quest (Baltay et al. (2013)) and IAU Central Bureau for Astronomical Telegrams (CBAT, http://www.cbat.eps.harvard.edu/index.html). Every hour, a total of 27 websites are scraped for data that are transformed, cleaned, homogenised and stored in the GSA database. In a similar manner, Astronomer’s Telegrams are automatically parsed and stored in the database, accounting for the very diverse formats in the content of these HTML pages. The data stored in the GSA database for the external transient surveys is shown in Figure 5.53.
-
•
These data also contain classification information for large numbers of transient events which are shared with the eyeballer, and used at the point of publication. Classifications often arrive to the database after publication of an alert. As part of the publisher app, these can be viewed and the alert record updated (at the discretion of the operator). The bulk of classifications are reported via TNS (supernovae for the most part), but we also receive classifications on microlensing events from the Warsaw group through the publisher app (see Wyrzykowski et al. (2020)).
Publication
Once eyeballing is complete, successful alerts are made publicly available to the astronomical community in several formats: via a dedicated website in CSV, HTML and RSS formats with permanent URLs for every published alert (http://gsaweb.ast.cam.ac.uk/alerts); via the IAU-Transient Name Server (https://www.wis-tns.org/); as VOEvents using the 4 Pi Sky broker (https://4pisky.org/voevents/). The GSA web application (Delgado et al. (2019b), Delgado et al. (2019a)) has a public facing side where a set of the information is published, and a restricted area for administration and bookkeeping. The Gaia alerts catalogue can also be visualised on an All-Sky interface developed using Aladin Lite (Boch and Fernique 2014) enabling the display of alerts by time or individually.
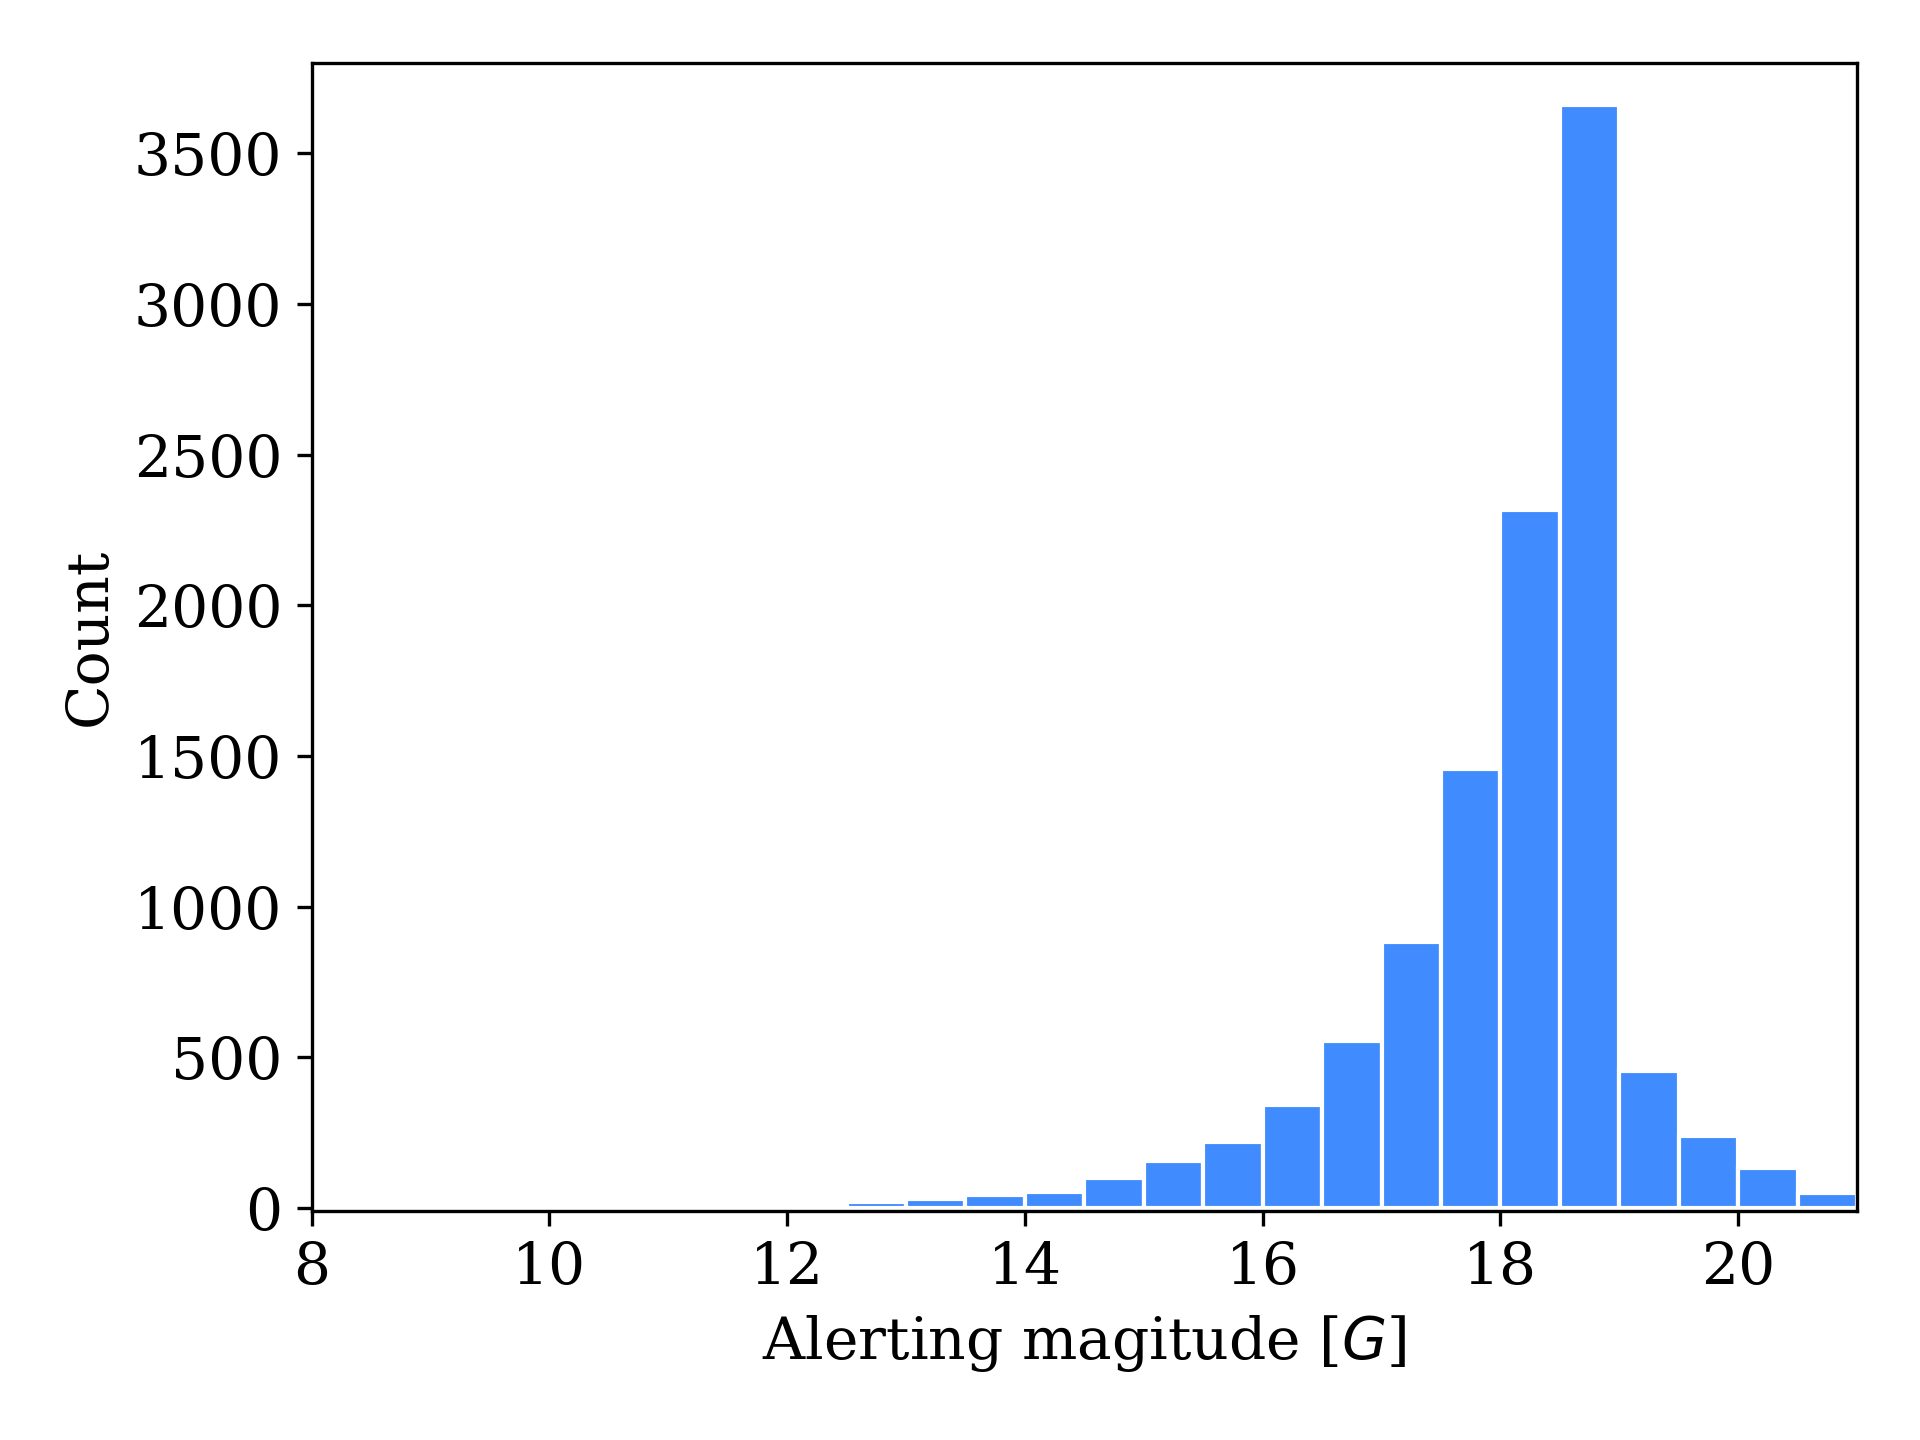
For a limited time, the set of information published also included a small number of RVS transit spectra (27 spectra for 12 alerts: see Seabroke et al. (2020)). This number is small for several reasons: (1) most detected alerts are much fainter than the limiting magnitude of RVS ( mag, while mag for the alerts) see Figure 5.54; (2) RVS covers only four of the seven Gaia CCD rows; (3) RVS spectra have much lower signal-to-noise than the other GSA measurements at the same magnitude; (4) the pipeline used to produce the RVS spectra of alerts did not process blended windows or take into account flux from sources without windows (an issue because the majority of alerts with RVS spectra are close to the Galactic plane). The RVS pipeline now treats these issues and all RVS transit spectra will be published in Gaia’s fourth data release. This should provide additional useful diagnostic information for the brightest alerts.
Once an alert is published for a source, the alert page is permanent. New data from Gaia concerning that source are added to its lightcurve as they become available. Hence, the published description of the source is mutable and represents the most recent information available. The state of the source at the time of the alert is preserved in the VOEvent document released to the 4 PI SKY event-broker (Staley and Fender 2016) at the time that the alert is first raised. Once an alert is raised on a source, no second alert can be raised on the same source, even when subsequent events occur, for example in the case of repeated outbursts.
If an alert candidate does not pass the aforementioned filtering/eyeballing steps, future observations can raise another alert for the same source, which will then be re-evaluated, possibly leading to publication. Between the IDT runs 1046 and 4724 inclusive there were 556 published alerts which had previously alerted but were not published at that time (out of a total of 9969 alerts, i.e. 5.6 per cent).