5.7.1 Introduction
The Gaia Photometric Science Alerts system (abbreviated as GSA) is responsible for the discovery of transient phenomena in the Gaia sky. These are astrophysical events which are typically short-lived (days to years), non-periodic, and could benefit from a timely response (e.g. spectroscopic or photometric follow-up). This is a distinct process from the Gaia Follow-Up Network for Solar System Objects (abbreviated as Gaia FUN-SSO, see https://gaiafunsso.imcce.fr/).
GSA is a near-real-time system which runs on a daily basis. GSA takes inputs from IDT, and ingests the data into a (PostgreSQL) database, while scanning for new sources in the Gaia sky, or significant changes in brightness of known sources (we consider both brightening and dimming events).
The Gaia DR3 data release includes 2612 events discovered by GSA during Data Segments 0–3, within the range of dates: 2014-07-25T10:38:47.343197764 TCB (OBMT 1078.4 REVS) to 2017-05-28T08:50:48.615883742 TCB (OBMT=5230.1 REVS), i.e. the first 34 months of the mission. The GSA software evolved significantly during this period, and for a more detailed description of changes to the system, and an overview of the currently operating system, see Hodgkin et al. (2021). The sample of alerts included in Gaia DR3 is incomplete, and is missing 130 events which were detected and published from data taken in Segments 0–3. These are discussed in Section 5.7.4.
The GSA website hosts a complete set of all the alerts we have ever published, and continues to be updated as more events are triggered. The Gaia DR3 data release includes only a subset of these events, and limited information for each event. We advise users to access the machine readable information via https://gsaweb.ast.cam.ac.uk/alerts/alertsindex for a complete set of the available data (including epoch photometry, images of uncalibrated epoch BP/RP spectroscopy, and classifications as they become available).
We also publish all Gaia alerts via TNS entries and as VOEvents (see Section 5.7.2). The data submitted as VOEvents and TNS entries are fixed and immutable, while the data presented on the GSA website evolve as more data are added to existing transients (if available), or calibrations of previous measurements change.
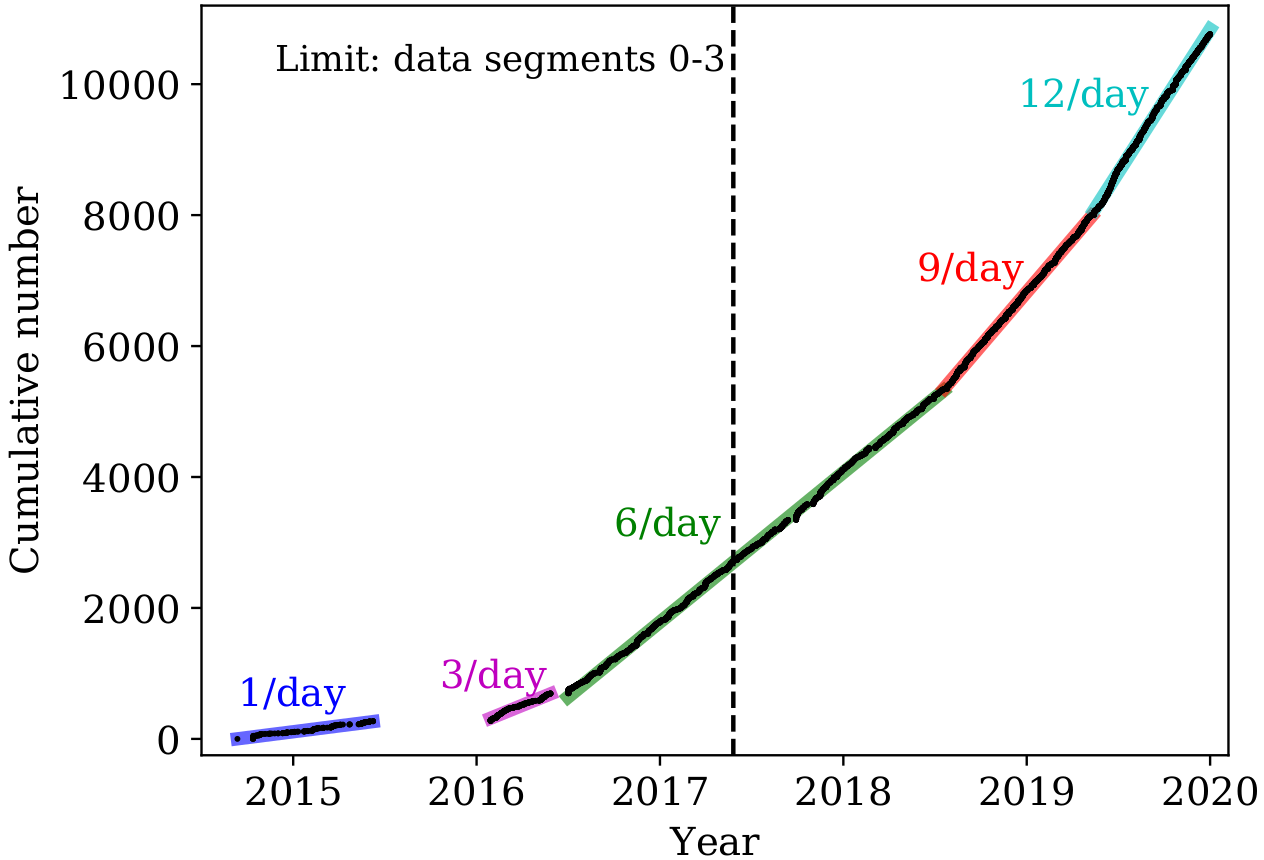
The main phases included in Gaia DR3 are listed below, and shown in Figure 5.47.
-
•
From September 2014 – June 2015: An initial commissioning phase, spanning almost 300 days, when we published alerts at a rate of about one event per day.
-
•
From June 2015 – January 2016: A pause in operations, where we developed most of the filters discussed in Section 5.7.2, to minimise the rate of spurious detections.
-
•
January 2016: We restarted operations for AlertPipe and Alert publication. A density map was implemented to ignore events arising in the most crowded regions of sky.
-
•
June 2016: Following further improvements to environment filtering, we removed the density map restriction.
A number of significant developments which post-date the Gaia DR3 date range are listed here for context, and are discussed in more detail in Hodgkin et al. (2021):
-
•
June 2017: Salvaging of Alerts.
-
•
April 2018: Eyeballing App introduced.
-
•
June 2018: Photometric One Day Calibration (PODC) introduced.
-
•
May 2019: OldSourceSkewVonN detector introduced.
For the alerts included in Gaia DR3, GSA ran on uncalibrated Gaia IDT photometry during data Segments 0,1 and 2. This was followed by a period (almost one year) where a simplistic calibration model (supplied by CU5) was used during data Segment 3 (23-05-2016 to 28-05-2017).
Additional and significant changes were made to the software after the end of Data Segment 3. These included the introduction of a new photometric calibration (the Photometric One Day Calibration, PODC), as well as improvements to alert detection methods, and spurious event rejection techniques (see Hodgkin et al. (2021) for more details).