Extensive verification has been carried out on the outputs of the photometric processing.
Here only a summary of the validation is given. More details can be found in Evans et al. (2018).
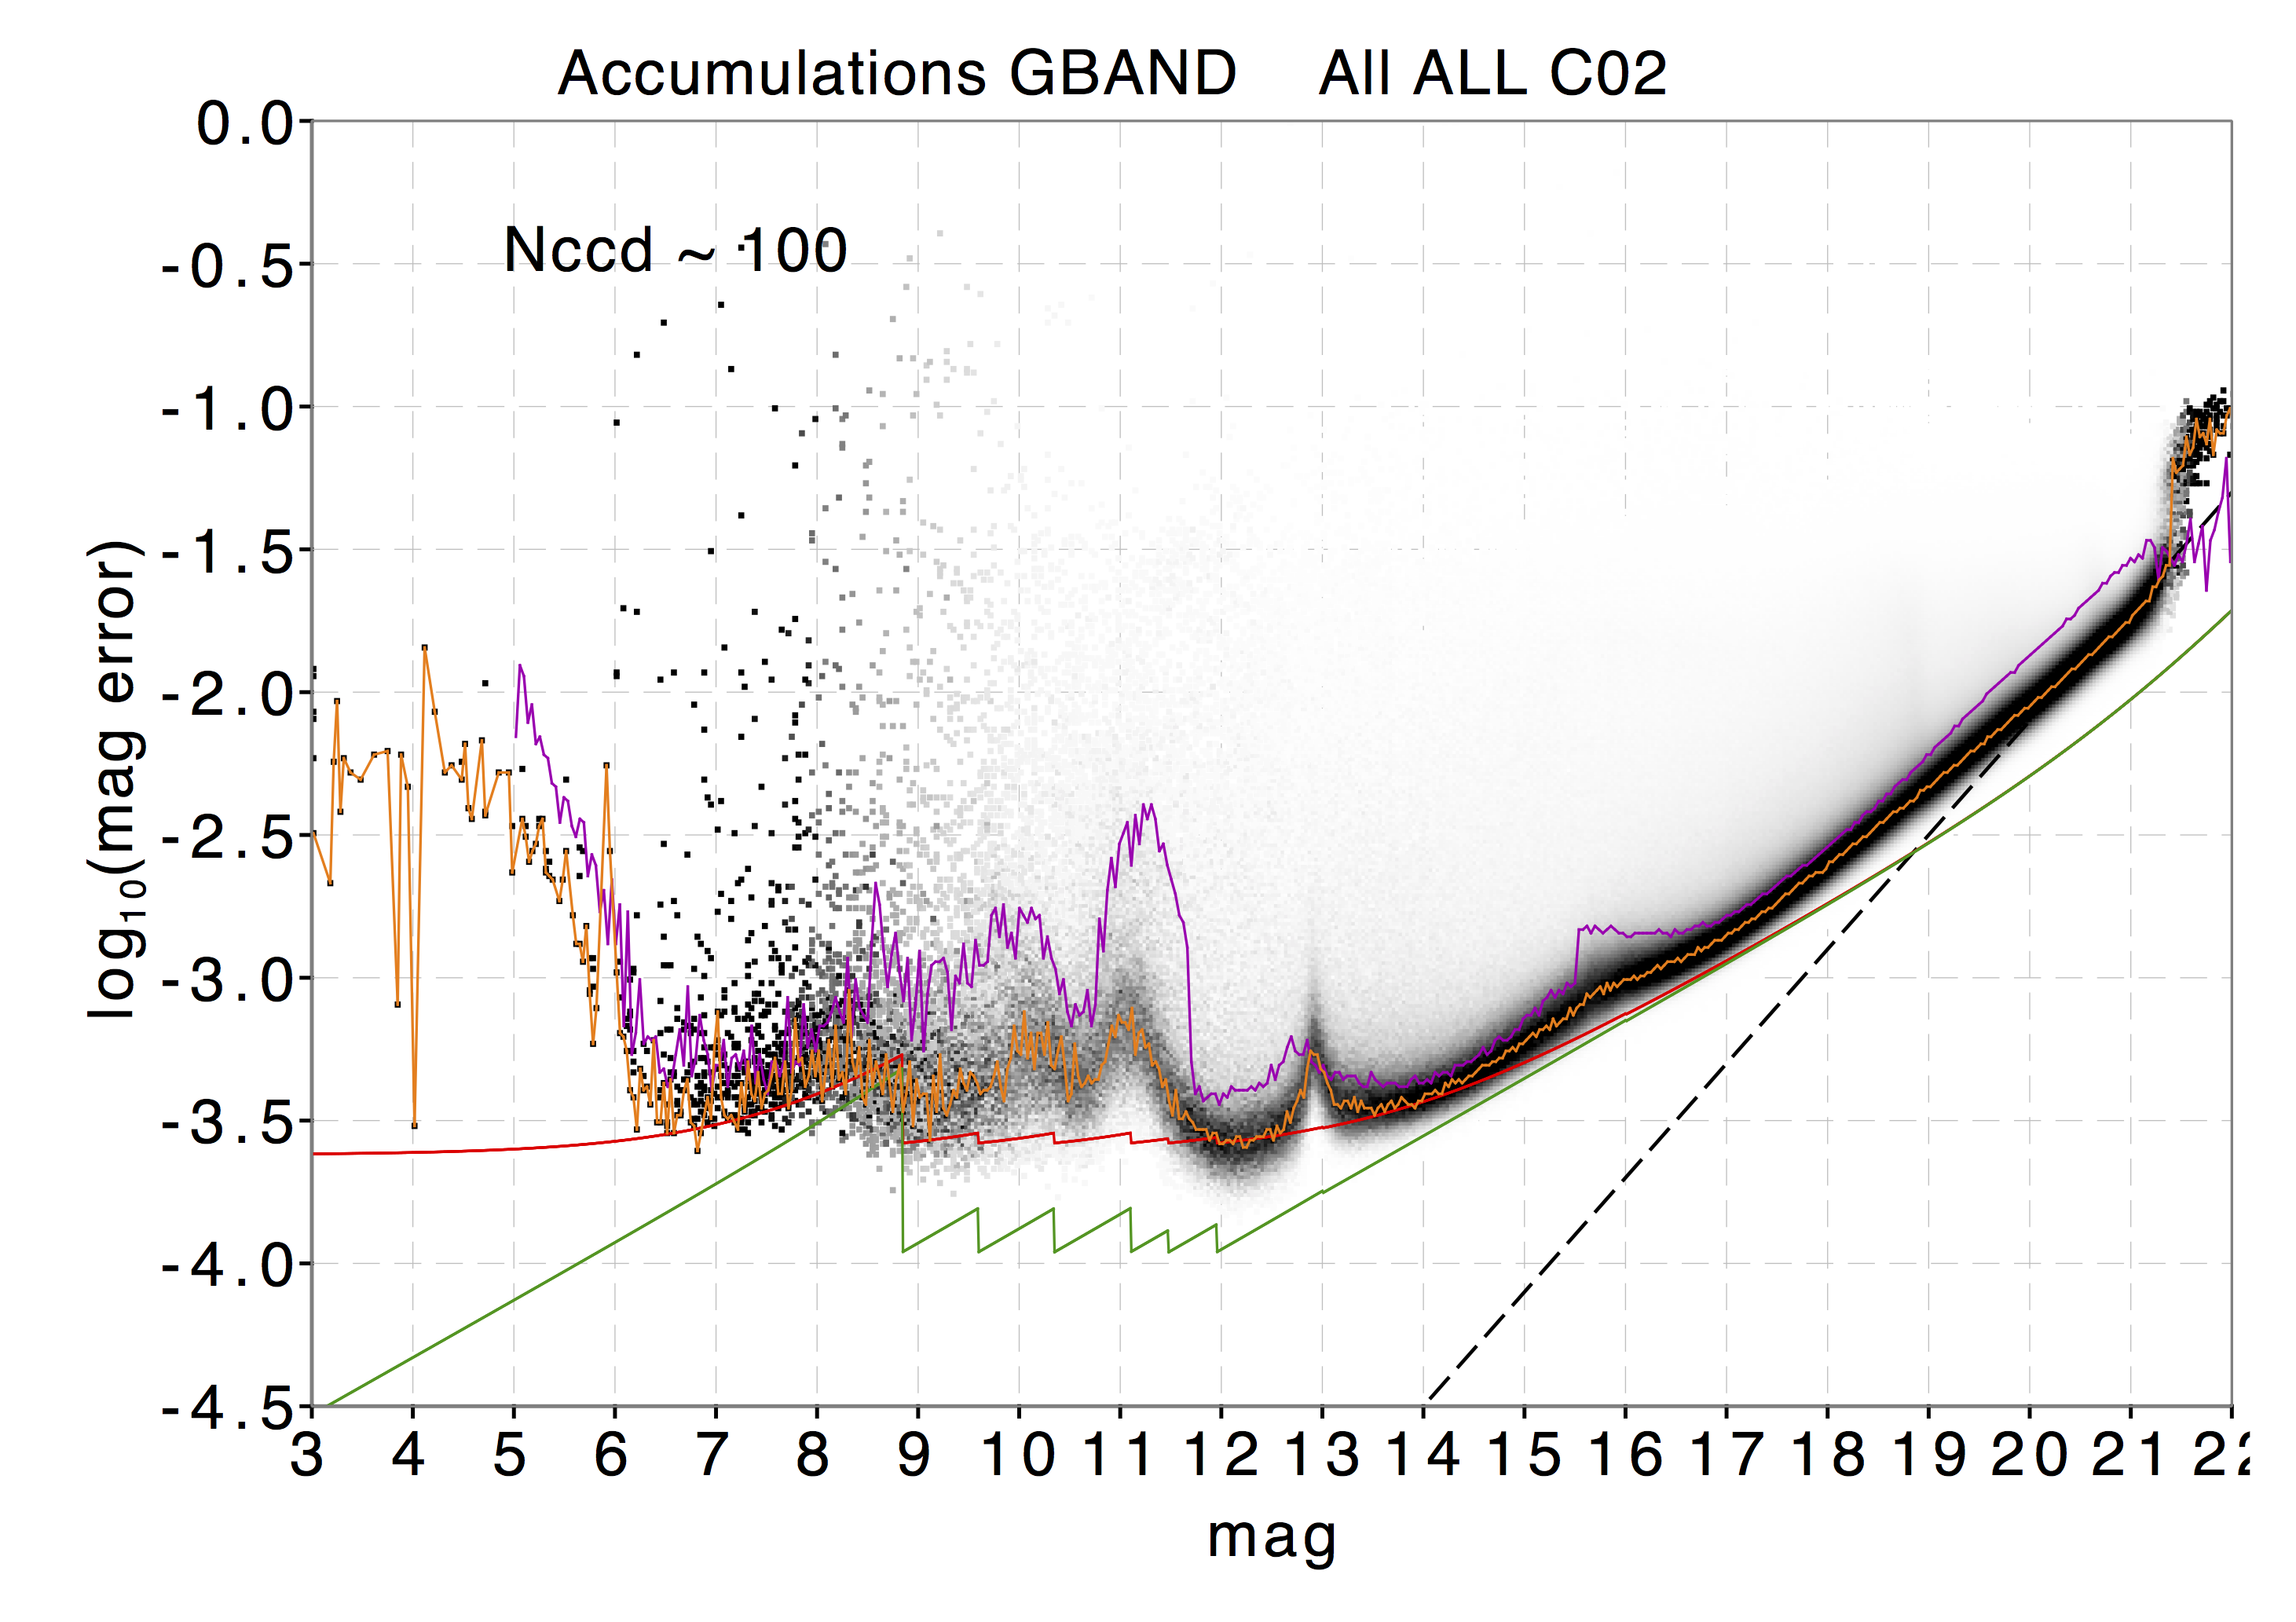
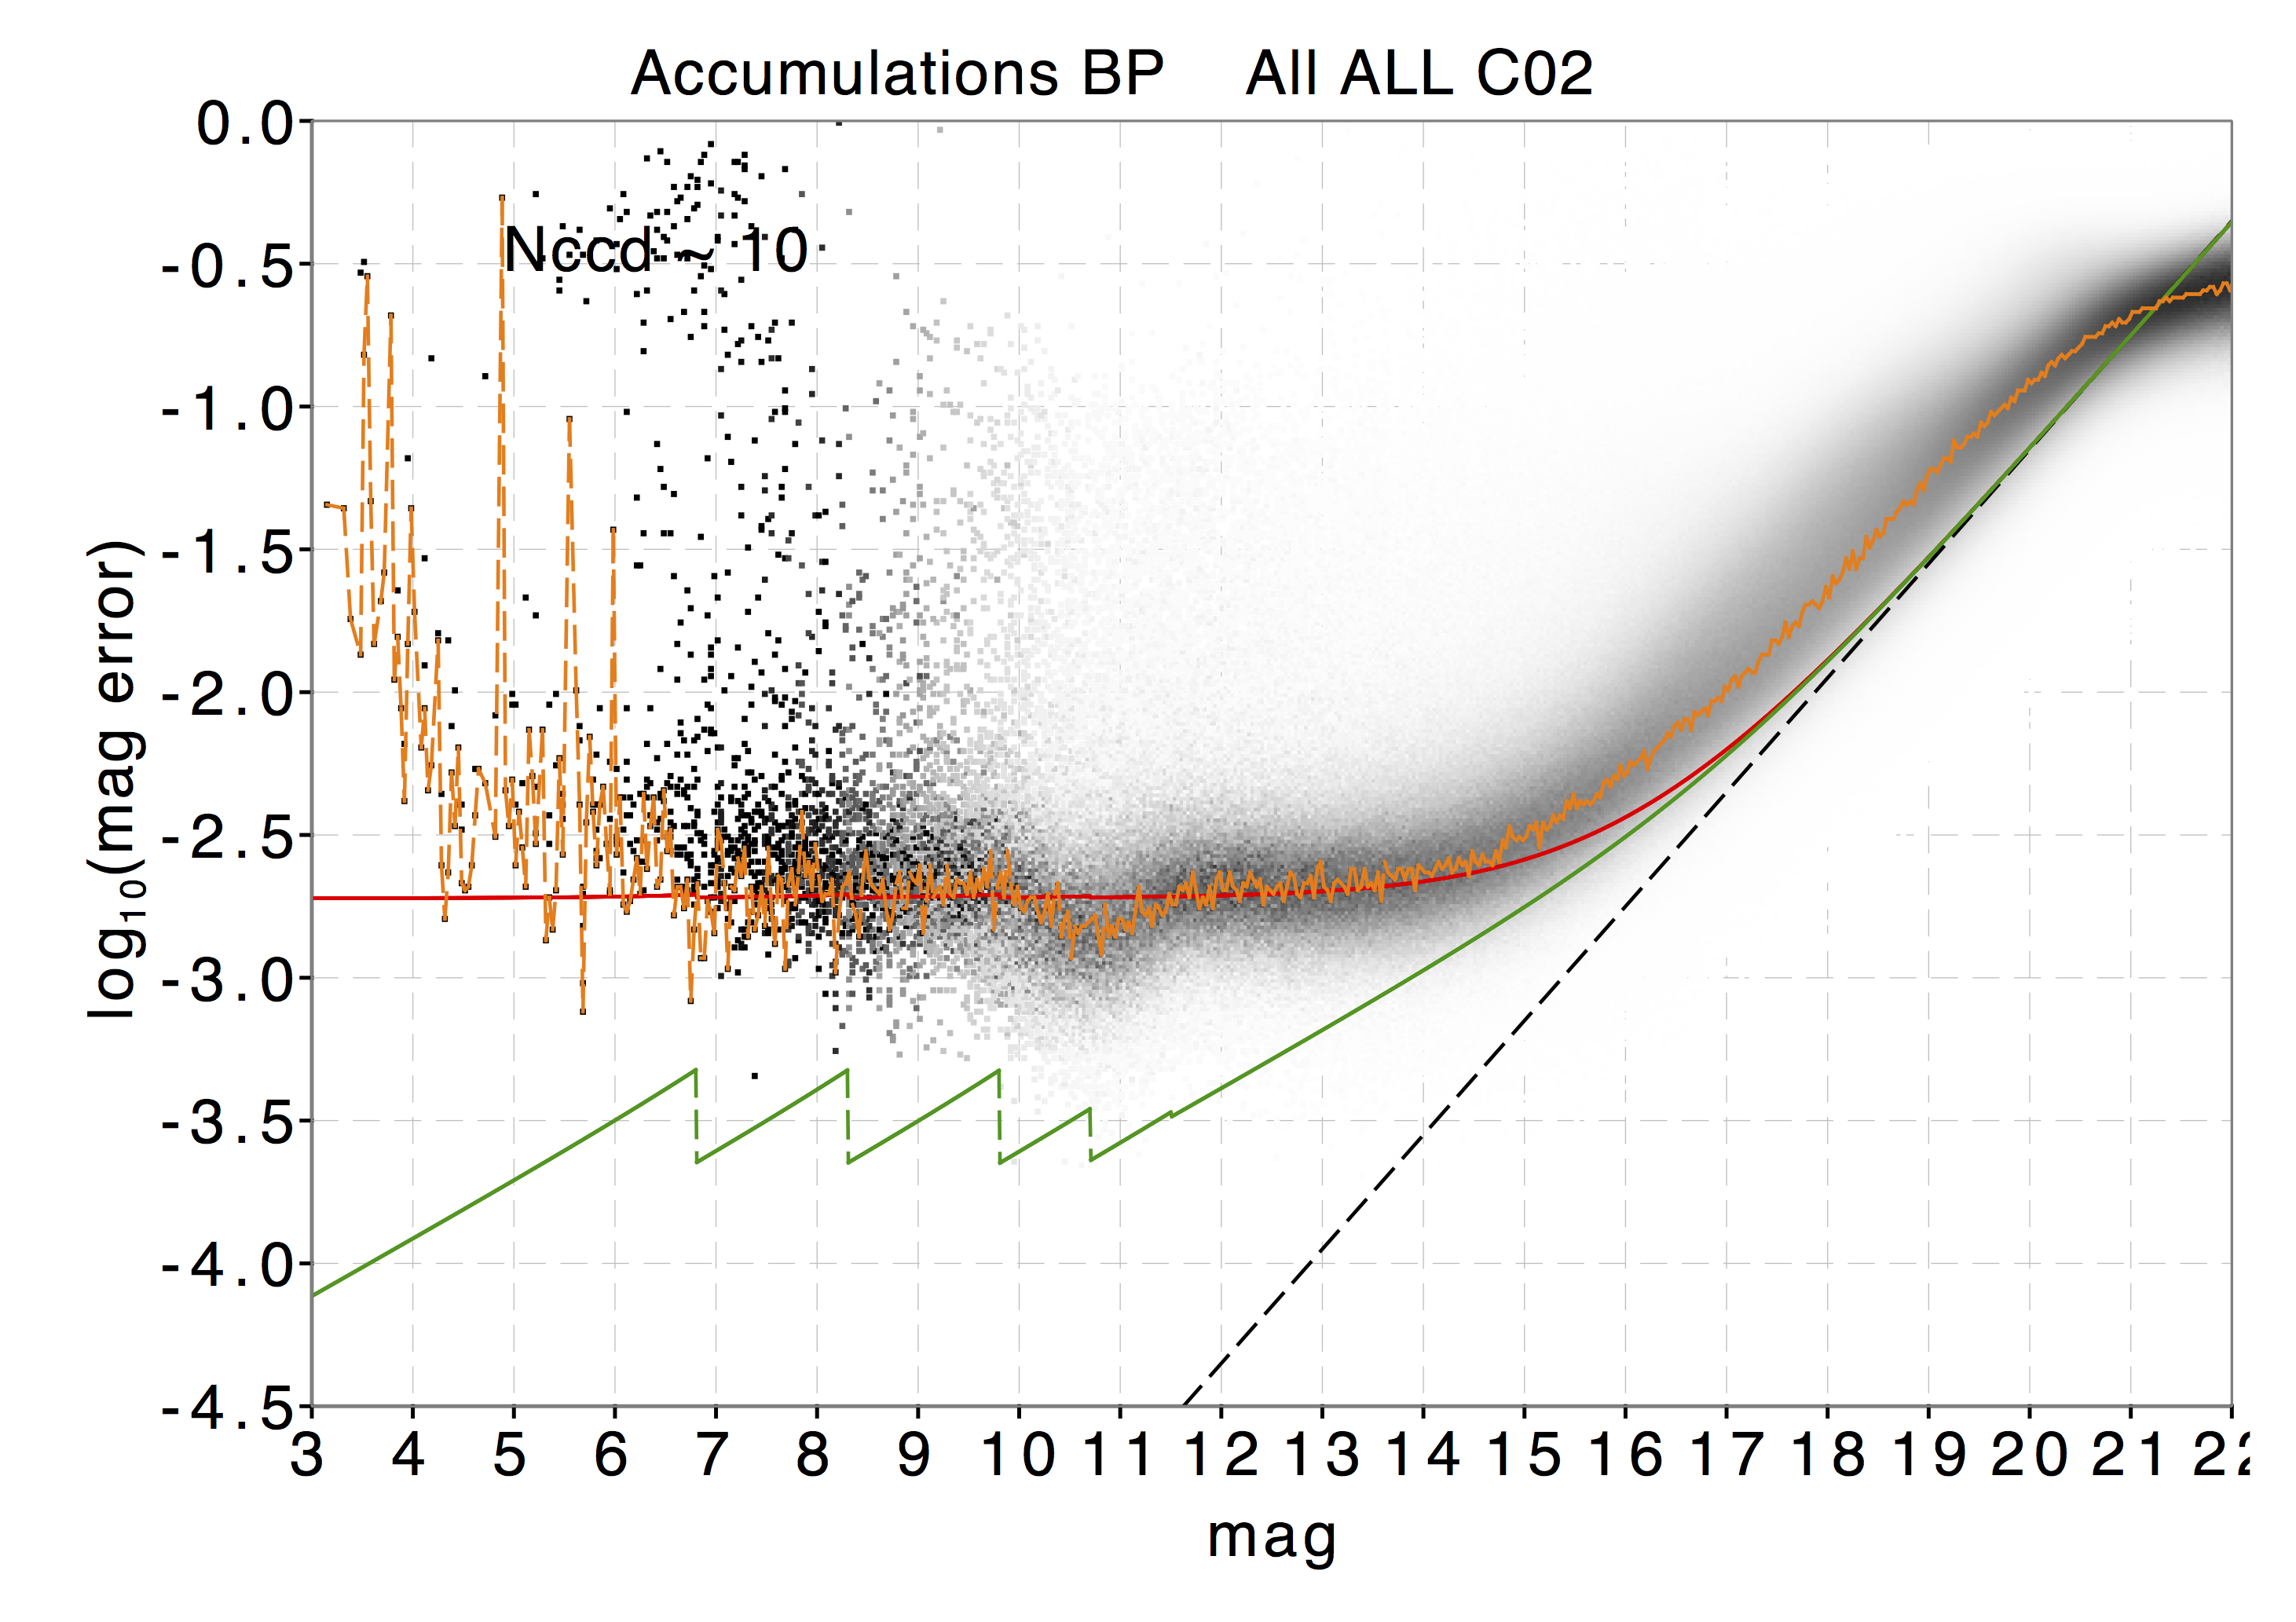
Figure 5.25: Top: Distribution of uncertainty on the weighted mean -value as a function of the same magnitude. The orange line shows the mode of the distribution. The magenta line shows the equivalent results from Gaia DR1.
The green line shows the expected uncertainties for sources with 100 G-band CCD transits and for a nominal mission with perfect calibrations.The red line shows the same uncertainty function, but with a calibration uncertainty of 2 mmag added in quadrature to the individual observations. The dashed black line has a slope of 0.4 and indicates that the faint end is sky dominated.
Center: the same for , with a calibration uncertainty of 5 mmag. Bottom: the same for with a
calibration uncertainty of 3 mmag. As in Gaia DR1 and were not published, no comparison is shown (Evans et al.2018).
The results of the calibration process, in particular the calibration coefficients and quality statistics for the Large Scale and
Small Scale calibrations were analysed and compared with the previous ones from Gaia DR1, showing an overall improvement and consistency
between the median standard deviation values of the Large and Small Scale calibrations for comparable magnitude ranges.
Also the statistical analysis of the source photometry confirms the improvement in comparison to Gaia DR1, caused by better calibrations and Image Parameter Determination results (Section 2.4.8). Top of Fig. 5.25 shows the distribution of uncertainty on the weighted mean G-value as a function of the same G magnitude, with the mode of the distribution in orange, clearly below the same for Gaia DR1 in magenta.
Additional validation against several external catalogues, i.e., Tycho-2 (Høg et al. (2000)), APASS (Henden et al. (2015)) and
SDSS DR12 (Alam et al. (2015)), shows finally that systematic effects are at the 10 mmag level except for the brightest sources ( 3 mag).