11.4.4 Atmospheric Parameters
Author(s): Andreas J. Korn, Alex Lobel, Georges Kordopatis, René Andrae, Elisa Brugaletta, Morgan Fouesneau, Yves Frémat, Alessandro Lanzafame, Caroline Soubiran
The photons Gaia collects originate from the outer layers of the stars, their atmospheres. They convey the physical conditions of these layers and relate to the fundamental stellar parameters that fully define a star, like , , metallicity (and chemical abundances), angular momentum, and magnetic field morphology and strength. Stellar fluxes and spectra contain related observables of physical processes: e.g., the mass accretion veiling and filling in of spectral line cores, fast rotation or magnetic activity broadening atomic lines, mass loss through stellar winds causing emission lines. Throughout its life, as a star evolves, its atmospheric parameters change on timescales of millions to billions of years, some of them more than others.
The task of CU8 is to estimate the astrophysical parameters for hundreds of millions of stars from their (time-averaged) BP/RP spectra (and their parallaxes) and millions of stars from their RVS spectra. The magnitude-limited samples of Gaia are large and diverse data sets when compared to existing spectroscopic surveys based on input catalogs. As a consequence, the atmospheric parameters span a great variety of spectral types, from O to M, and even some L type stars, which require diverse target-specific treatment.
We used both empirical or theoretical atmospheric models to estimate the atmospheric parameters of the stars. The theoretical models try to model the physical processes of the stars, while the empirical ones capture some hard-to-model observational effects. Overlap between libraries allows us to check for consistency or the lack thereof.
Known current limitations are (to name the most important ones):
-
•
no attempt to derive parameters of white dwarfs (classification via DSC only),
-
•
while the parameter space of horizontal-branch stars is covered, no attempt made to model their specific physical conditions (e.g. compositional changes),
-
•
limited ability for GSP-Phot to determine for metal-poor stars below requiring a metallicity calibration (see Figure 11.18),
-
•
surface gravities from GSP-Spec are in general under-estimated (up to , depending on the evolutionary phase) and require a calibration,
-
•
from GSP-Spec need to be calibrated to put the dwarfs and the giants on the same scale,
-
•
the fluxes and spectra of cool stars ( K and cooler) will show significant molecular absorption that are not modelled well (compared to the atomic spectra of warmer stars),
-
•
hot stars ( K) are assumed to have solar metallicity.
Primary atmospheric parameters: , , and
Author(s): Andreas J. Korn, René Andrae, Morgan Fouesneau, Yves Frémat, Georges Kordopatis, Alessandro Lanzafame, Alex Lobel, Caroline Soubiran
| GSP-Phot |
|
|||||||
| GSP-Spec |
|
|||||||
| ESP-HS |
|
|||||||
| ESP-UCD |
|
|||||||
| MSC |
|
|||||||
| GSP-Phot |
|
|||||||
| GSP-Spec |
|
|||||||
| ESP-HS |
|
|||||||
| MSC |
|
|||||||
| [M/H] | GSP-Phot |
|
||||||
| GSP-Spec |
|
|||||||
| GSP-Spec |
|
In the following, we give a global overview of the validation results of , , , and produced by various modules (see Table 11.39).
GSP-Spec parameters for FGK stars have been validated against literature data for , and . Comparisons with APOGEE DR17 (Abdurro’uf et al. 2021), GALAH-DR3 (Buder et al. 2021) and RAVE-DR6 (Steinmetz et al. 2020a) show a median offset for , and of K, (that mostly disappears after calibration) and dex, respectively, when selecting the best quality sample, with all of first thirteen GSP-Spec flags equal to zero. As far as is concerned, a -dependent bias is found, that also needs to be calibrated. This calibration is a polynomial correction that has been derived for stars in the solar neighbourhood. For further details, see the GSP-Spec paper (Recio-Blanco et al., 2022).
Based on a number of sources with literature APs (see Section 11.3.3 for details), GSP-Phot results are characterized by a median absolute error in of 120 K, and a mean absolute error of 180 K. and variations affect the BP/RP spectra only weakly, but by including information about parallax and constraints from isochrones they can be determined reasonably well. The median absolute error of is found to be 0.2 (compared to seismic values of main-sequence star), that of is 0.14. Naturally, the performance is dependent on spectral type, luminosity class and , so the above figures are only indicative. Below , , metallicity sensitivity of the XP spectra diminishes drastically and without a calibration GSP-Phot tends to overestimate for very metal-poor stars.
The typical precision of from GSP-Phot and GSP-Spec has also been assessed by measuring the dispersion among FGK members in stellar clusters. For open clusters (metallicities from -0.20 to +0.20), the median absolute deviation is at the level of 0.3 dex for GSP-Phot. For GSP-Spec it is 0.11 but we note a larger dispersion for dwarfs. For globular clusters (metallicities below -0.50) and GSP-Phot, the median absolute deviation can reach 1 dex for the most metal-poor clusters. GSP-Phot results for dwarfs in globular clusters are affected by crowding in the centre of the cluster. For GSP-Spec, the dispersion is at the level of 0.2 dex.
For hot stars ( 7500 K), the ESP-HS module (Section 11.3.8) is processing, assuming a Solar chemical composition, the BP/RP and, for the brighter targets, the RVS spectra to derive the effective temperature (teff_esphs) and surface gravity (logg_esphs). The information on the mode in which the data was processed is saved in the first digit/character of flags_esphs: 0 (BP/RP +RVS) or 1 (BP/RP-only). Other parameters are also derived such as and interstellar extinction parameters. The decision on whether to process the target or not is based on a spectral type tag (spectraltype_esphs) obtained from a first analysis of the BP/RP made by ESP-ELS. Comparisons of the results with literature compilations/surveys (PASTEL, LAMOST, GES) and young open clusters (Cantat-Gaudin et al. 2018) show generally reasonable agreement in and for 25 000 K, but potentially grossly underestimated values above this value (Fouesneau et al. 2023, see and residuals figure). The uncertainties provided with the parameters were found to be underestimated by a factor of 5 to 10 when obtained in the BP/RP +RVS mode and of the good order of magnitude in the BP/RP-only mode. Note that, based on the value of processing flags and goodness-of-fit estimates, a fraction of the results were filtered out. Known outliers are however still present in the published catalogue. For example, white dwarfs were processed by the module, while no suitable library was used to characterize these. Also, some classes of stars cooler than 7 500 K (e.g. RR Lyrae stars), misclassified as O,B, or A-type stars, have been treated in the same way with non adapted spectra libraries and therefore received incorrect APs. From a detailed comparison with the APs from LAMOST OBA (DR6) ESP-HS is found to recover 62% of the Galactic A- & B-stars. Conversely, of the 612 Galactic O-type stars published in GOSC (Galactic O-type Stars Catalogue) only 186 O-star APs are recovered. This is a direct consequence of persisting difficulties for deriving reliable hot star APs from Gaia BP/RP spectra. The spectral type tag provided by ESP-ELS, however, will allow users to retrieve a more complete list of candidate OBA-stars brighter than =17.65. Complementary information on the quality assessment of the results of ESP-HS are available in Section 11.3.8 and in Gaia Collaboration et al. (2023c); Fouesneau et al. (2023).
The above numbers can serve as guidelines for the global precision of DR3 results relative to literature results. Accuracy can be measured in some cases, in particular relative to Gaia benchmark stars, e.g. (Heiter et al. 2015) and spectroscopically confirmed solar analogues, e.g. (Tucci Maia et al. 2016). The overall picture is dominated by solar analogues (more numerous and less bright than the Gaia benchmark stars) and shows that values are underestimated by between 30 (PHOENIX) and 90 K (MARCS) in GSP-Phot (with a of 100 K in both cases). GSP-Spec returns a somewhat larger (130 K), but essentially no bias (+10 K). Due to the inclusion of parallax and isochrone information, the values from GSP-Phot show excellent agreement: nominal offsets are smaller than 0.1 dex. GSP-Spec performs similar well. values are in good agreement for GSP-Spec (mean offset less than 0.1 dex), but larger offsets are found for GSP-Phot when using PHOENIX models: . For MARCS, results are better: (but note the poorer performance on mentioned above).
For some of the (bright) Gaia benchmark stars, interferometric angular diameters exist and can be compared with the combined radius and distance estimates. Results are excellent, but outliers do exist. See Section 11.3.3 for details.
In an ideal world, the results from GSP-Phot and GSP-Spec would agree perfectly. However, in practice they will not do so fully (see above) because they rely on different inputs (broad fluxes vs narrow spectra, plus additional constraints like parallax and isochrone information in the case of GSP-Phot) and probe different aspects of the light emitted from stars (spectral energy distributions vs. spectral lines in normalized spectra). Furthermore, extinction significantly affects AP determination in GSP-Phot, while GSP-Spec’s parameterisation is unaffected by it. In case of discrepancies, it is up to the user to decide which set of parameters is more trustworthy for the stars of their particular science case.
Secondary atmospheric parameters: stellar classes, rotation, emission, activity
Author(s): Alex Lobel, Elisa Brugaletta, Yves Frémat, Alessandro Lanzafame
We provide a brief discussion of the validation results for binary and white dwarf classification with DSC, the spectral classifications with ESP-HS and ESP-ELS, the rotation velocity calculations of ESP-HS, and the activity parameters from ESP-CS and ESP-ELS (see Table 3.42).
The Discrete Source Classifier (DSC) classifies sources probabilistically into five classes: quasar, galaxy, anonymous (essentially -star-), white dwarf (WD), and physical (unresolved) binary. DSC is, however, primarily an extragalactic source classifier. The classification performance on WDs and physical binaries is not as good, nor as easy to quantify, because (a) the class priors are very uncertain, and (b) the binary training sample that defines the binary class was created by combining Gaia data of single sources. As the DSC validation data was composed of sources taken directly from Gaia, it means that the binary validation set is very different from the training set, and it is therefore not surprising that DSC performance on binaries is poor. In general the DSC results for binaries should be used with great caution.
DSC classification is done by requiring the probability to be above 0.5 for the three non-extragalactic source classes; anonymous, white dwarfs, and binaries. In terms of DSC performance the completeness and purity for white dwarfs are 43% and 25% respectively, although the prior adopted is very uncertain. DSC probability results for the physical binaries appear to be useless, although this is hard to assess given the way the binary class is defined, and the fact that the validation set is not representative of the training data. Probably this can be improved for both classes if the DSC Allosmod classifier were extended to include them (for DR4?). Furthermore, it is very difficult to get a reliable and sizeable sample of unresolved binaries for training.
In the Apsis flowchart, the ESP-ELS (See description in Section 11.3.7) precedes the ESP-HS module (Figure 11.1). Following an initial spectral type tagging procedure, the W-R (also having WC and WN subtypes) and PNe stars are identified using selected emission lines/features typically expected across a variety of wavelength regions. Next, Be, Herbig Ae/Be, T Tauri, active M dwarf stars are individually classified using the same features, but also using the APs of GSP-Phot to infer the ESP-ELS class label. The latter classification takes place only once significant H emission was found.
The spectral type tag (spectraltype_esphs) can be one of the following string: O, B, A, F, G, K, M, CSTAR. It is derived from the training of a random forest classifier on synthetic spectra, but also on observations (i.e. carbon stars: CSTAR). The “CSTAR” tag is used to remove any carbon star candidate from the ELS classification, while the other tags are used by the ESP-HS module to preselect O, B, and A-type targets. Based on the probability assigned to each class during the classification, a quality flag was assigned and saved as the second digit/character of the flags_esphs field. It can take values ranging from 0 to 5, the lowest value being the classification with the highest rating. The “0” value was only provided to candidate carbon stars that, after validation, appeared to show the most significant C and CN molecular bands (Gaia Collaboration et al. 2023c). Among the initial 386 937 candidate carbon stars, only 15 740 were finally flagged “0”. While vs. degeneracy issues have been found to degrade the spectral type tagging results (e.g. RR Lyrae targets classified as A-type or earlier and therefore processed in ESP-HS with non-adapted models), it remained quite successful in detecting the hotter targets.
Part of the decision on the presence of emission in BP/RP is based on the estimate of the H line strength obtained from the measurement of a pseudo-equivalent width (pEW) computed as the integrated normalized flux over a wavelength domain centred on the expected position of the feature. Because for cooler stars this domain may be contaminated by species other than hydrogen and the local continuum deformed by the head of molecular bands, when the effective temperature value provided by GSP-Phot was 5 000 K, the value derived on synthetic spectra (i.e. with no emission) was subtracted from the observed one (see Equation 11.28). The final value of the pEW is saved in ew_espels_halpha and ew_espels_halpha_uncertainty, while flag ew_espels_halpha_flag takes the value 1 or 0, respectively if such a correction was applied or not. The value of the pEW measured on the synthetic spectra for the AP values provided by GSP-Phot (best library estimate) during the processing is saved in ew_espels_halpha_model (even when it was not applied). An example of the distribution of H pEW with is shown in Figure 11.40. On the one hand, we noted that, as expected, the pEW provided by ESP-ELS is underestimated by a factor 3 when compared to published estimates (see corresponding figure in Fouesneau et al. 2023, which shows a comparison with estimates from the literature). On the other hand, probably due to mismatches between theory and observations, the correction applied to account for the presence of molecular bands failed to correctly provide a H pEW consistent with the values usually reported for M-type stars. This, as well as issues linked to the astrophysical parameters used to select the synthetic spectra, led to the incorrect identification and classification of active M dwarf stars, as well as of T Tauri stars.
Once a BP/RP spectrum is detected with emission and successfully classified, ESP-ELS saves the label of the ELS class having received the highest probability value in classlabel_espels. A rating of the classification is provided in classlabel_espels_flag and is based on the distribution of the class probabilities. Initially, the flag takes values ranging from 0 to 4, the lower is usually expected to be the better. However, the classification relies also on the astrophysical parameters provided during the processing by GSP-Phot (best library estimates). It was reported during the validation that a fraction of the derived APs belonging to cooler stars were significantly inaccurate (e.g. M or K stars received a above 5 000 K) or suspected to be. This might be linked to parameter degeneracy, to mismatches with the synthetic spectra, or/and to the peculiar nature of the ELS. After post-processing, some of these AP values have been filtered out or replaced. Among the APs that survived the post-processing of GSP-Phot, some temperature values further remained not consistent with the spectral type tag provided by the module. This may suggest issues with the spectral type tagging, with the APs, or/and with the BP/RP data used to make the classification. Because the astrophysical parameters play, with the BP/RP data, a key role in the detection and identification of ELS, we have updated the classlabel_espels_flag in order to better identify these situations and added 10 or 20 to it as follows:
-
classlabel_espels_flag+10: APs and spectral type tag are not consistent.
-
classlabel_espels_flag+20: APs removed during the post-processing
A more detailed review of the results obtained for the various classes of ELS can found in Section 11.3.7.
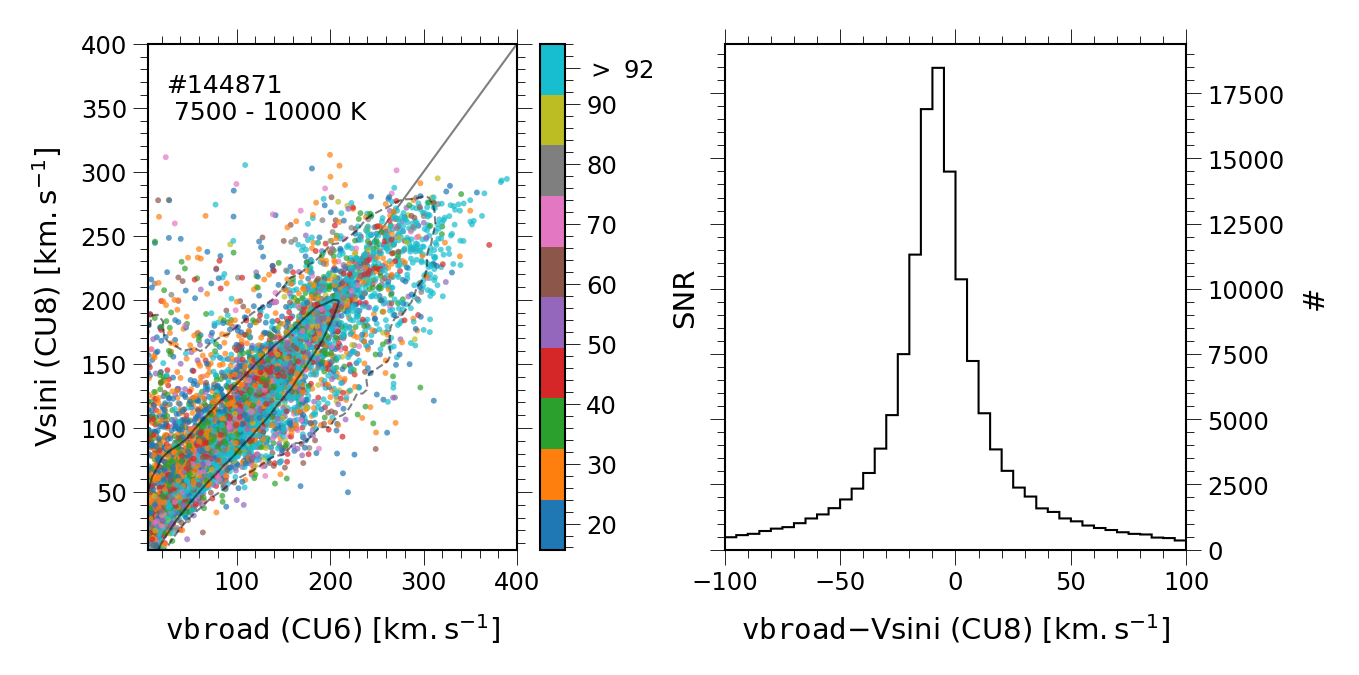
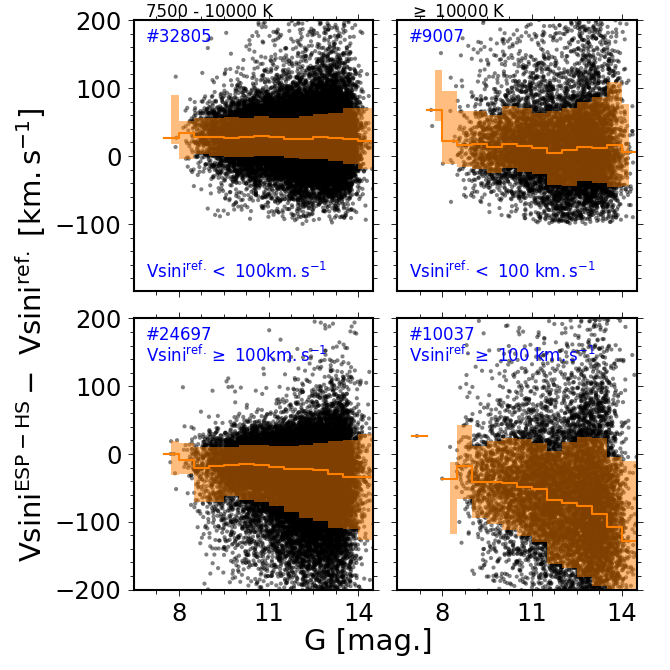
For the brighter targets, the ESP-HS (See description in Section 11.3.8) module processes the BP/RP and the RVS data simultaneously by fitting synthetic spectra to the observations. In addition to the primary APs, it therefore also derives an estimate of the stellar projected rotational velocity, (vsini_esphs, vsini_esphs_uncertainty). Note that another estimate of is provided by CU6 and is named vbroad (Frémat et al. 2023). However, the data used in this case are epoch observations. The RVS data processed by Apsis result from the co-addition of multiple epoch spectra after correction of the target’s radial velocity (Section 11.2.4). It is known that the accuracy of the RV degrades rapidly with increasing (Blomme et al. 2023). In addition, each transit spectrum is broaden by its own ALong-scan LSF, while ESP-HS has to assume a Gaussian LSF with a fixed resolving power. It is therefore expected that the line broadening of the spectrum received by Apsis is affected by the co-addition, and that the measured in CU8 might be different from the value derived on epoch data. As shown in Figure 11.82, both values tend to be consistent with each other. There is however a trend for the ESP-HS’s to be systematically larger at lower vbroad values. On the other hand it tends to be underestimated at higher apparent rotational velocities. Even though we kept in CU8 the name “” (i.e. in CU6 the parameters is named vbroad), it is obvious that mechanisms other than stellar rotation are contributing to the effective line broadening (instrumental, but also astrophysical such as macroturbulence). Further, while a knowledge of the line-broadening is mandatory to analyse the RVS spectrum of hot stars, the wavelength domain (i.e. broad calcium and hydrogen line profiles) it covers is not well suited to derive it. In Figure 11.83 we present a comparison between the measurements done by ESP-HS to those obtained in the framework of the LAMOST survey for OBA stars. As expected, the accuracy depends on magnitude (i.e. SNR), and on the effective temperature: It is worse for the hotter stars with the largest apparent rotational velocities.
The activity index derived by ESP-CS from the analysis of the calcium infrared triplet in the RVS spectrum is validated by comparing with results obtained by applying the same analysis to FEROS spectra of a common set of sources, visual inspection of spectra producing extreme values of the activity index, and checking for consistency with respect to the source position in the HRD.
The comparison with results obtained on FEROS spectra of a common set of stars shows a small bias in the activity index, of the order of 0.01 nm, very close in value to the dispersion (standard deviation), which is also of about 0.01 nm. The bias is mainly due to systematic differences in the APs adopted for deriving the activity index in the two cases, which are taken from Worley et al. (2012) for the FEROS spectra.
The activity index is found generally consistent with the position of stars in the HRD. As expected, the activity index is generally close to zero in the sub-giant region of the HRD, and larger close or on the main sequence. Values above 0.05 nm, associated with strong chromospheric activity or mass accretion in young stars, are preferentially associated with stars located slightly above or on the upper part of the main-sequence, where the younger stars are expected to be.
Objects classified as YSO, T Tauri, and Orion type variable in the SIMBAD database have activity index larger than 0.1 nm. For the same objects, ESP-ELS derives an H pEW larger than 0.01 nm. There is therefore consistency of the results obtained byESP-ELS and ESP-CS on known young stars.
Chemical Abundances
Author(s): Georges Kordopatis, Caroline Soubiran
In Gaia DR3, we provide, based solely on the GSP-Spec analysis of the RVS spectra, 13 chemical abundance ratios from 12 individual elements (both abundances for FeI and FeII are provided) as well as equivalent-width estimations of a well identified CN line (see Table 11.41). We note that, because of the way the synthetic grids are computed in order to derive abundances, what is actually published for iron is [FeI/M] (fem_gspspec) and [FeII/M] (feiim_gspspec). In order to obtain the commonly used abundances [FeI/H] and [FeII/H], one therefore has to add the star’s [M/H].
The validation of individual abundances is a challenge as no fundamental standards exist for stars other than the Sun. Furthermore, the comparison with literature data usually suffers from different zero-points and underlying assumptions (e.g. assumed Solar composition), so one needs to pay particular attention when performing such comparisons.
We expect the derived abundances to have the usual limitations discussed in the literature stemming from model assumptions (e.g., 1D or 3D model atmospheres, mixing-length convection, local thermodynamic equilibrium, the atomic line list, and the blending of lines stemming from the RVS’s resolving power). All these effects can lead to systematic offsets in the abundance determinations, that may depend on the atmospheric parameters.
That said, an estimation of the abundance offsets, and a calibration of the latter, can be determined using the GSP-Spec outputs alone. To do so, we selected stars in the immediate solar neighbourhood, with metallicities close to solar and having velocities close to the local standard of rest. Such a stellar sample is expected to have, on average, all of its [/] abundances (for two elements and ) centred on zero (i.e. Solar-like abundance ratios), independently of the atmospheric parameters. In the GSP-Spec paper (Recio-Blanco et al. 2023), we find that this is not always the case, and provide calibration relations for 10 of the chemical abundances, which we also qualitatively validate on literature data (verifying that the offsets and dispersions are globally reduced). Indicatively, comparing the GSP-Spec abundances, with the ones of APOGEE-DR17 and GALAH-DR3, we found, before the calibration median abundance offsets of for [Mg/Fe] and [FeI/H], that drop to dex and dex, respectively, after applying these calibration relations.
| chemical abundances | GSP-Spec |
|