7.7.5 Quality assessment and validation
Verification
The good execution of the processing steps shown in Figure 7.5 is tested in this section through a series of graphical representations of the results. The discussion of the results is presented in more details in Mowlavi et al. (2018). All results presented here concern only the subset of LPV candidates in Gaia DR2 that have LPV-specific results, excluding the candidates published as part of the classification results that would not have specific LPV results.
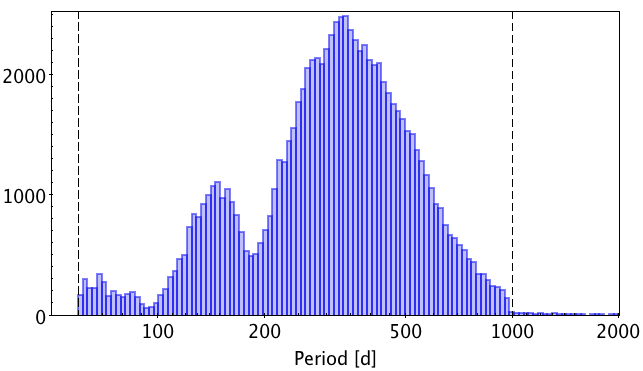
The period distribution is shown in Figure 7.6. All LPV candidates with LPV-specific results have periods larger than 60 d, in agreement with the filter criterion imposed for Gaia DR2. Among them, 164 (0.1%) have periods above 1000 d, the upper limit set in the Least Square period search algorithm. This is due to the application of a non-linear period refinement algorithm on the most significant period found by the Least Square algorithm. At this stage, all these periods above 1000 d have to be taken with caution, and be confirmed with subsequent Gaia data releases which will cover larger observation durations.
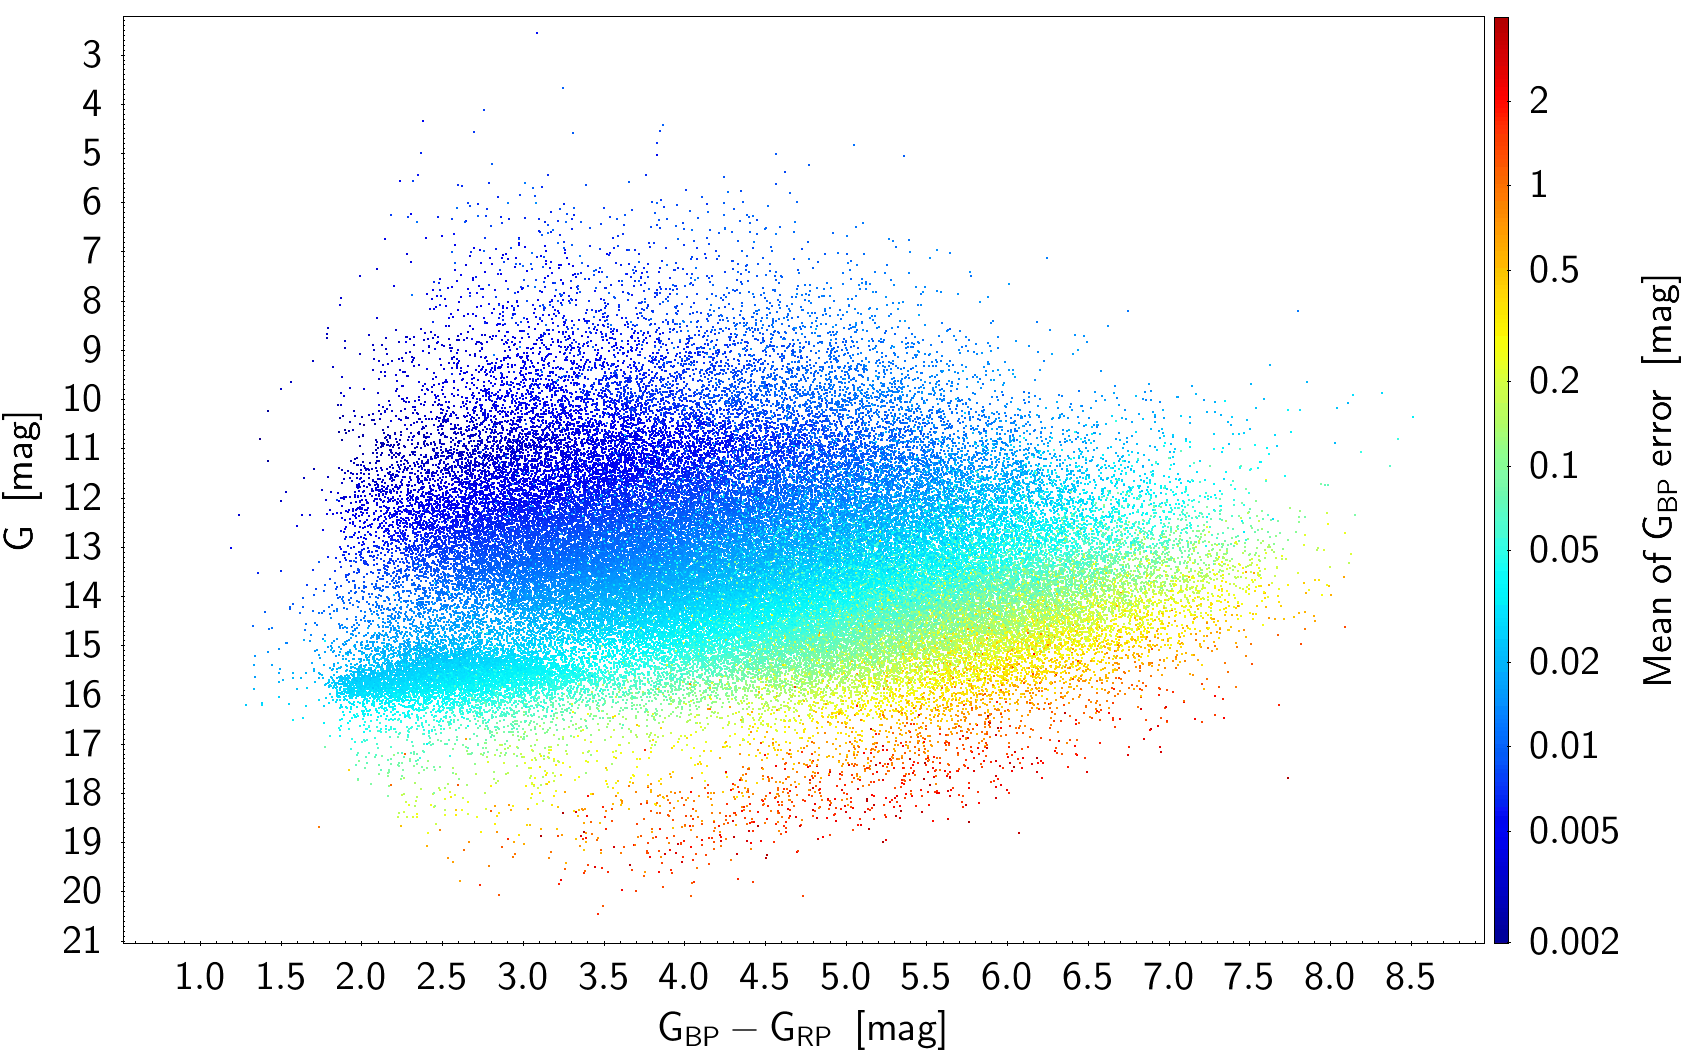
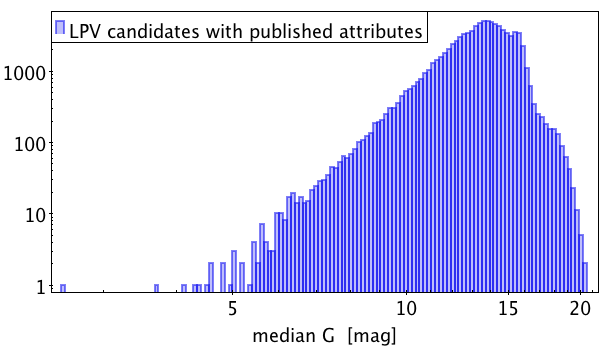
The colour-magnitude diagram of the LPV candidates published in the vari_long_period_variable table is shown in Figure 7.7. Three groups of stars are visible. The main group with the largest concentration of stars extends from mag to 7.5 mag. The extension of the colours to such large values results from reddening. The second group, at mag and with colours extending from mag to 3.5 mag, represents LPV candidates from the Large and Small Magellanic Clouds. The presence of the Clouds is further noticeable in the histogram of magnitudes shown in Figure 7.8. Finally, a third group of stars is visible in Figure 7.7 below the main stream, with magnitudes above 17 mag. These stars have large uncertainties, as witnessed by the uncertainties colour-coded in the figure, leading to very uncertain values that explain the presence of this group of stars below the main stream.
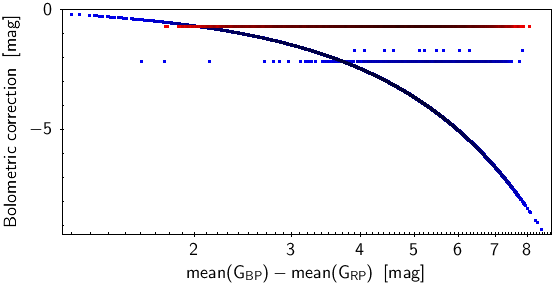
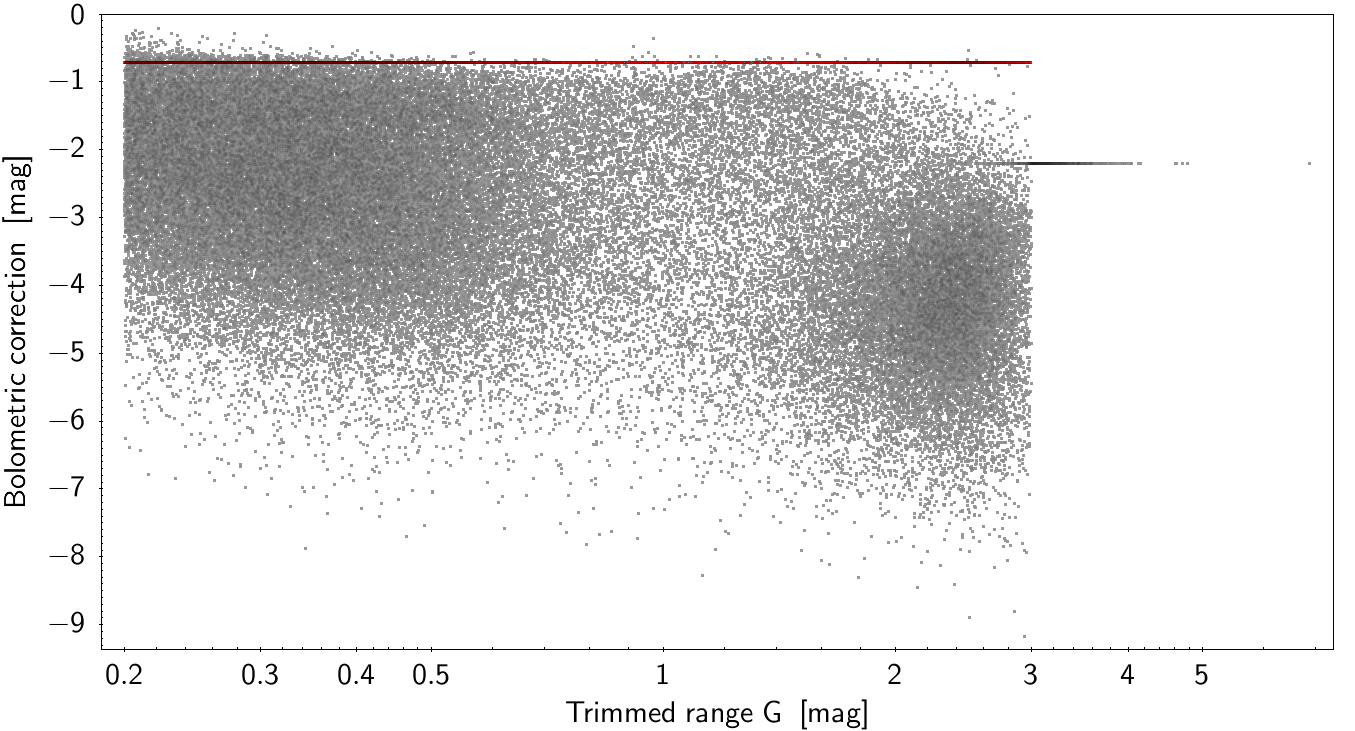
The bolometric corrections are shown in Figure 7.9 as a function of colour. We remind here that the colours used in the LPV processing pipeline of Gaia DR2 are computed from the mean values of and , and that they are not corrected for extinction. The relation given by (7.13) is clearly visible in the figure, as well as the constant values of the bolometric corrections adopted in the specific cases of red supergiants, of LPVs with large amplitudes, and of sources with large uncertainties on either and/or (see Section 7.7.3). The bolometric correction versus the 5%-95% trimmed range of the -band time series is shown in Figure 7.10. It illustrates the adoption of a value of -2.2 mag for all LPVs having a variability amplitude measured by this trimmed range larger than 3 mag. It must be noted that the trimmed range used in the figure uses the R strategy of commons-math to compute the percentiles, while the computation in the LPV code was adopting the LEGACY strategy. This explains why some LPV candidates in Figure 7.10 also have their bolometric correction set to 2.2 mag while having a 5%-95% trimmed range of smaller than 3 mag.
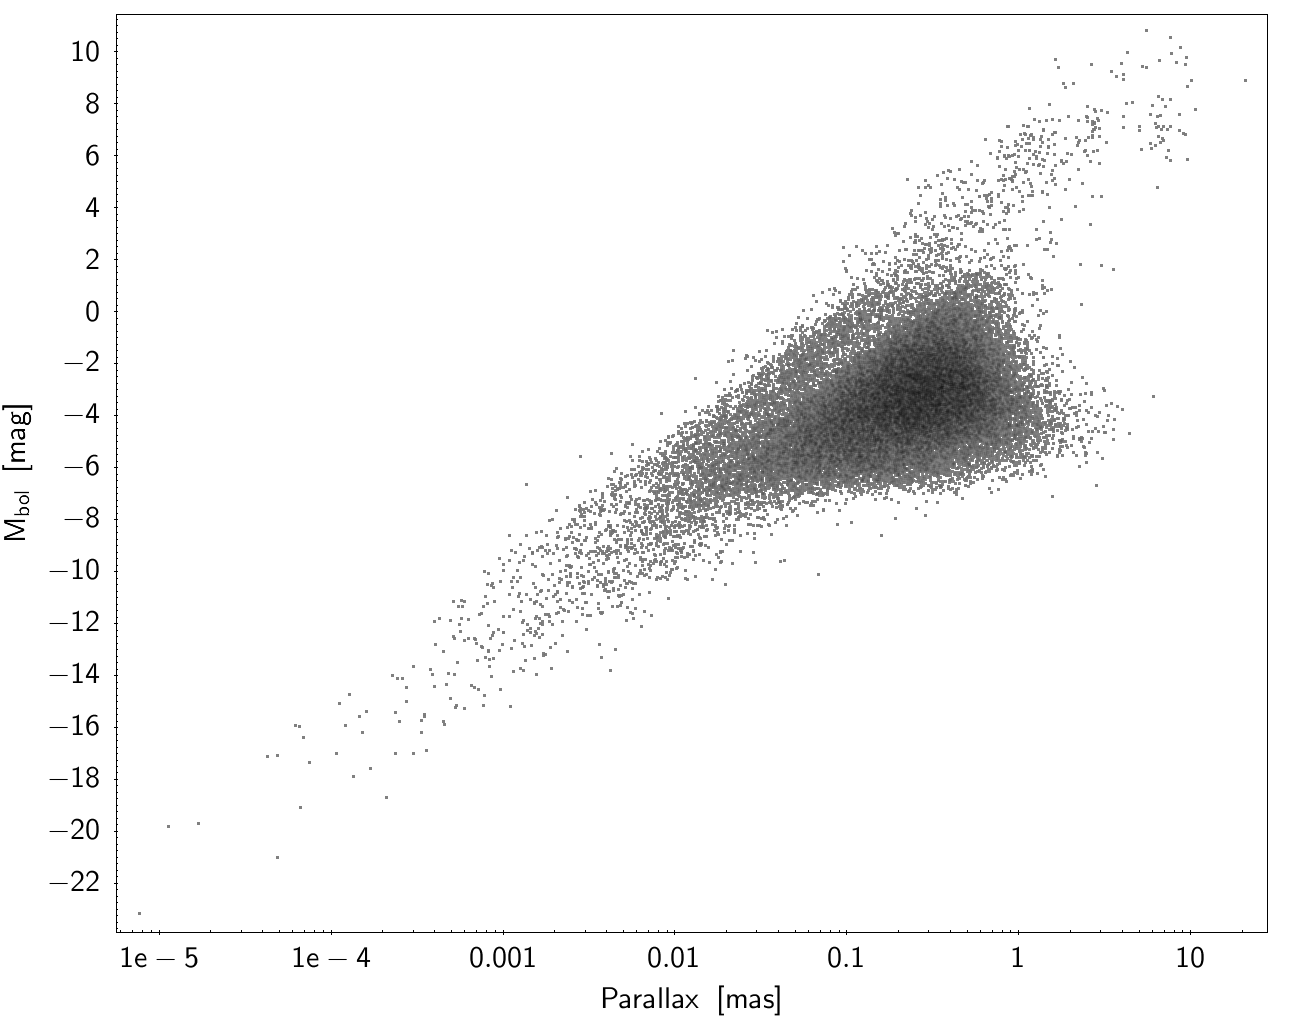
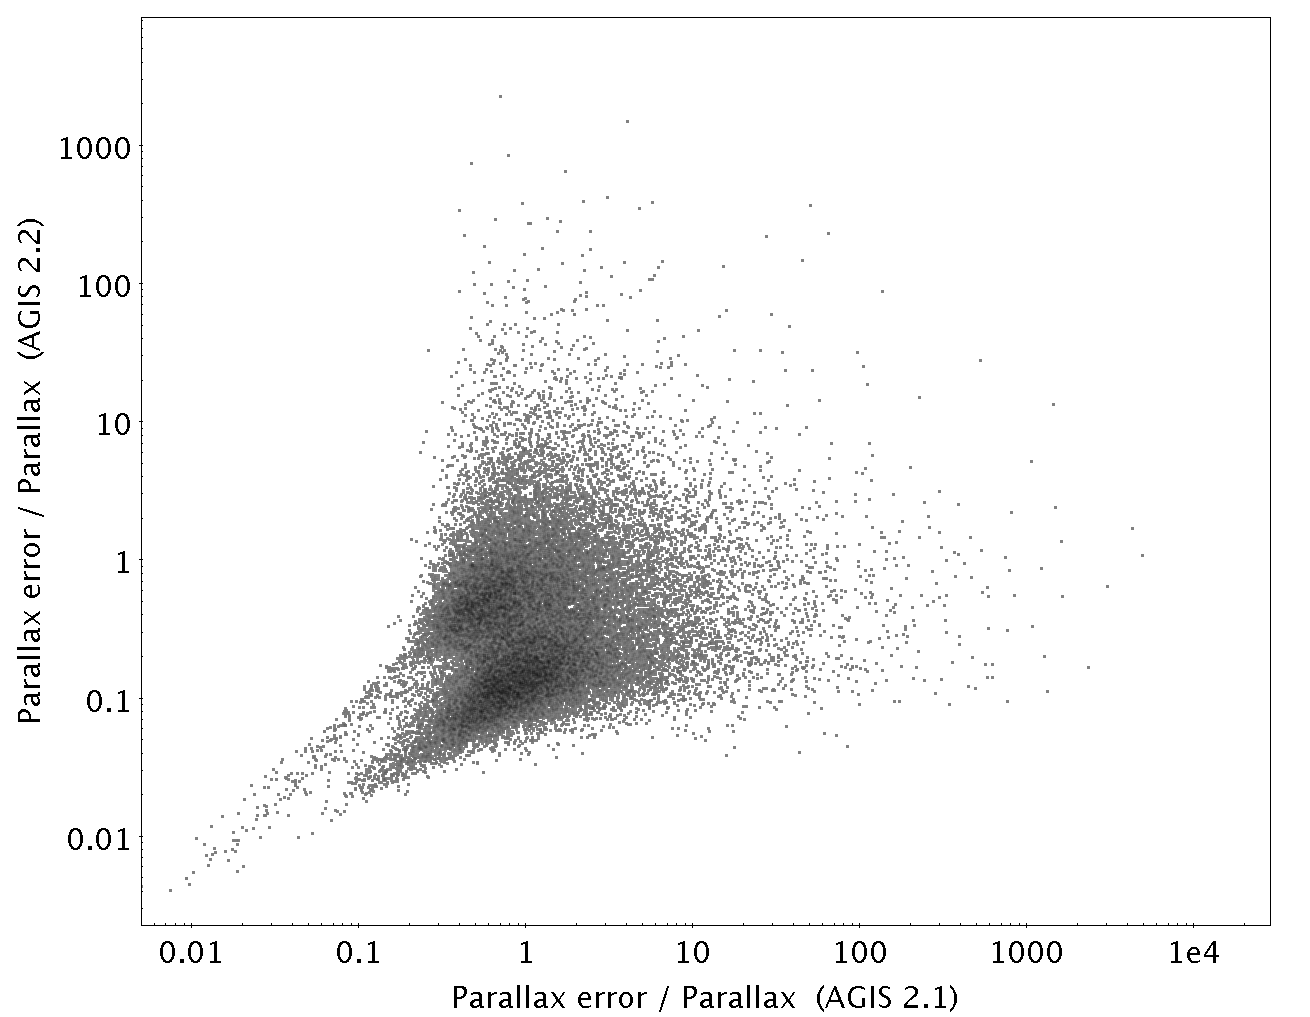
The bolometric magnitudes published in Gaia DR2 are shown in Figure 7.11. It must be stressed that the parallaxes used in the figure are those used for the computation of the bolometric magnitudes of LPV candidates published in Gaia DR2, which are not the final parallaxes published in Gaia DR2, which were not available at the time of the variability processing of LPV candidates. The improvements brought to the parallax computations are illustrated in Figure 7.12.
Validation
The periods derived in Gaia DR2 are validated against the periods published in OGLE-III for the LMC, SMC and the region towards the Galactic bulge, for the Gaia DR2 LPV candidates that crossmatch OGLE-III LPVs. Likewise, the degree of completeness and percentage of new candidates relative to OGLE-III can be estimated by comparing the fraction of OGLE-III LPVs that are cross-matched with Gaia LPV candidates and the fraction of Gaia LPV candidates that are absent from OGLE-III catalogues, respectively. About 30% of OGLE-III LPVs in the LMC and SMC are present in Gaia DR2, while less than a few percent of the Gaia DR2 LPV candidates towards the Clouds are not present in OGLE-III. The results of these comparisons are presented in Mowlavi et al. (2018).