5.5.2 Saturation correction
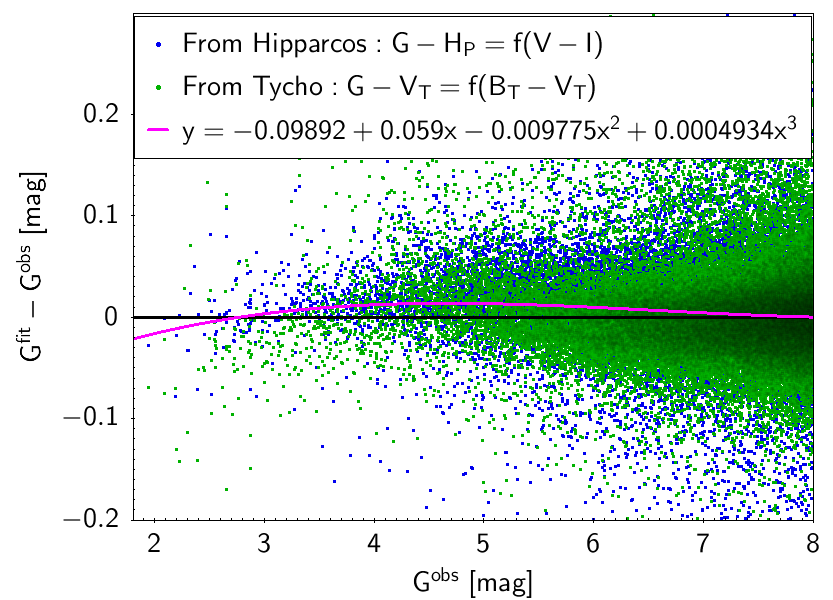
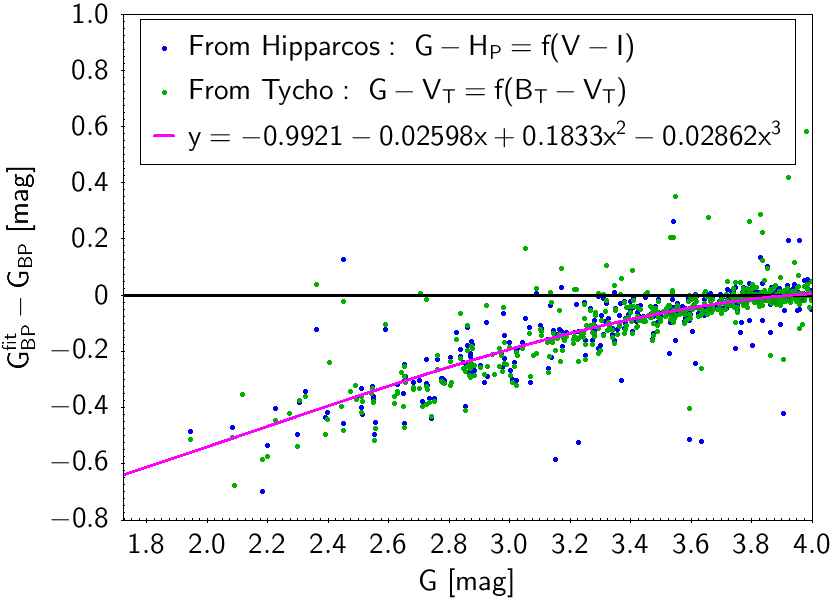
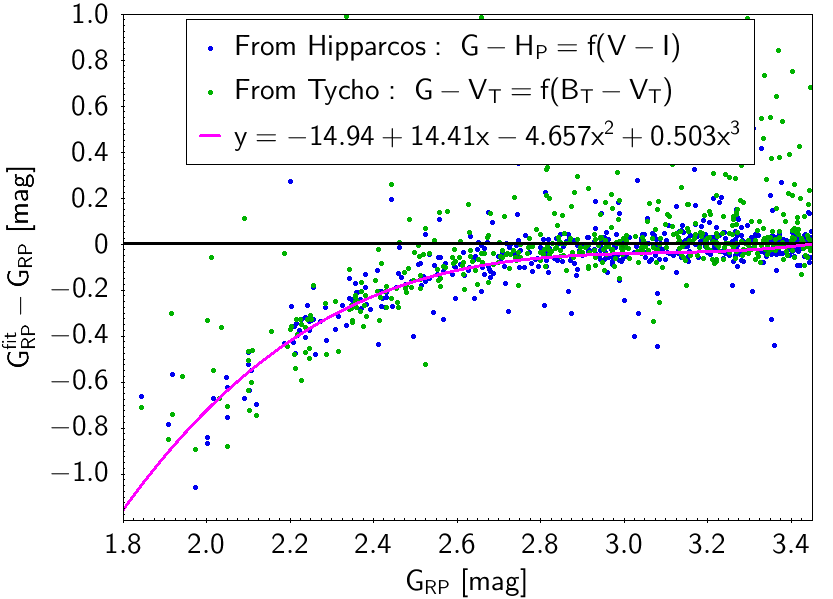
The saturation in the case of bright stars is shown in Figure 5.30. The impact of the saturation on the results of the fluxes and magnitudes has decreased with respect to Gaia EDR2 because of changes in several steps of the calibrations. The figure shows the residuals when fitting as a function of , or as a function of and plotting them against the magnitude. Tycho-2 and Hipparcos data were combined to derive empirical corrections. The corrected magnitudes from the mean magnitudes in Gaia EDR3, can be obtained with the following equations:
| (5.29) | |||||
| (5.30) | |||||
| (5.31) |
The relationship should only be used in the range mag, the relationship only for mag, and the relationship only for mag.


