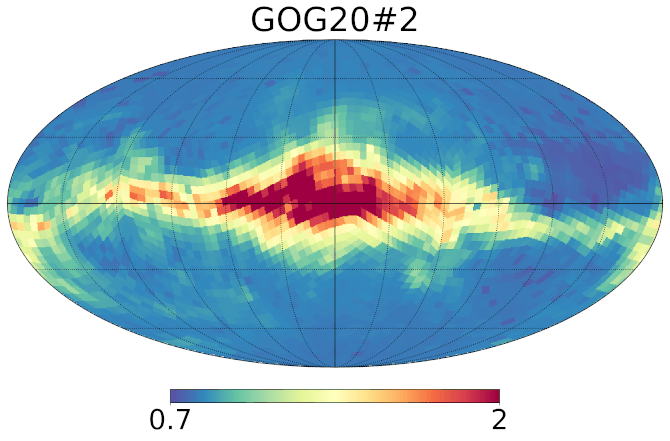
8.3.5 Colour distributions
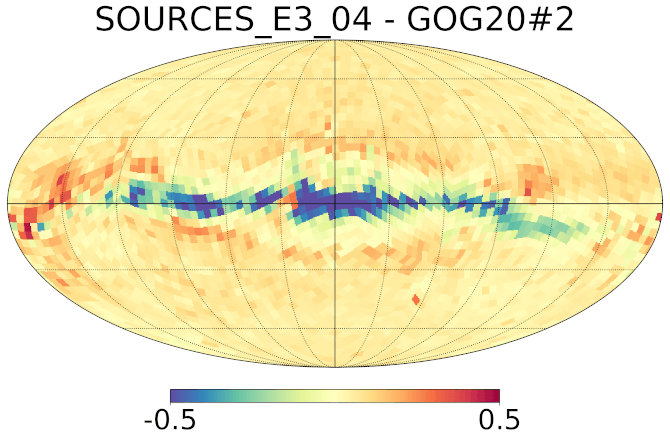
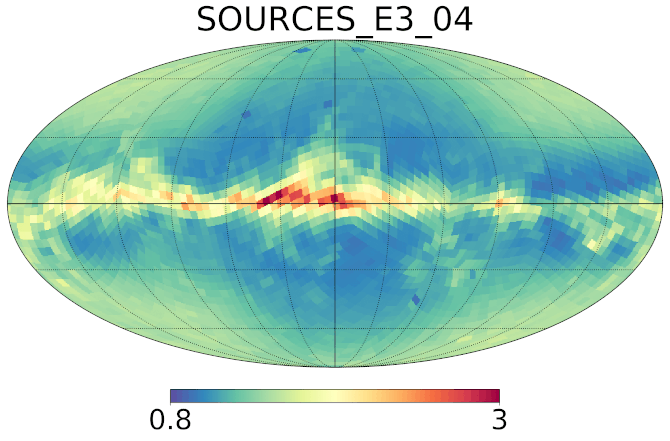
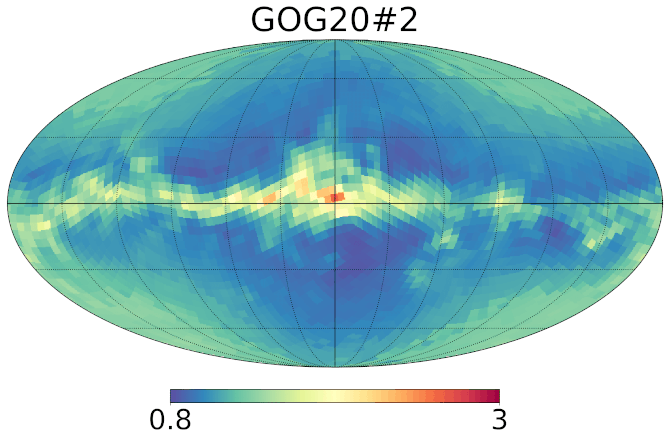
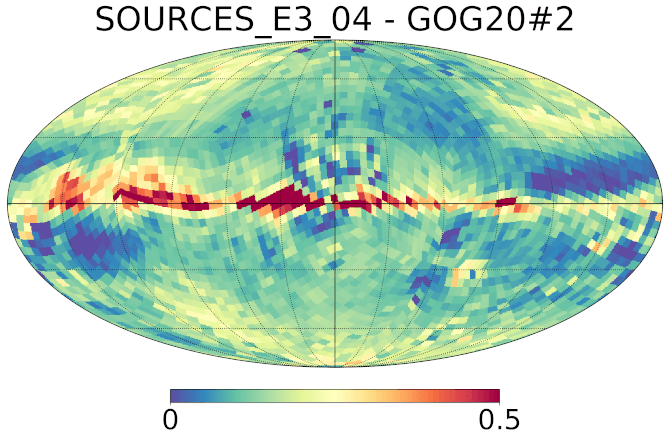
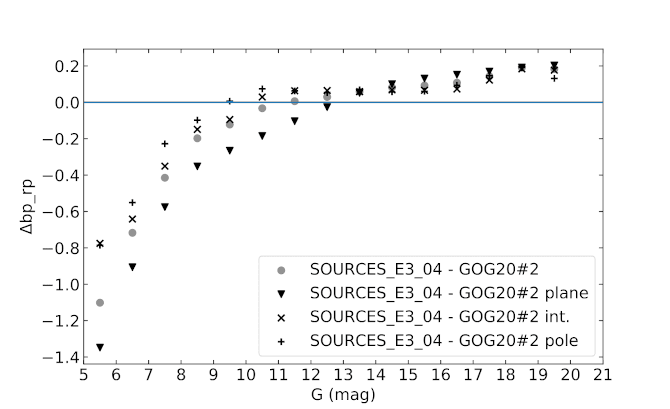
The median of the colour is computed in each healpix bin and presented in Figure 8.18 in three range of magnitudes. We also consider the average colour per magnitude bin, for Gaia EDR3 and GOG20 in Figure 8.19 for three ranges of latitudes. At intermediate and faint magnitudes, the differences can be large in the Galactic plane and are clearly linked to the extinction. At higher latitudes, the model is in agreement with the data at the level of 0.1 mag.
However at bright magnitudes (9 at intermediate latitudes and towards the pole, 12 in the plane), the data deviates from the values predicted by the model, showing a problem in the colour determination for those bright stars, although this discrepancy is slightly reduced compared to Gaia DR2.
Summary of the results:
-
•
At high latitudes, model and data are in agreement at the level of 0.1 mag.
-
•
The differences between data and model can be large in the Galactic plane and are clearly linked to the extinction.
-
•
The colour determination of relatively stars () seems problematic, although this discrepancy is reduced compared to Gaia DR2.