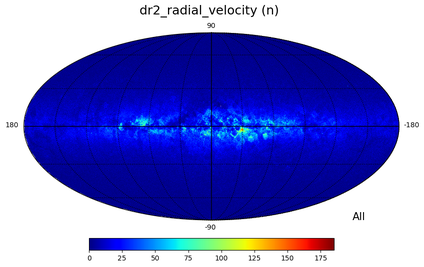
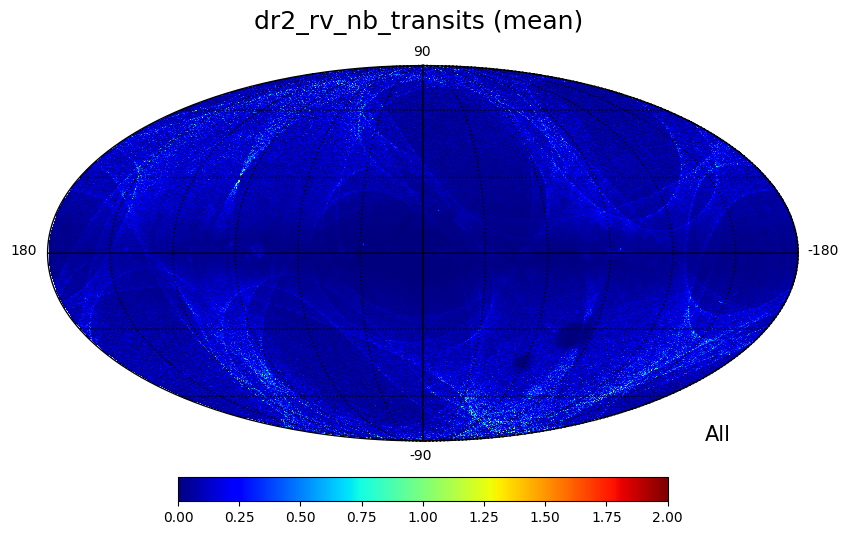
Figure 11.36: Top:
HEALPix map of transits per source (dr2_rv_nb_transits) (large image),
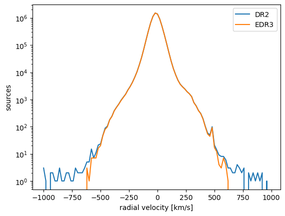
number of sources with (large image). Bottom:
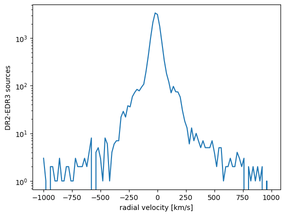
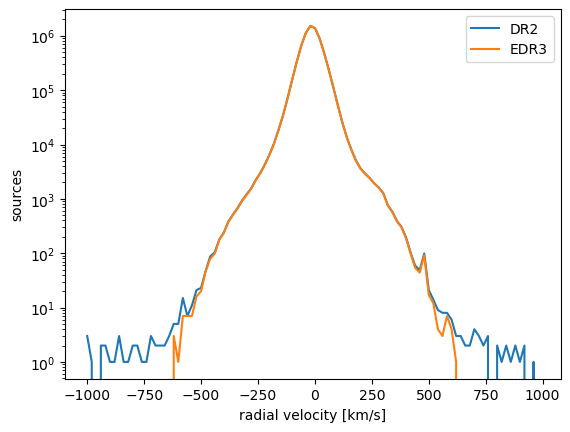
histograms of radial velocities for DR2 and EDR3 (large image)
and DR2 - EDR3 (large image) in bins of 20 km s.
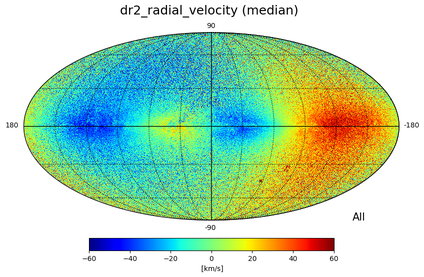
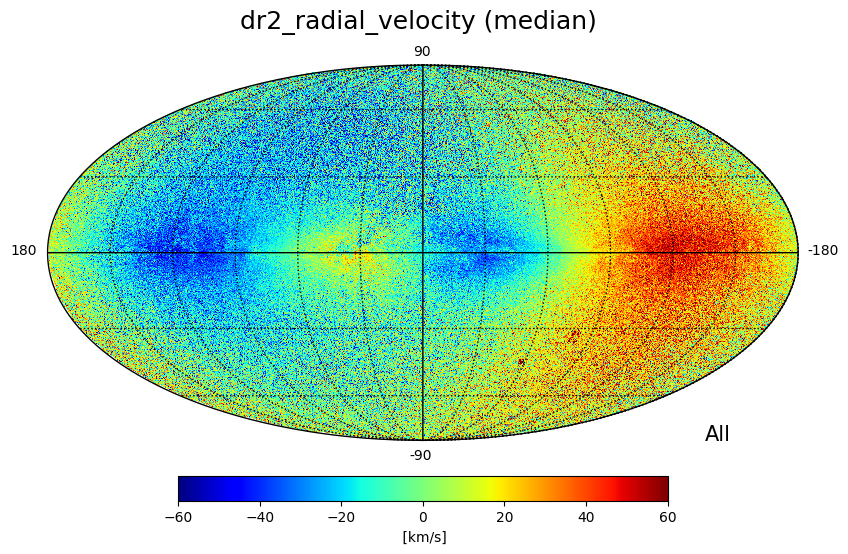
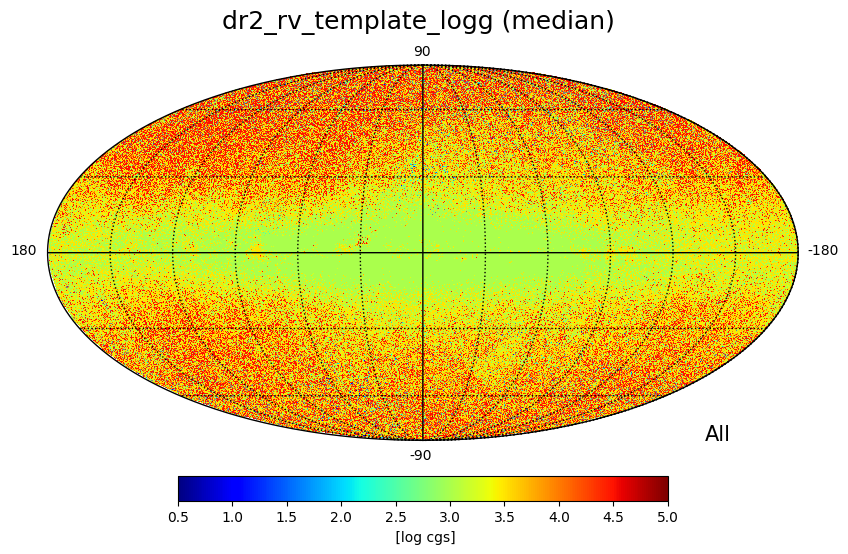
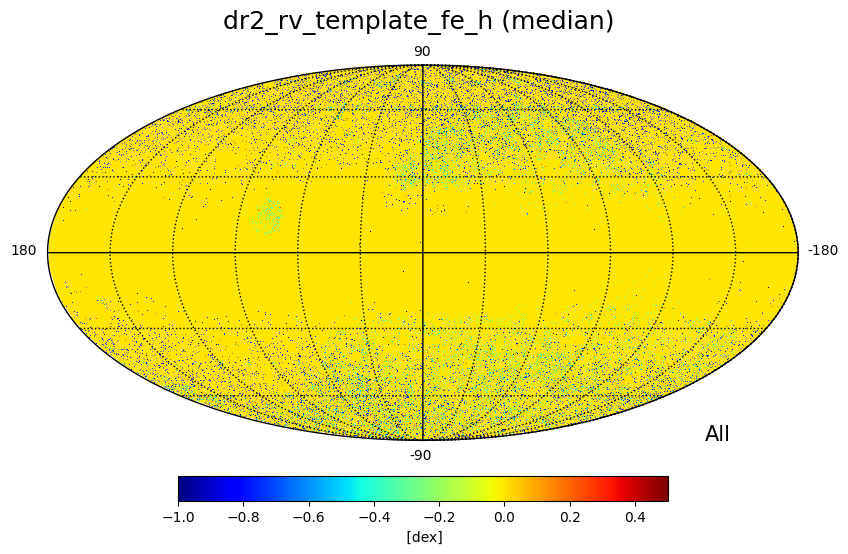
Figure 11.37:
HEALPix map of the median (large image),
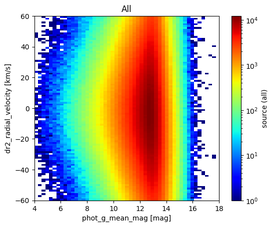
histogram 2D as a function of mangitude (large image), using bins of 0.28 mag for and 1.2 km sfor radial veocity, and
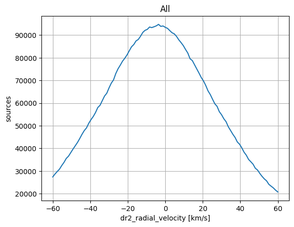
histogram (large image) of , using bins of 1.2 km s.
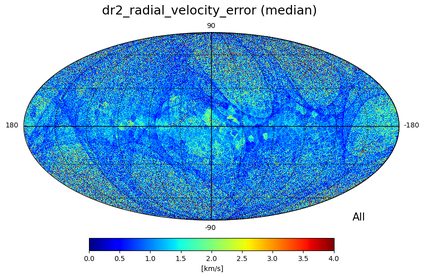
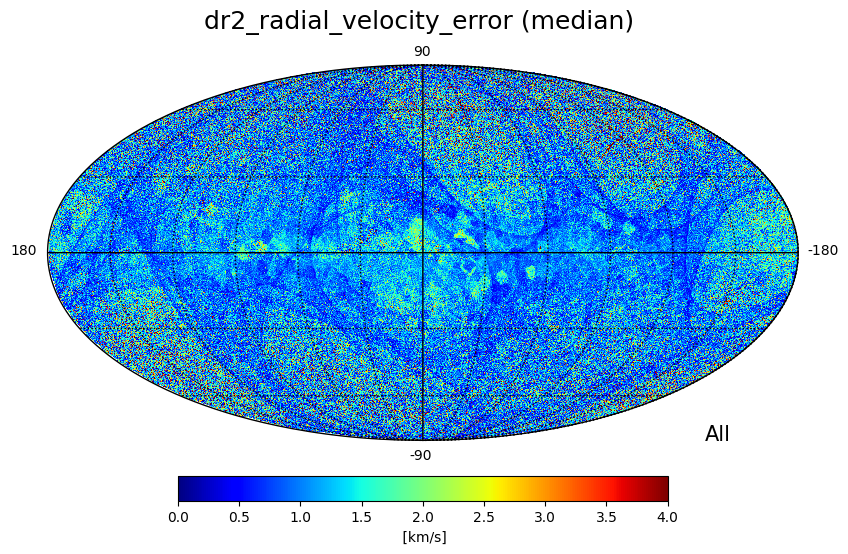
Figure 11.38:
HEALPix map of the median () error (large image),
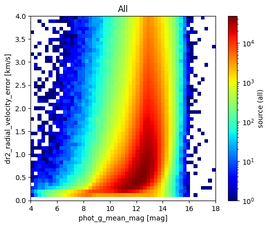
histogram 2D as a function of mangitude (large image), using bins of 0.28 mag for and 0.08 km sfor radial veocity error, and
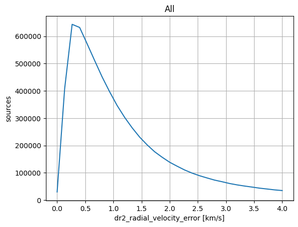
histogram (large image) of error in , using bins of 0.133 km s.