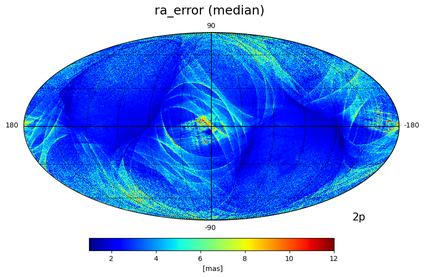
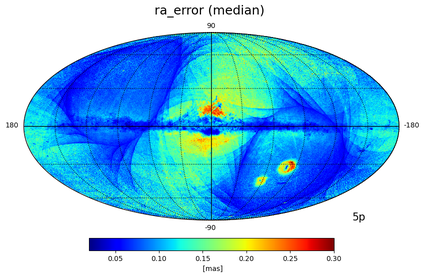
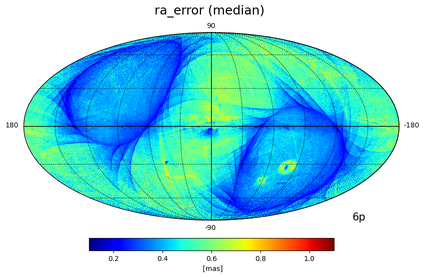
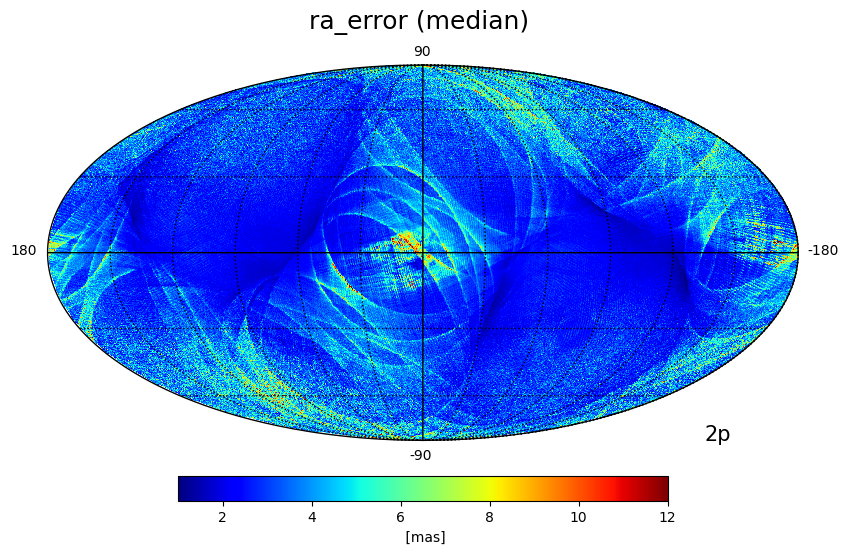
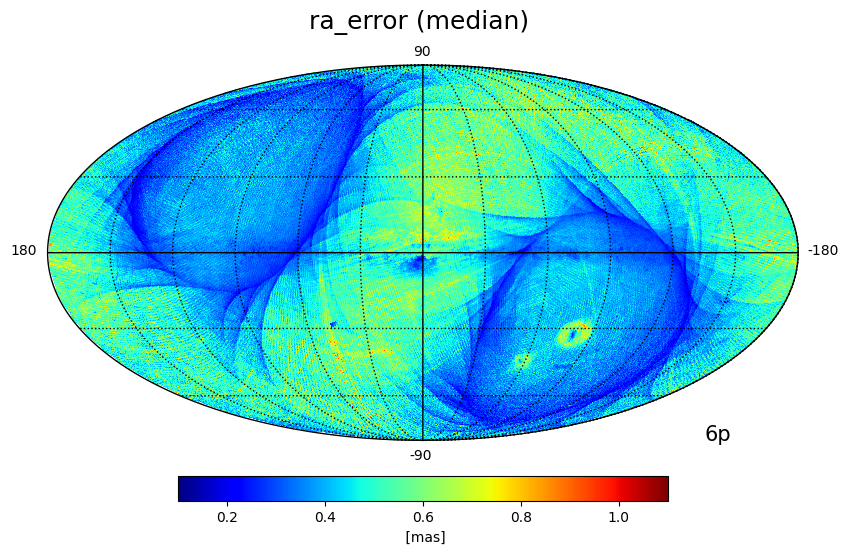
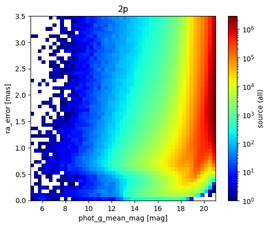
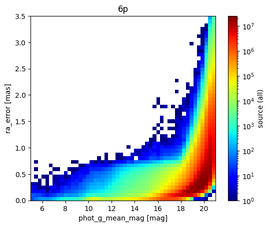
Figure 11.11:
2D histogram for right ascension error as a function of for 2p (large image),
5p (large image) and
6p (large image) solutions,
in bins of 0.32 mag for and 0.07 mas for right ascension error.
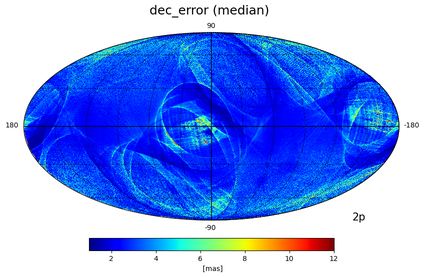
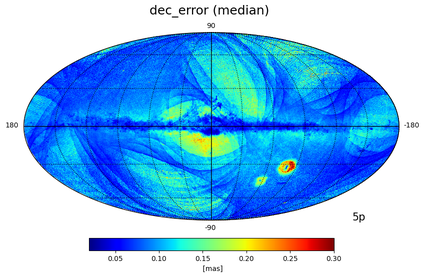
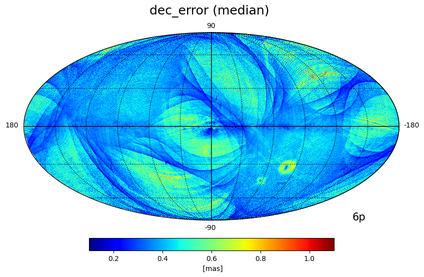
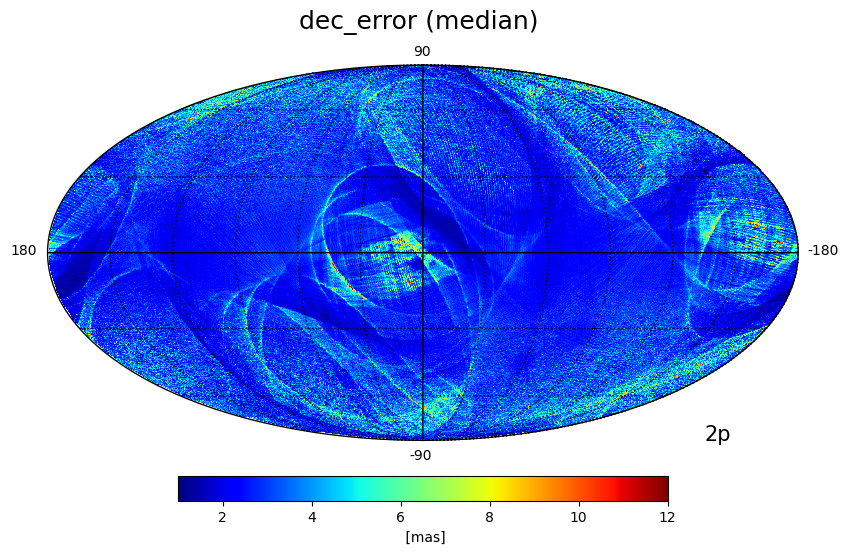
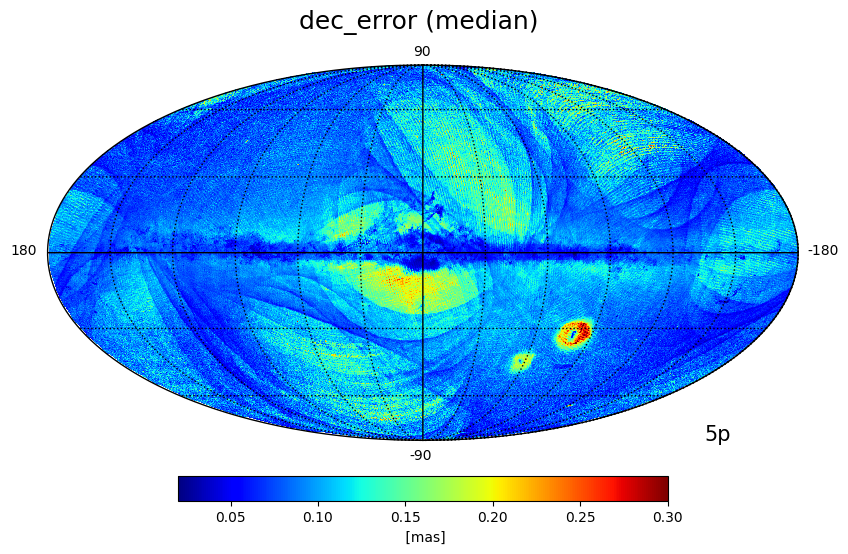
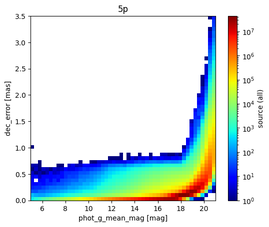
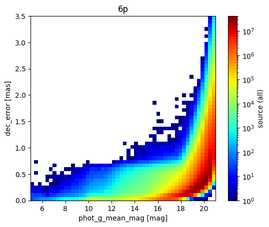
Figure 11.12:
2D histogram for declination error as a function of for 2p (large image),
5p (large image) and
6p (large image) solutions,
in bins of 0.32 mag for and 0.07 mas for declination error.

