skip to main content
→
European Space Agency
About ESAC
gaia early data release 3 documentation
Show
Contents
Gaia Early Data Release 3
Documentation release 1.1
Gaia Early Data Release 3
Documentation release 1.1
I
Introduction to Gaia Early Data Release 3
II
Gaia data processing
III
Gaia catalogue
7
Consolidation
8
Validation
9
Cross-match with external catalogues
10
Cross-match with Gaia DR2
11
Catalogue statistics and plots
11.1
Catalogue statistics and plots
11.1.1
Sky Density
11.1.2
Photometry
11.1.3
Positions
11.1.4
Parallaxes
11.1.5
Proper motions
11.1.6
Astrometric correlations
11.1.7
Observations
11.1.8
Radial Velocity
11.1.9
Other astrometric parameters
IV
Gaia archive
Miscellaneous
Bibliography
11.1
Catalogue statistics and plots
11.1.1
Sky Density
11.1.3
Positions
11.1.2
Photometry
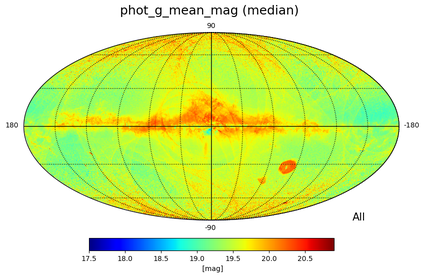
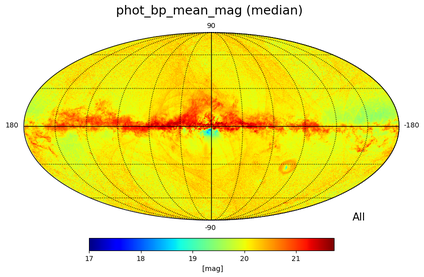
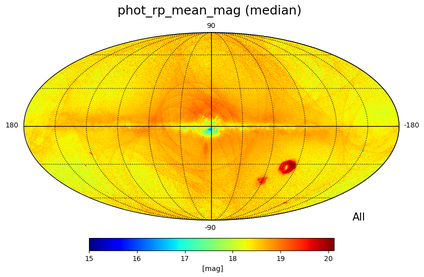
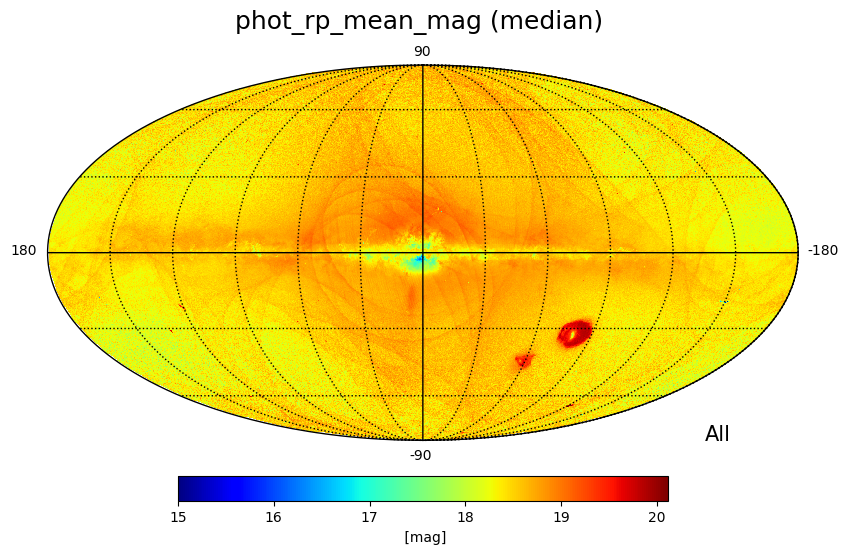
Figure 11.3:
HEALPix map of median
G
(large image)
, median
G
BP
(large image)
and median
G
RP
(large image)
magnitudes
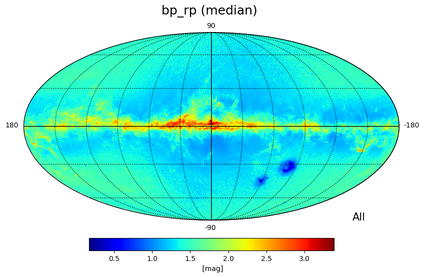
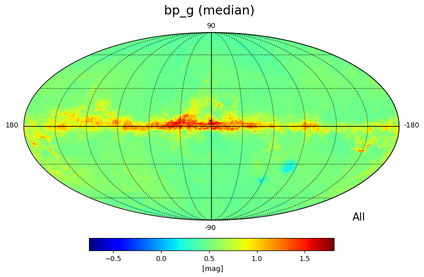
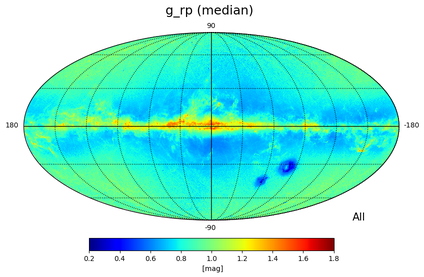
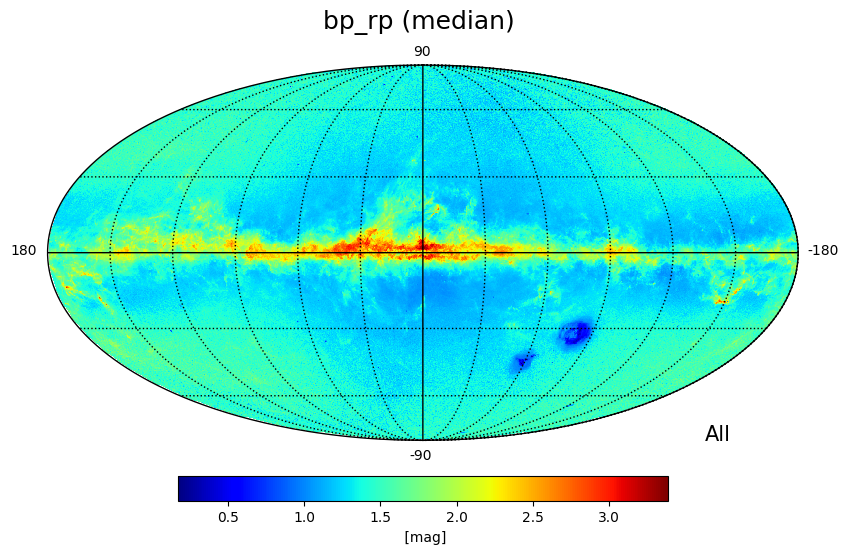
Figure 11.4:
HEALPix map of median
G
BP
-
G
RP
(large image)
, median
G
BP
-
G
(large image)
and median
G
-
G
RP
(large image)
colours
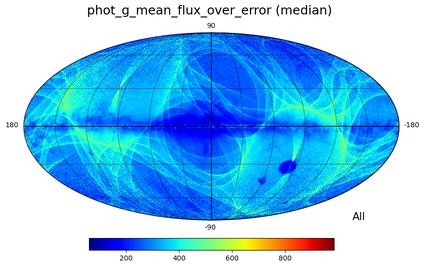
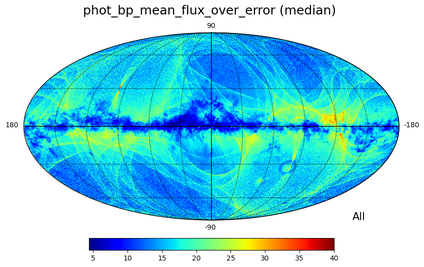
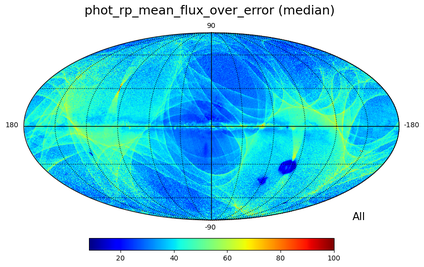
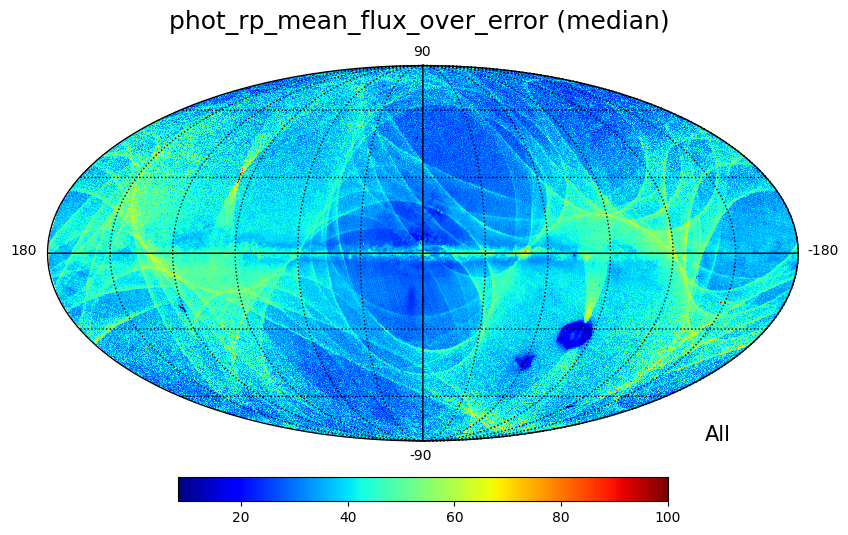
Figure 11.5:
HEALPix map of signal-to-noise ratio for G
(large image)
,
G
BP
(large image)
and
G
RP
(large image)
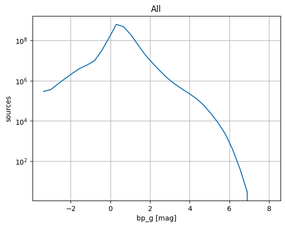
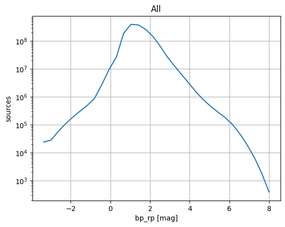
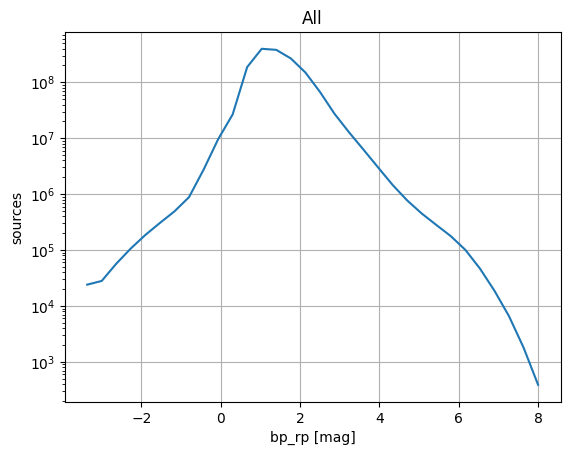
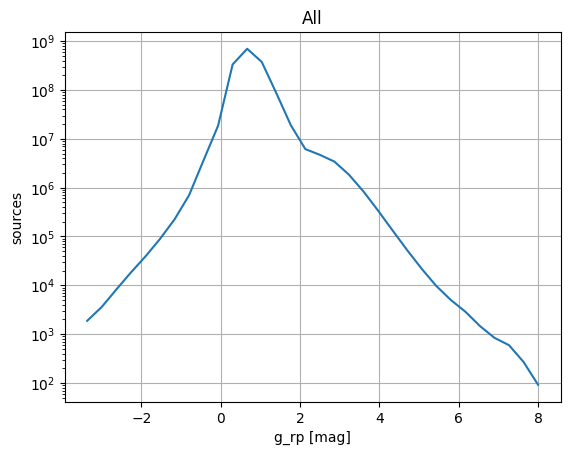
Figure 11.6:
Histograms of the number of sources as a function of the
G
BP
-
G
(large image)
,
G
BP
-
G
RP
(large image)
, and
G
-
G
RP
(large image)
colours, respectively, in bins of 0.367 mag.
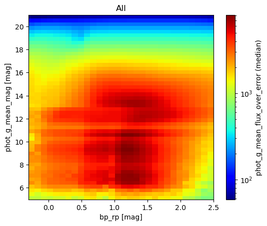
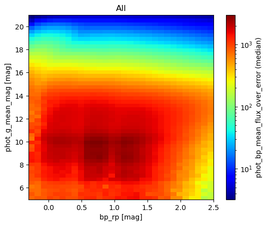
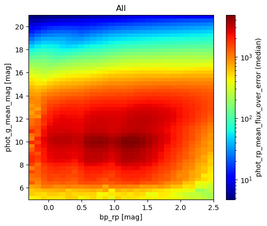
Figure 11.7:
Median Signal-to-noise ratio in the colour-magnitude plane for G
(large image)
,
G
BP
(large image)
and
G
RP
(large image)
, respectively.
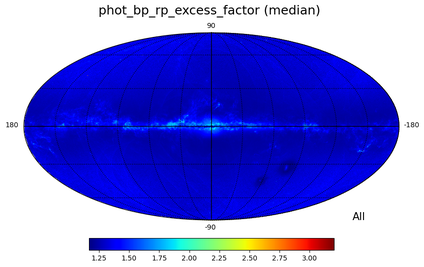
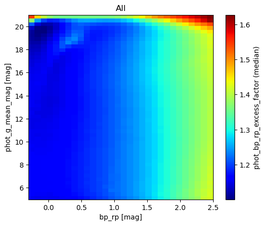
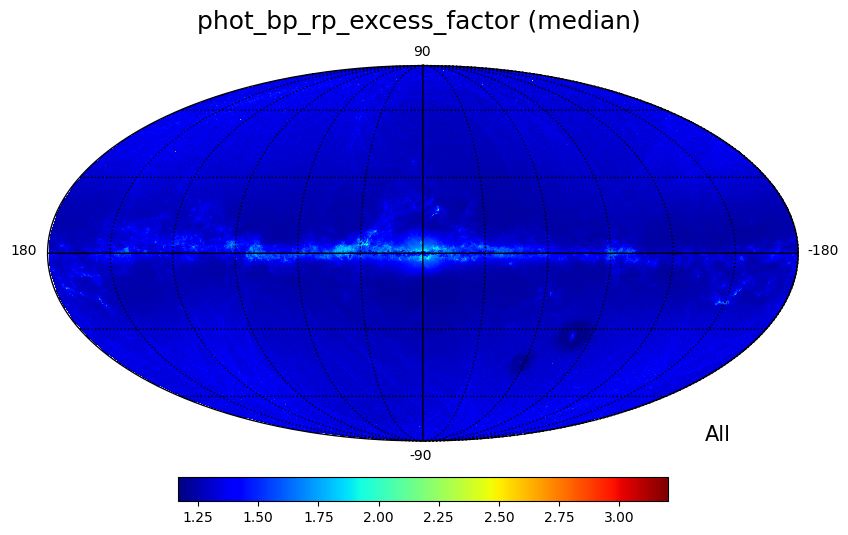
Figure 11.8:
Sky distribution of the median
phot_bp_rp_excess_factor
(large image)
and histogram as a function of
G
and
G
BP
-
G
RP
colour
(large image)
.
