skip to main content
→
European Space Agency
About ESAC
gaia early data release 3 documentation
Show
Contents
Gaia Early Data Release 3
Documentation release 1.1
Gaia Early Data Release 3
Documentation release 1.1
I
Introduction to Gaia Early Data Release 3
II
Gaia data processing
III
Gaia catalogue
7
Consolidation
8
Validation
9
Cross-match with external catalogues
10
Cross-match with Gaia DR2
11
Catalogue statistics and plots
11.1
Catalogue statistics and plots
11.1.1
Sky Density
11.1.2
Photometry
11.1.3
Positions
11.1.4
Parallaxes
11.1.5
Proper motions
11.1.6
Astrometric correlations
11.1.7
Observations
11.1.8
Radial Velocity
11.1.9
Other astrometric parameters
IV
Gaia archive
Miscellaneous
Bibliography
11.1
Catalogue statistics and plots
11.1.8
Radial Velocity
IV
Gaia archive
11.1.9
Other astrometric parameters
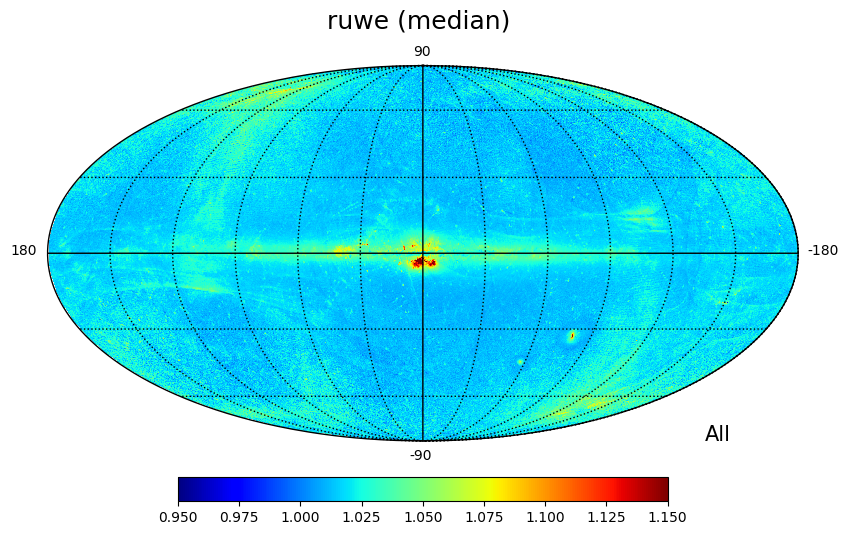
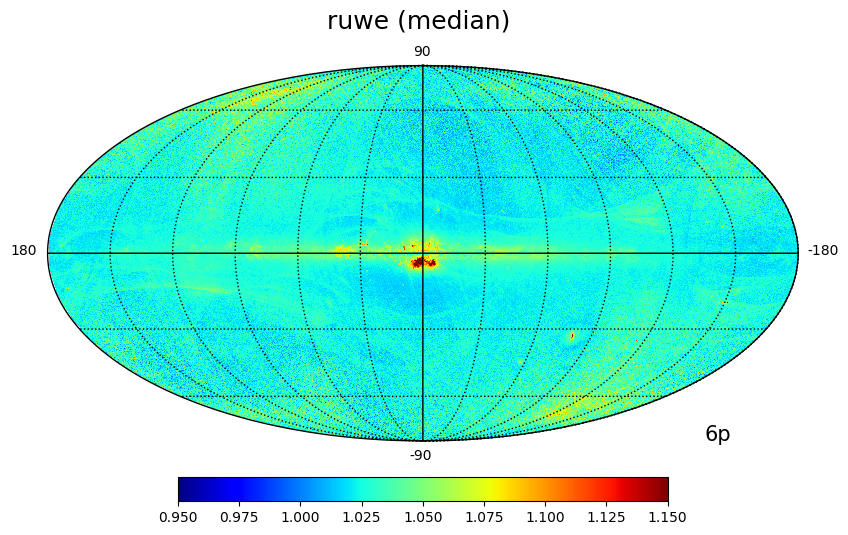
Figure 11.40:
HEALPix maps of median
ruwe
for all sources
(large image)
, 5p
(large image)
and 6p
(large image)
solutions.
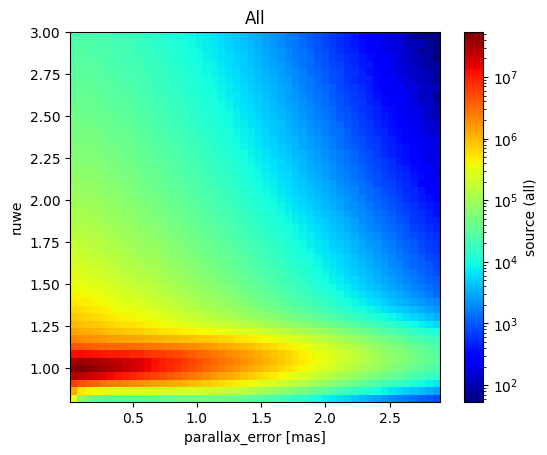
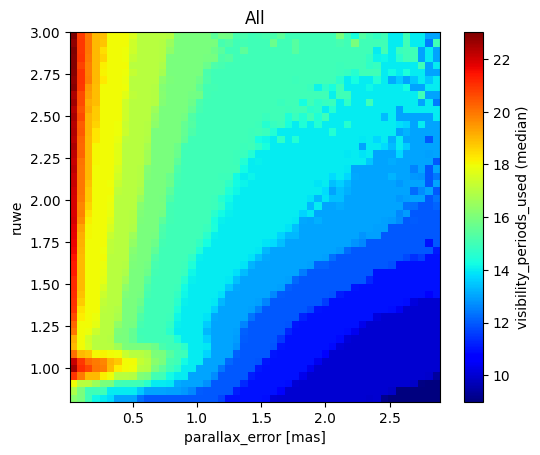
Figure 11.41:
Histogram of
ruwe
for 5p and 6p solutions
(large image)
using bins of 0.267, 2D histogram of
ruwe
as a function of
parallax_error
for all sources
(large image)
, using bins of 0.057 mas for parallax error and 0.044 for
ruwe
, and median of
visibility_periods_used
in the previous 2D histogram
(large image)
.
Figure 11.42:
HEALPix map of median astrometric
pseudocolour
(large image)
and median
pseudocolour_error
(large image)
for sources with 6p solution
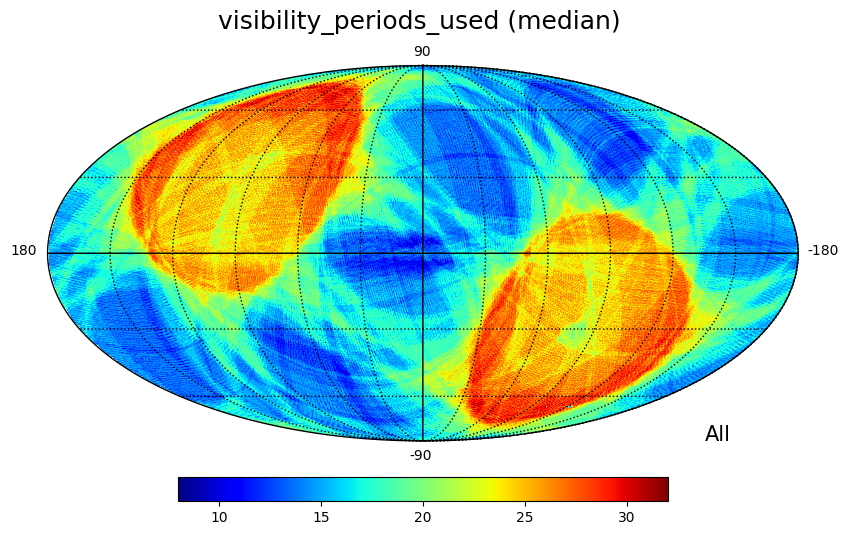
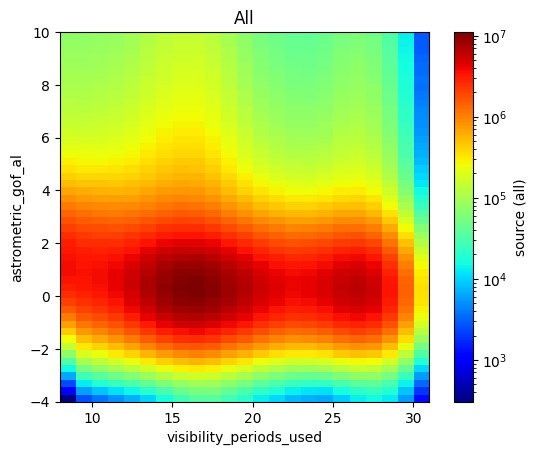
Figure 11.43:
HEALPix map of median
visibility_periods_used
(large image)
, 2D histogrram of
astrometric_gof_al
as a function of
visibility_periods_used
(large image)
, using bins of 1 for visibility periods and 0.28 for
astrometric_gof_al
, and median
parallax_error
for the previous histogram
(large image)
.
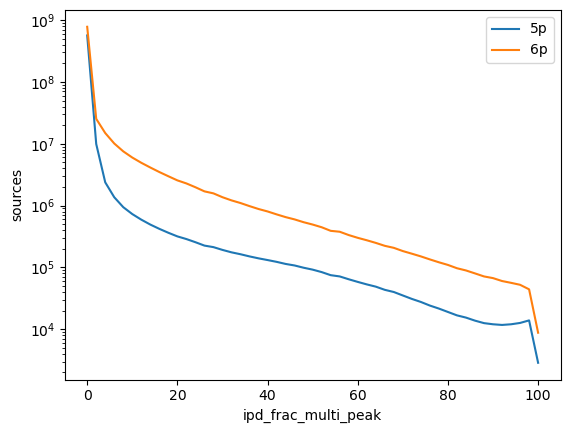
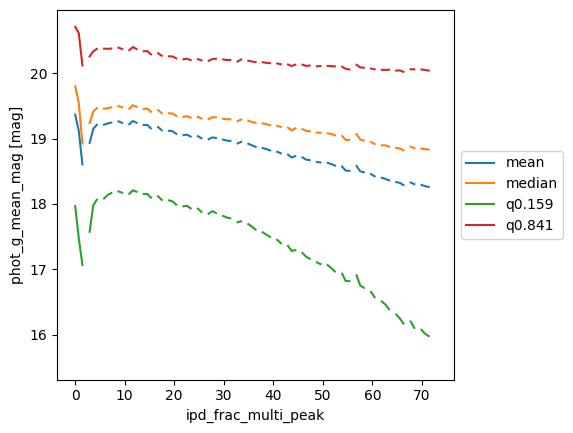
Figure 11.44:
1D histogram of the
ipd_frac_multi_peak
(large image)
in bins of 2.0, and the distribution of
G
magnitude
(large image)
and
parallax
(large image)
as a function of
ipd_frac_multi_peak
, using bins of 0.728.


