5.5.1 Photometric relationships with other photometric systems
Author(s): Josep Manel Carrasco, Michele Bellazzini
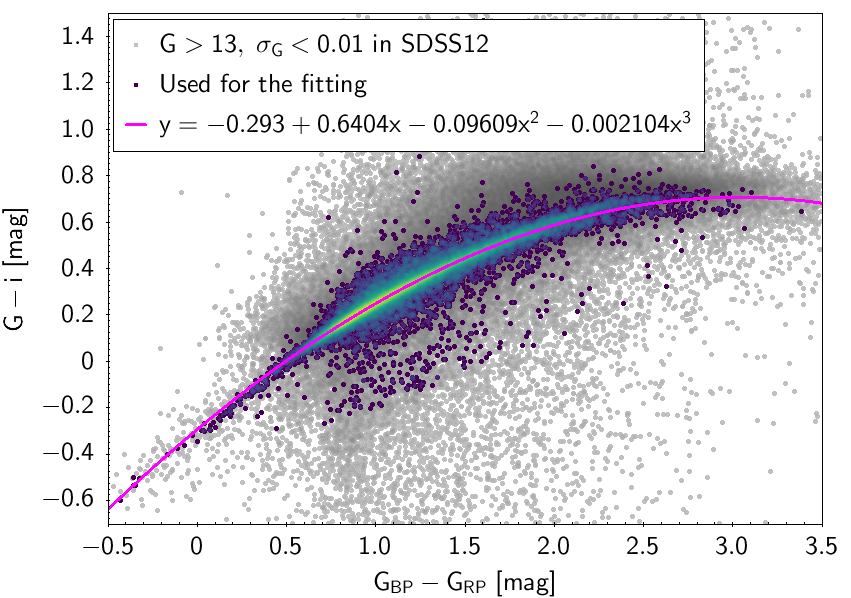
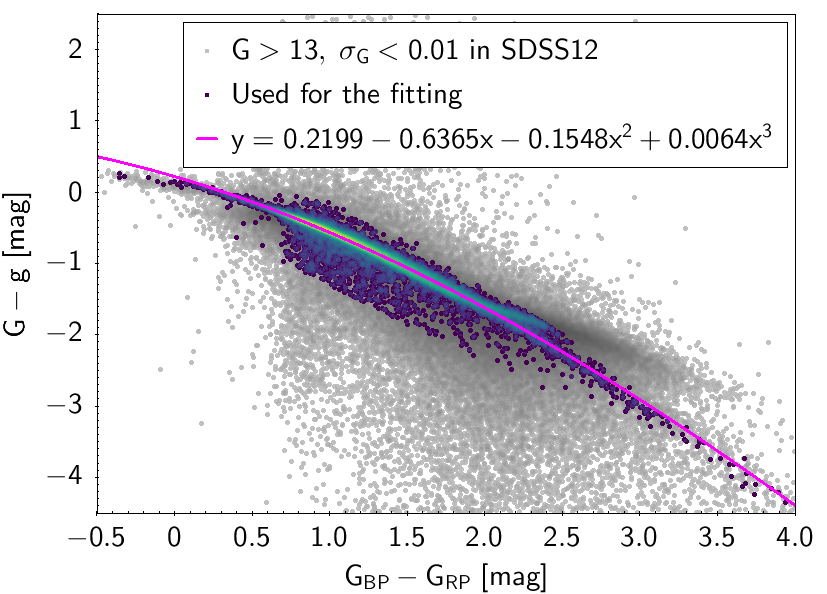
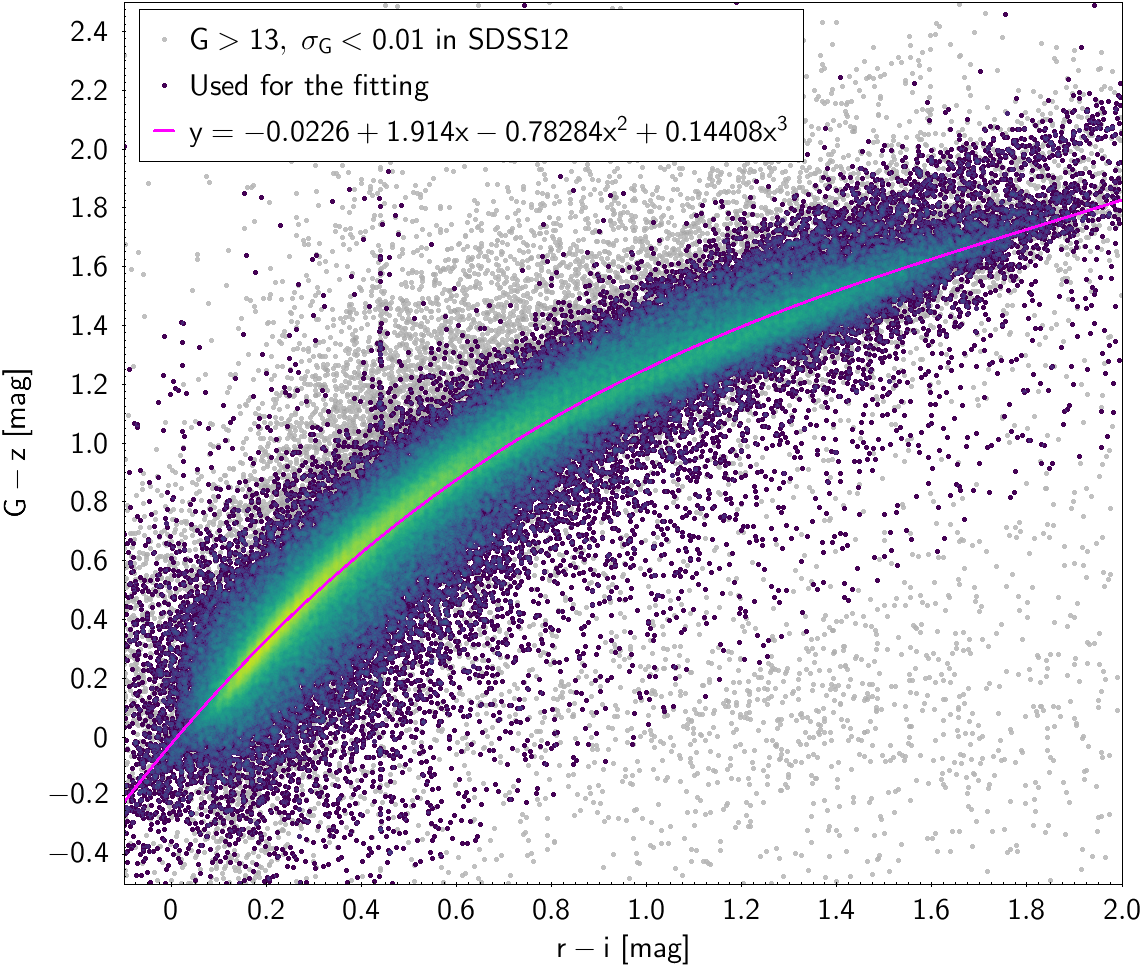
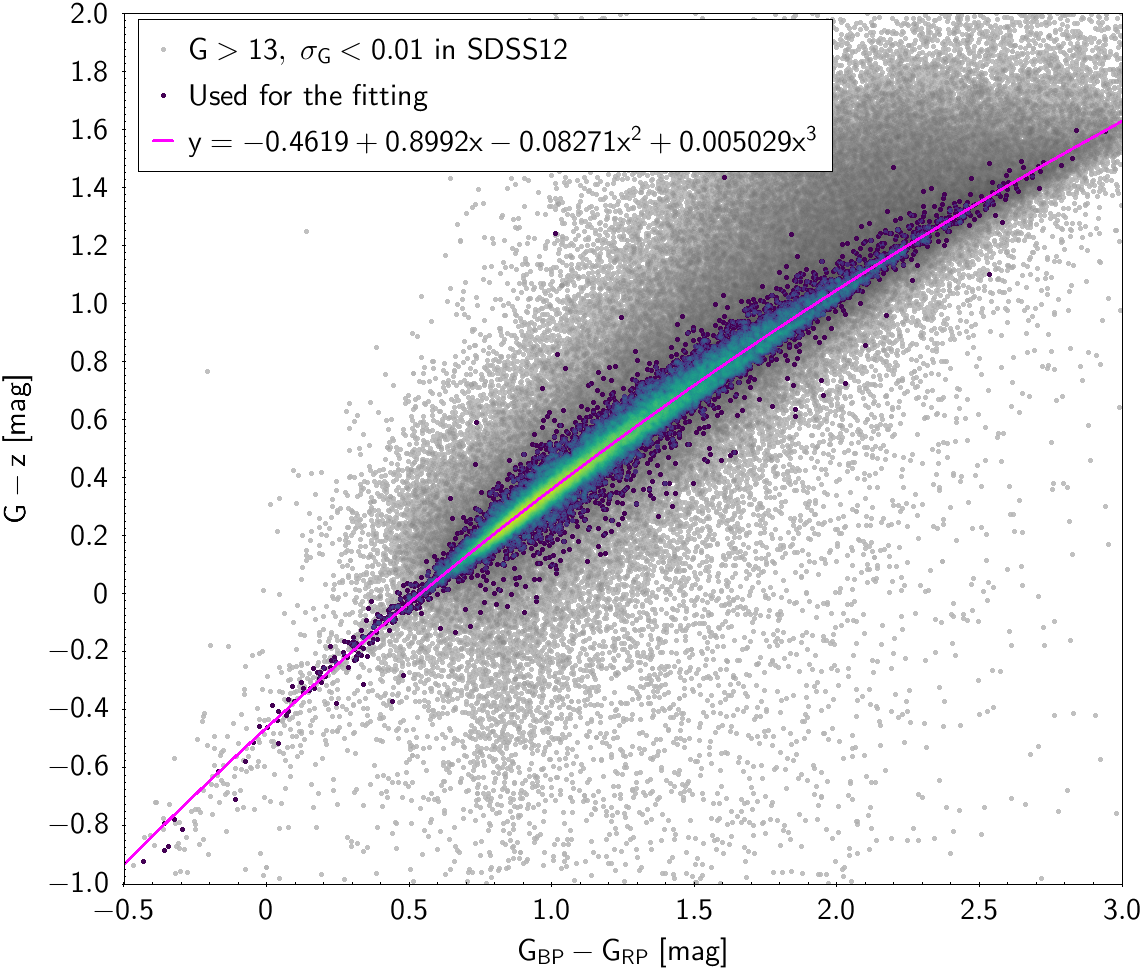
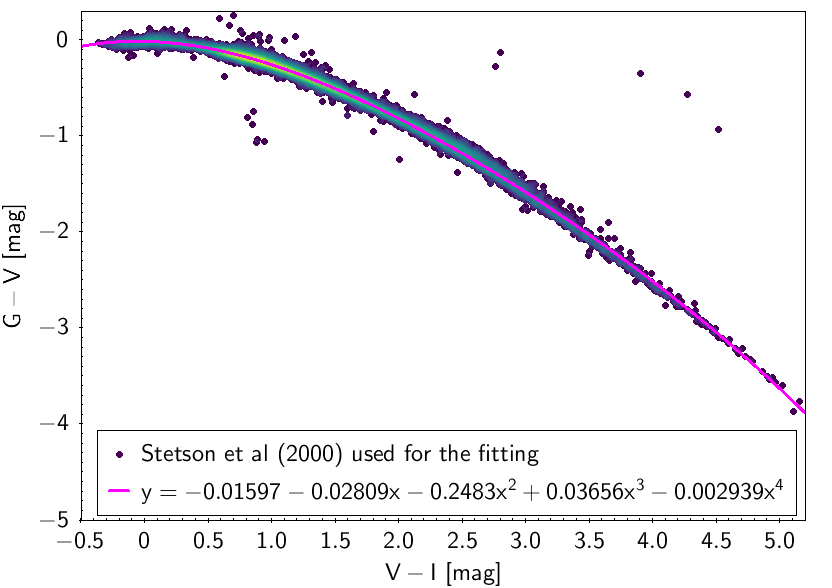
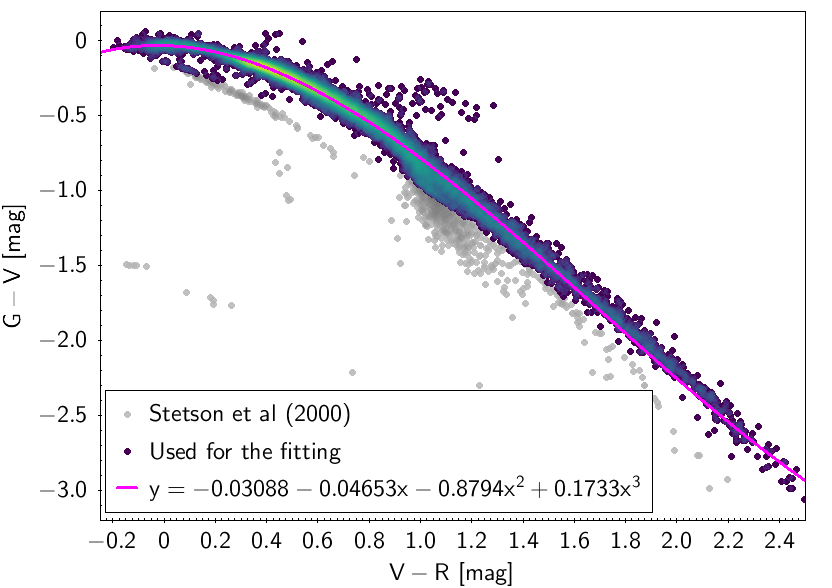
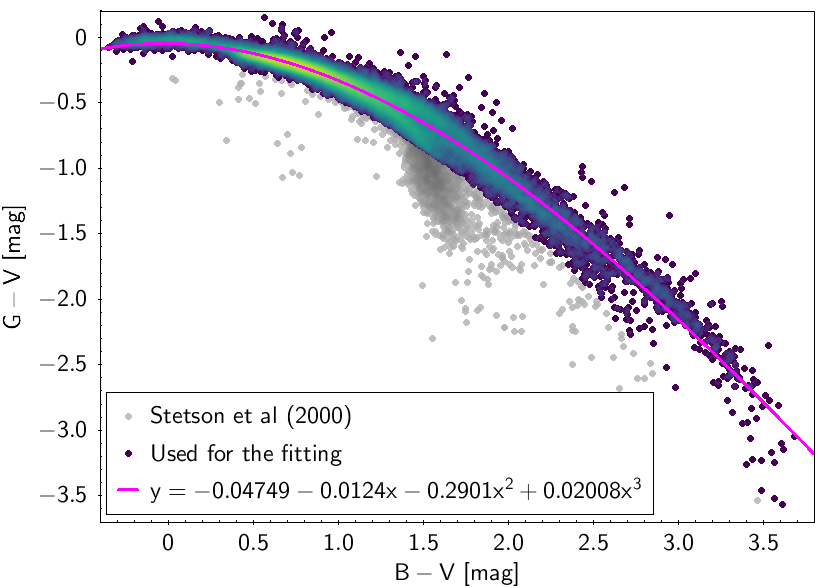
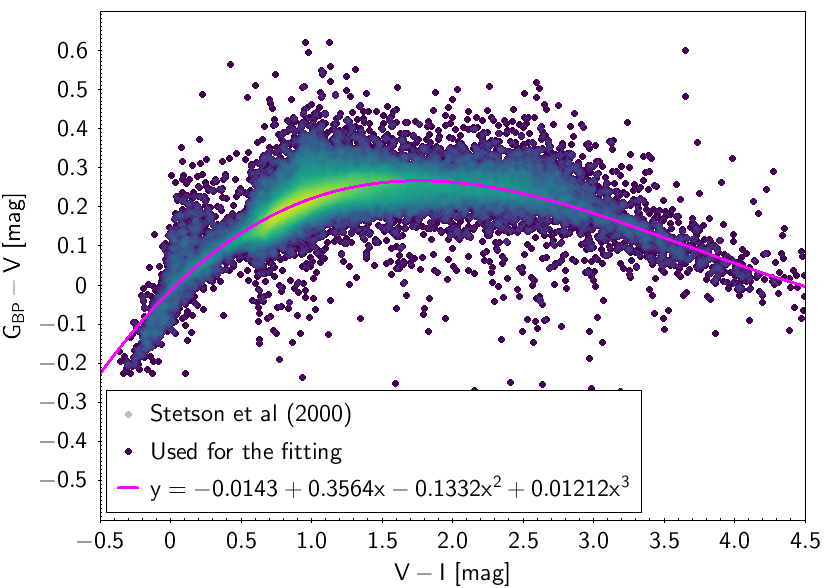
This section includes some transformations between Gaia photometry and other common photometric systems using Gaia DR3 data. Hipparcos (ESA 1997), Tycho-2 (Høg et al. 2000), SDSS12 (Alam et al. 2015), Johnson-Cousins (Stetson 2000), 2MASS (Skrutskie et al. 2006) and GSC2.3 (Lasker et al. 2008) are included here.
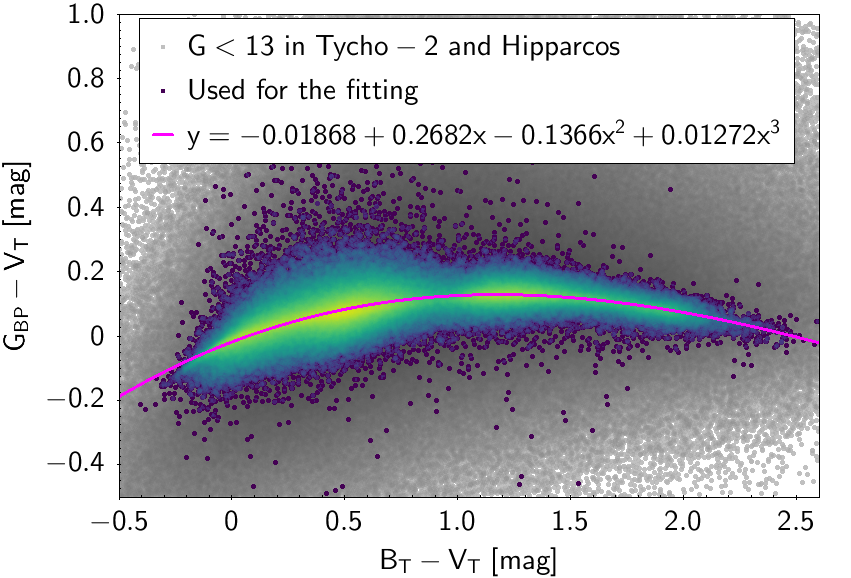
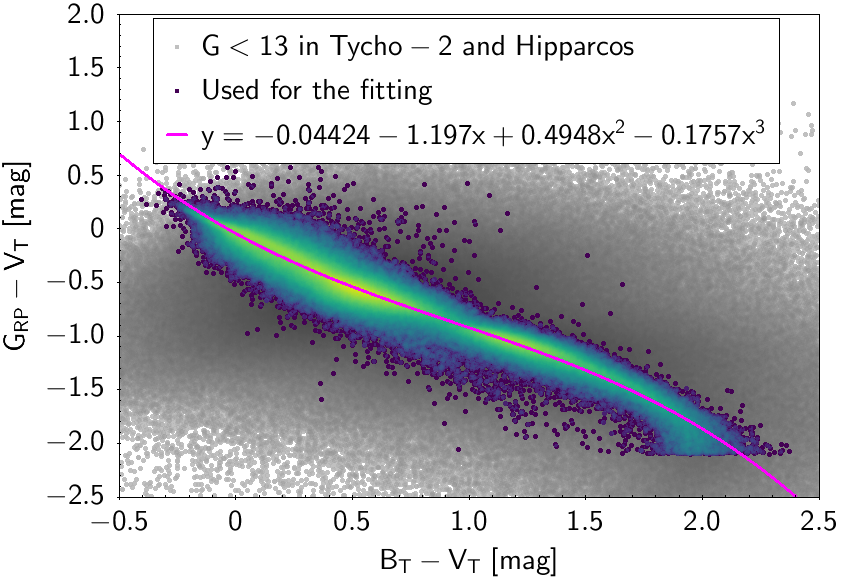
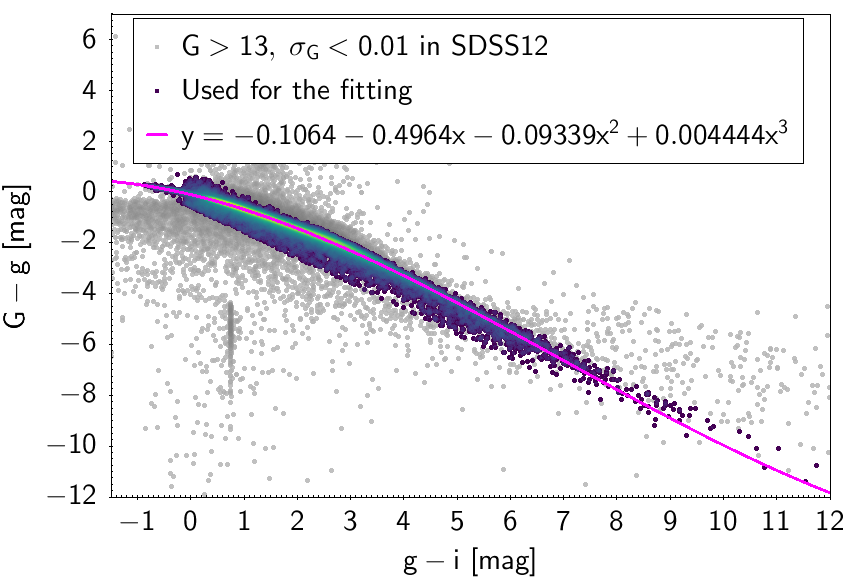
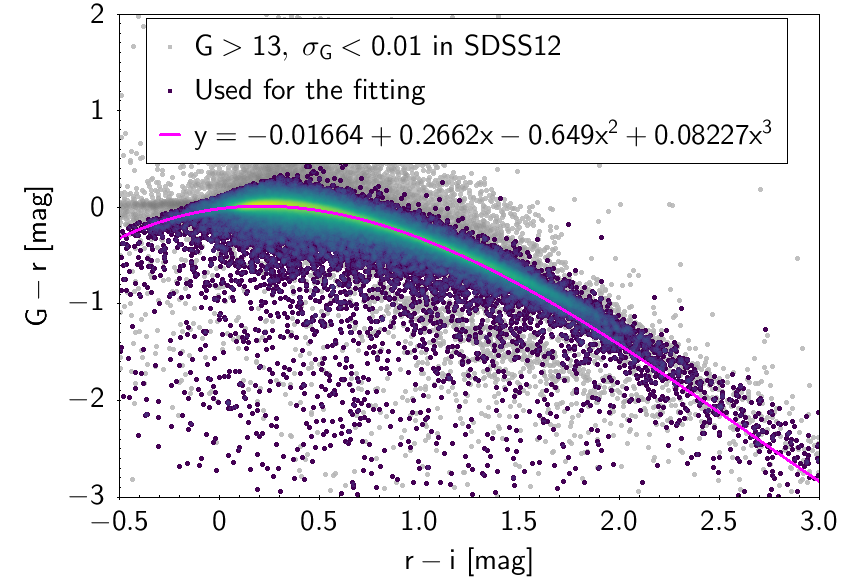
Except for the Johnson-Cousins system, for which all available sources were used due to its intrinsic quality, for the other systems only those sources with small magnitude error and small excess flux were used for the fitting. In order to minimise the effect of the photometric noise on the derived relationships, only Gaia DR3 sources with mag were considered for the cross-match, and only those with available photometry in all three Gaia passbands and in the external photometric systems were used. Nevertheless, this dataset is not appropriate for SDSS12 transformations, as SDSS12 sources brighter than 14 mag are saturated. To avoid this problem, for SDSS12 transformations we used some Gaia DR3 sources with and only SDSS12 magnitudes fainter than 15 mag. For the GSC2.3 transformations, two different fittings were done, one using sources with , and the other with sources at , as the photometric systems in the two celestial hemispheres are somewhat different. In order to obtain cleaner fittings, some filtering criteria were adopted in the production of the colour-colour diagrams. Detailed information on the filtering to produce the photometric relationships is given in Table 5.6 and Table 5.7.
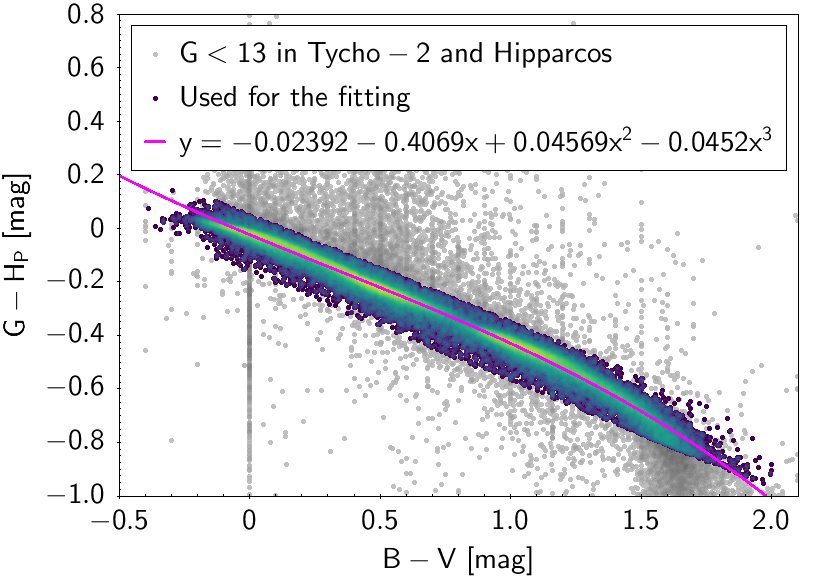
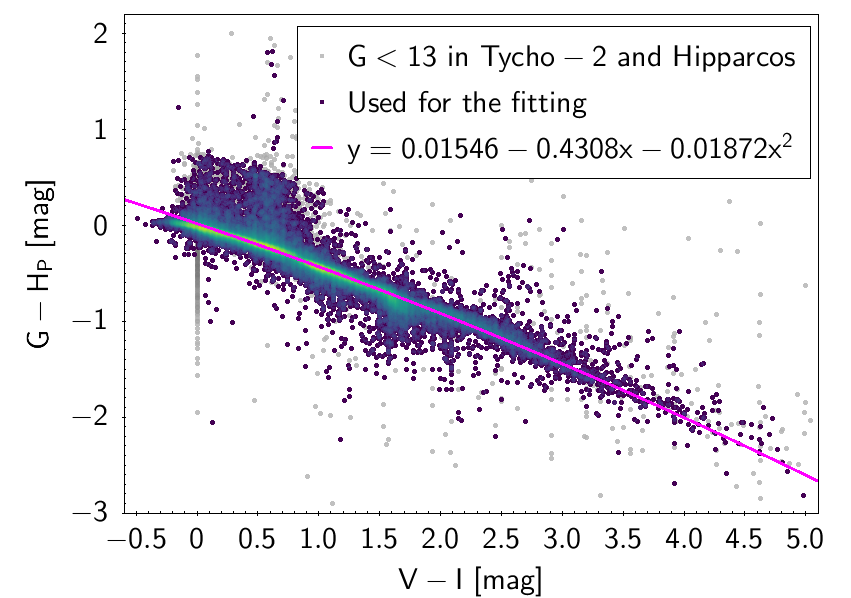
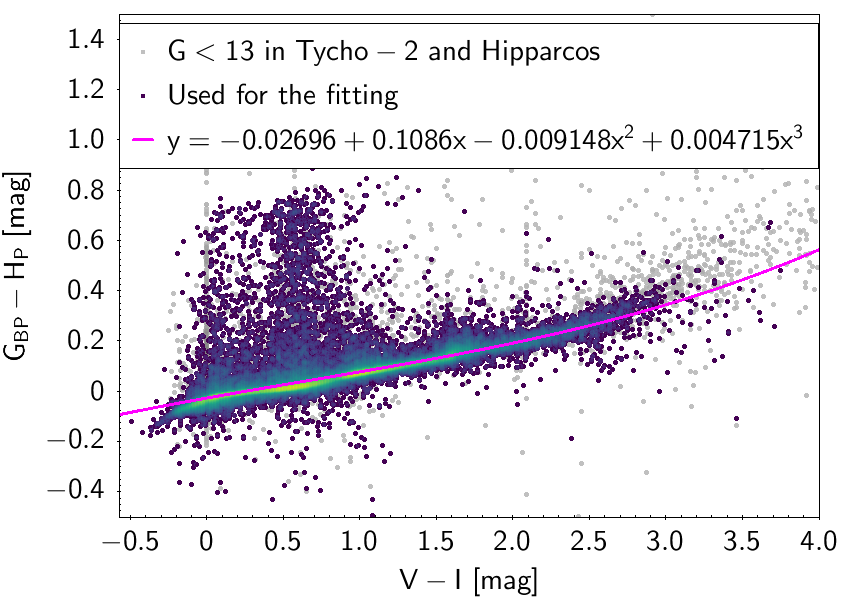
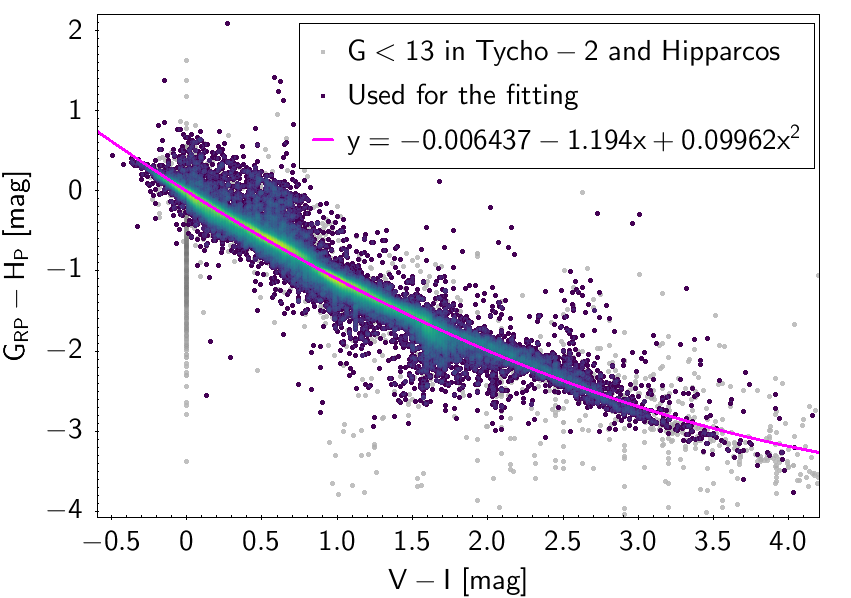
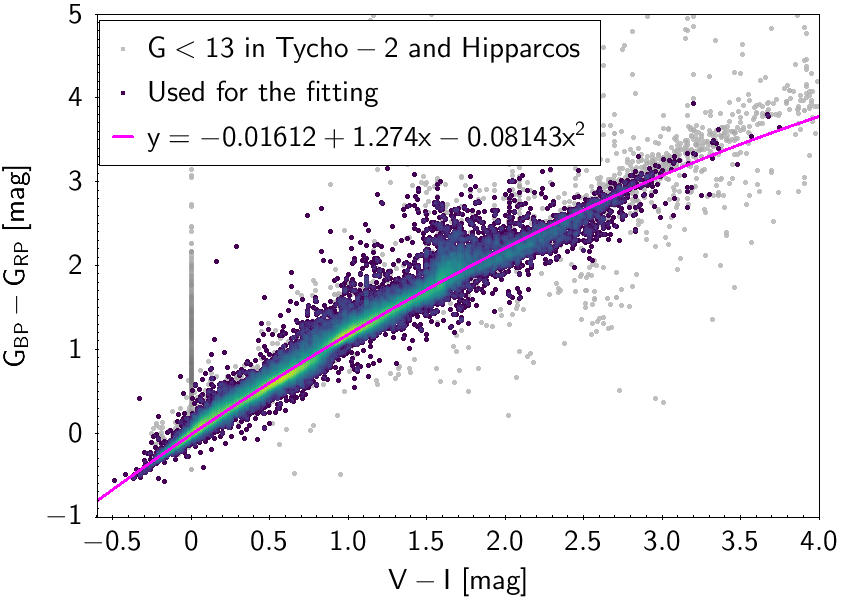
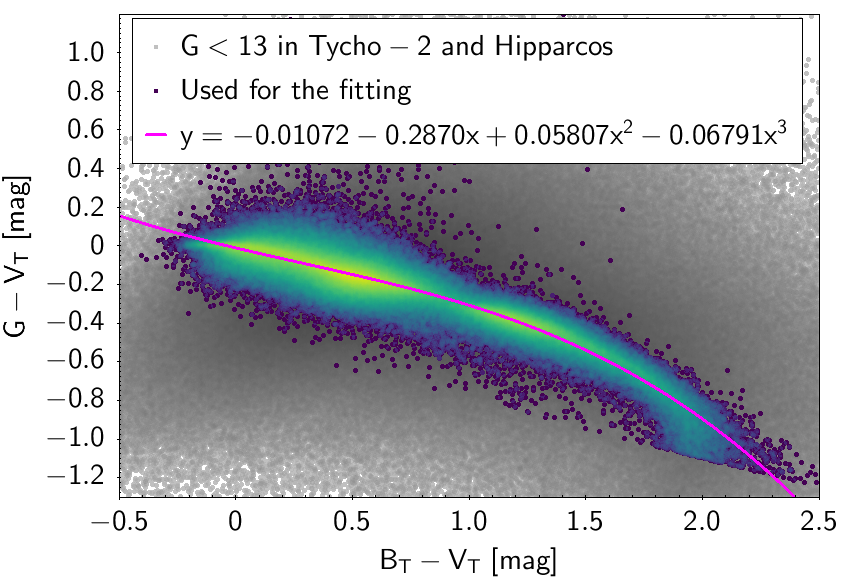
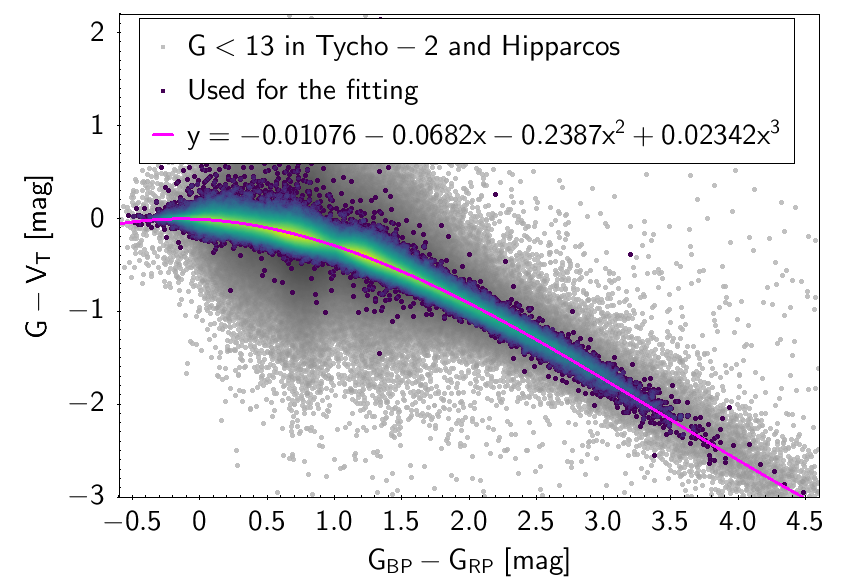
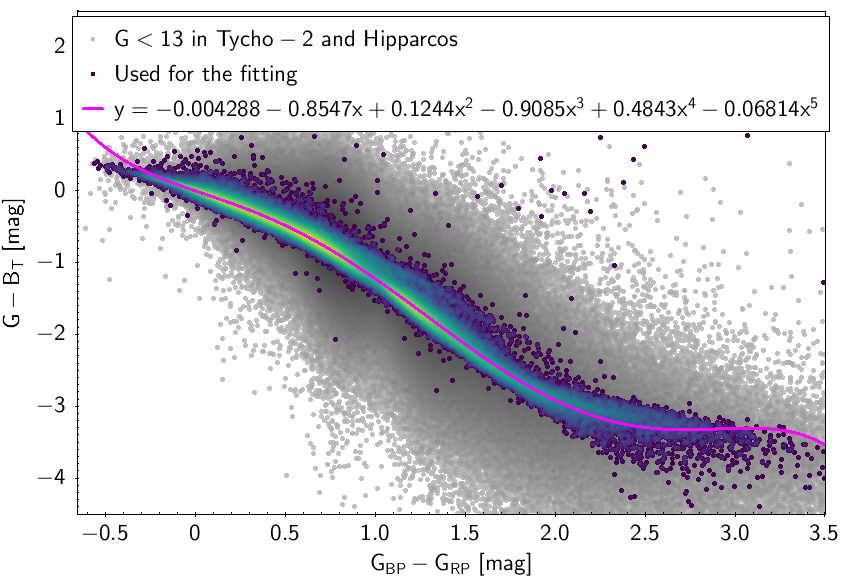
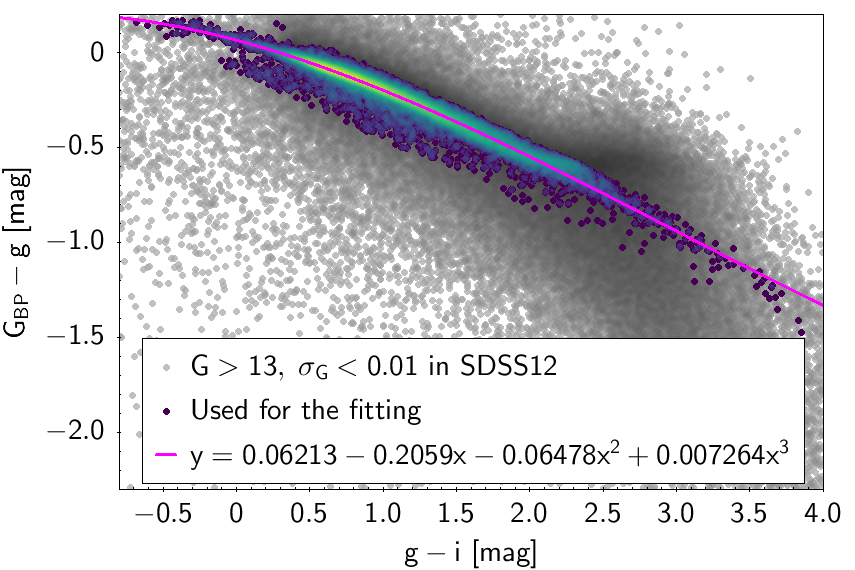
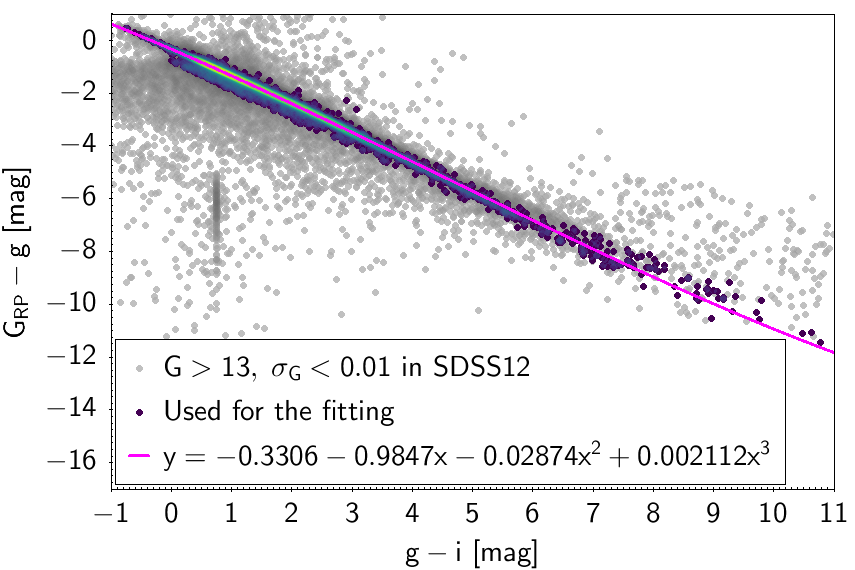
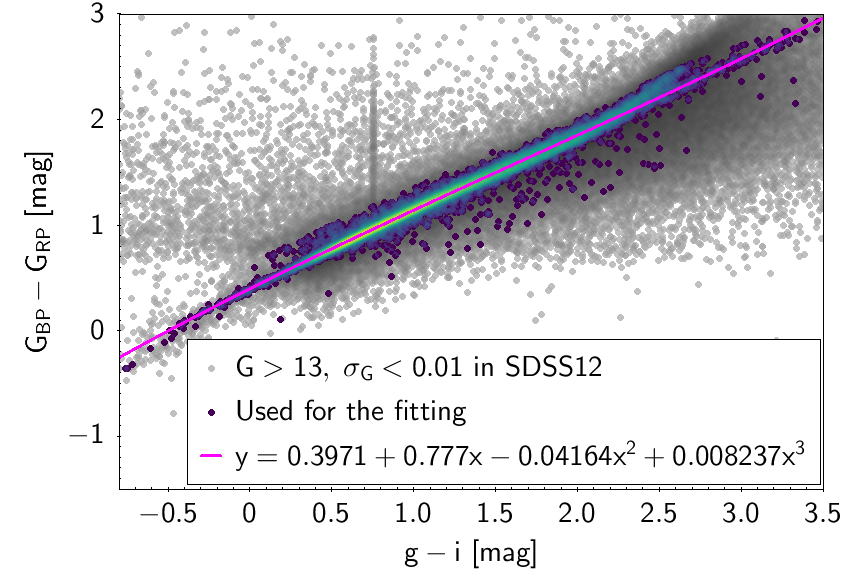
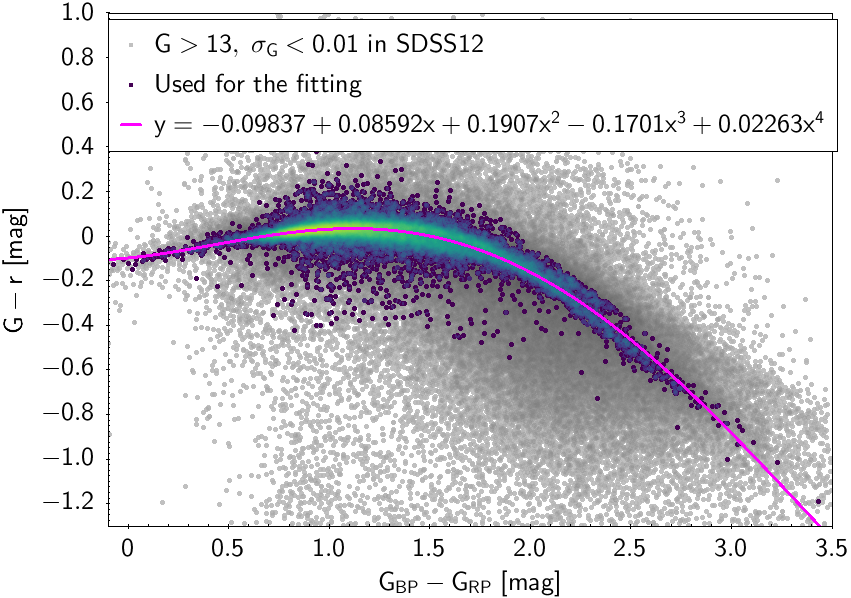
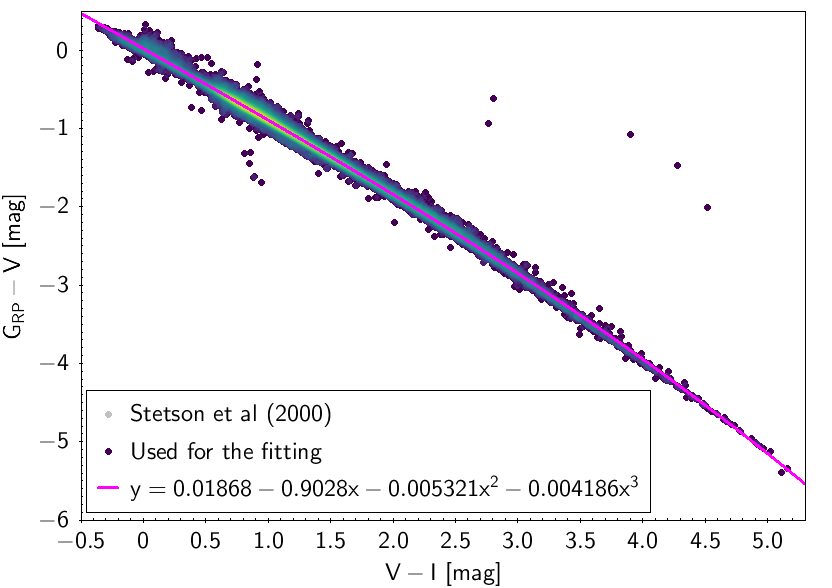
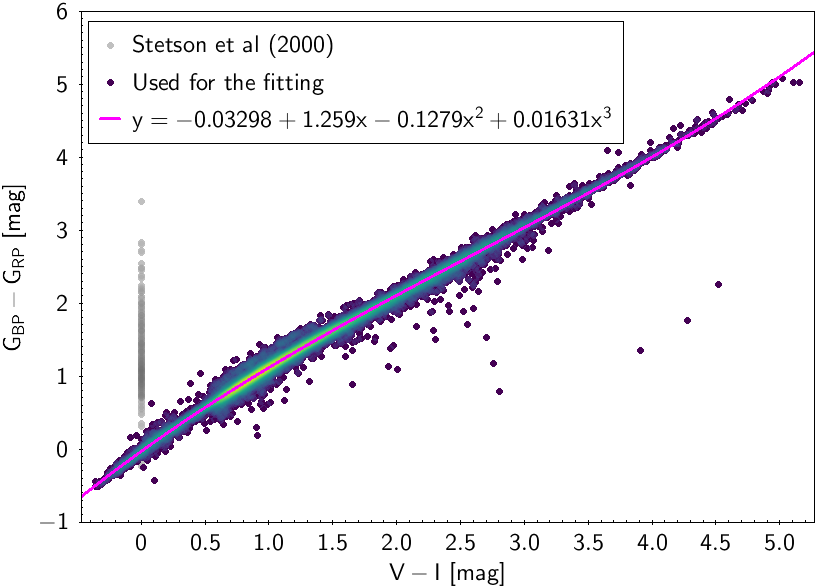
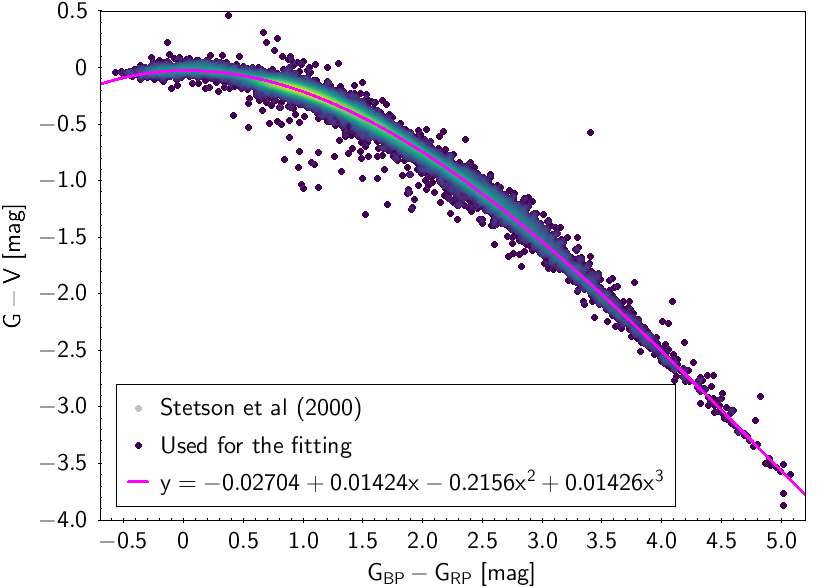
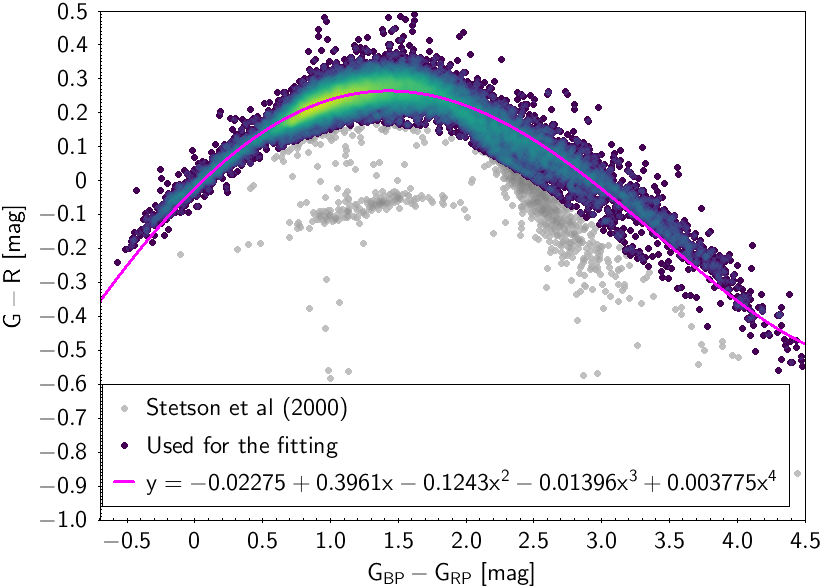
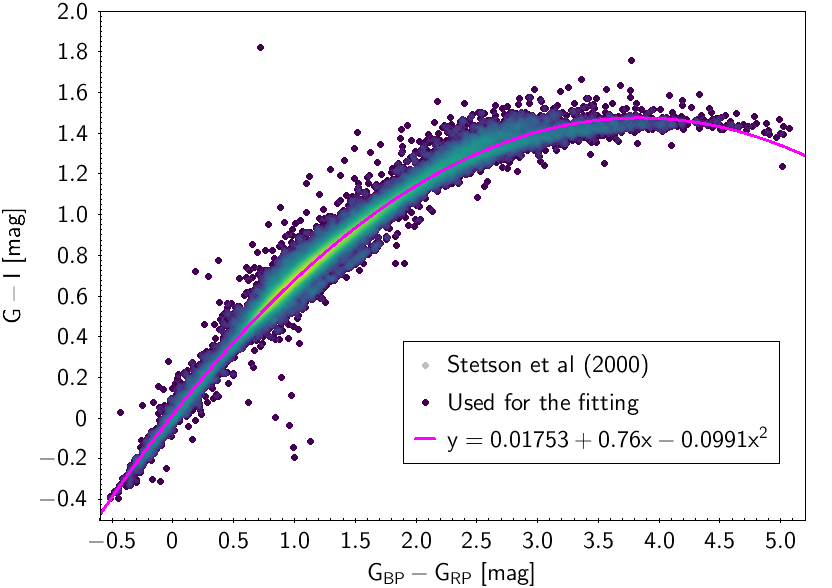
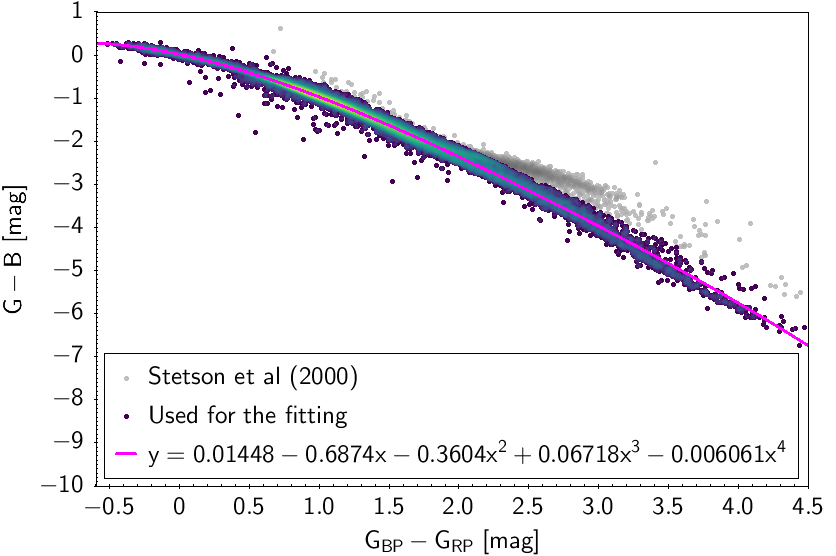
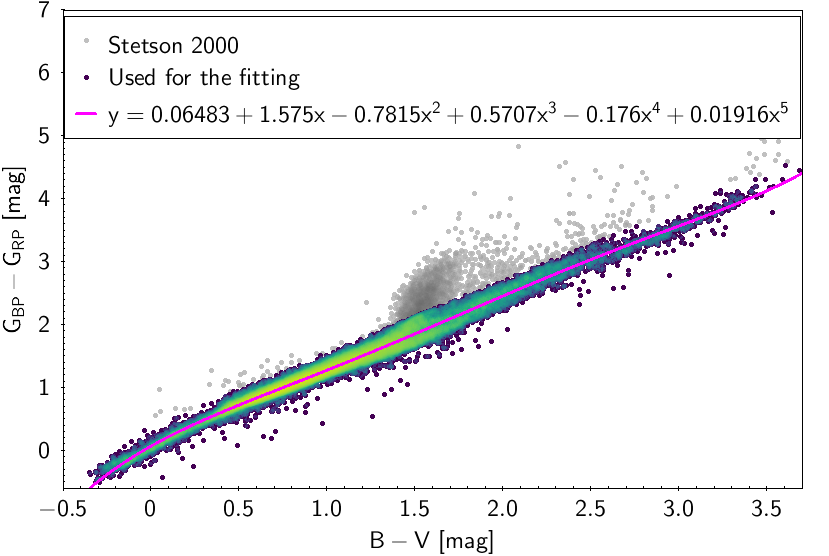
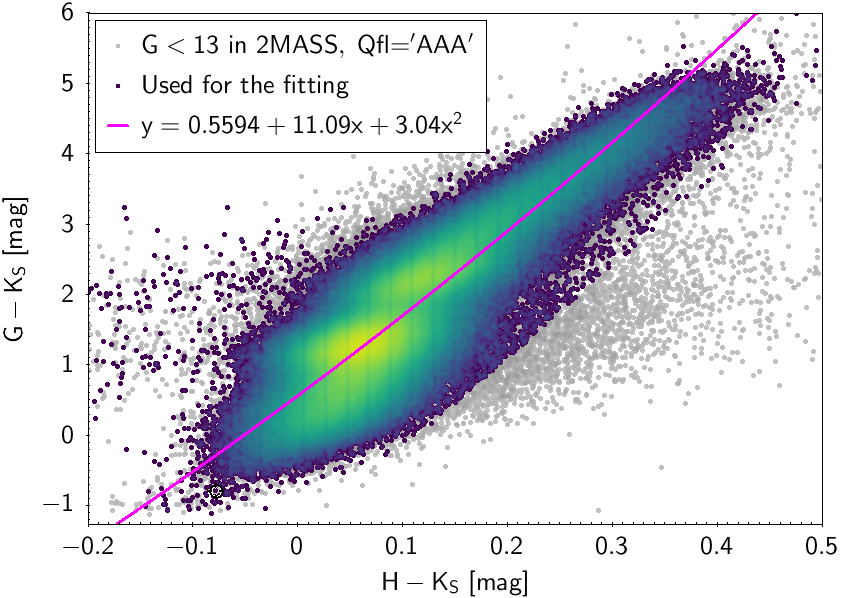
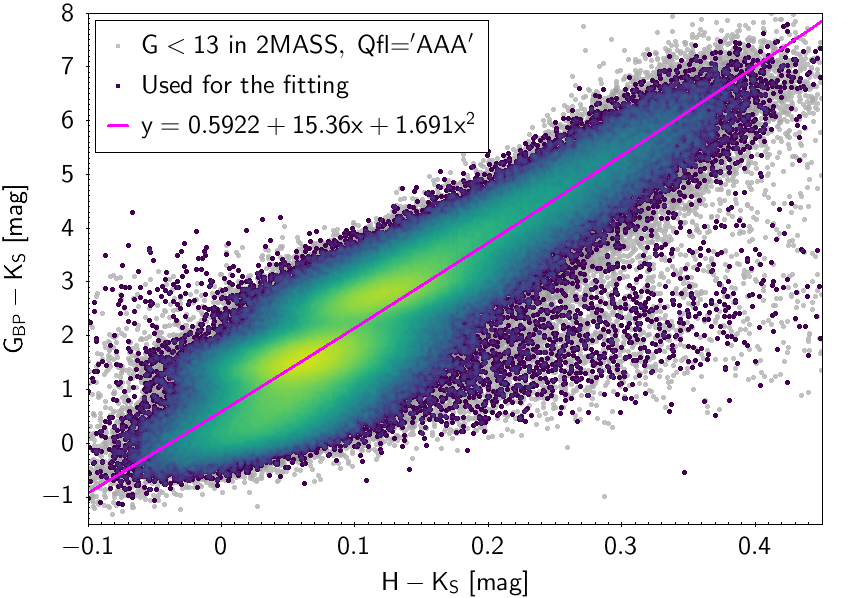
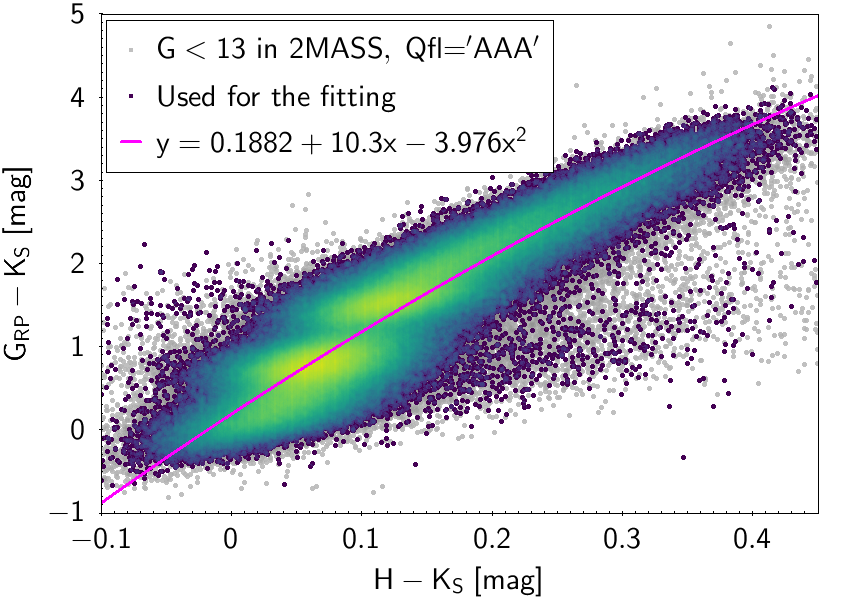
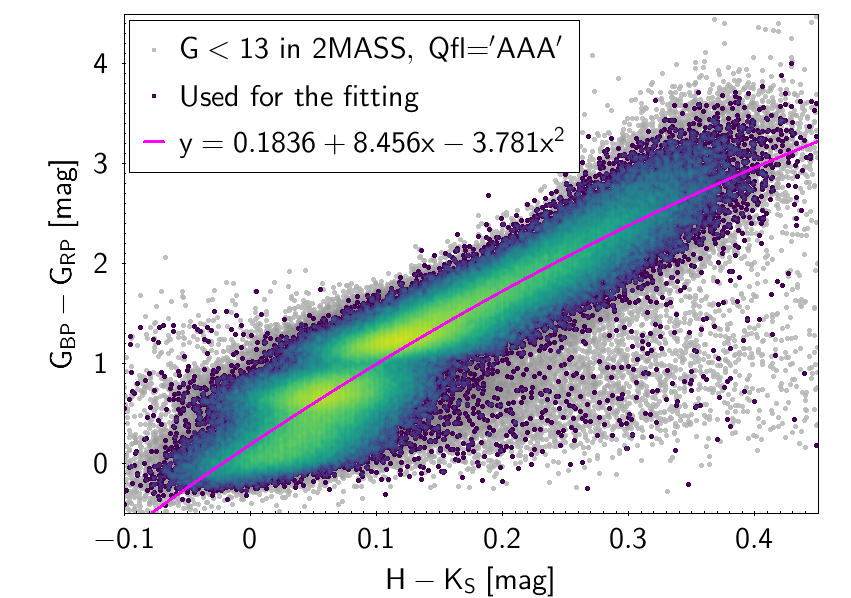
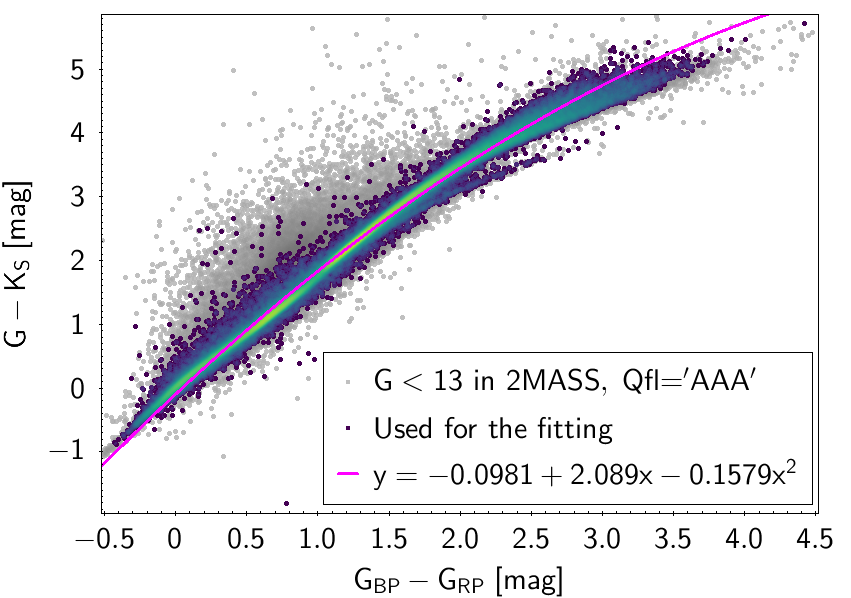
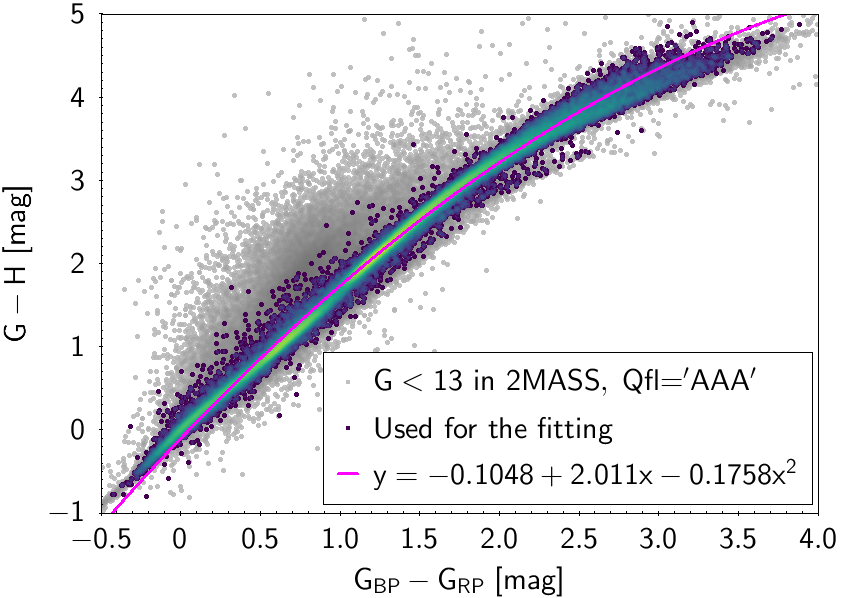
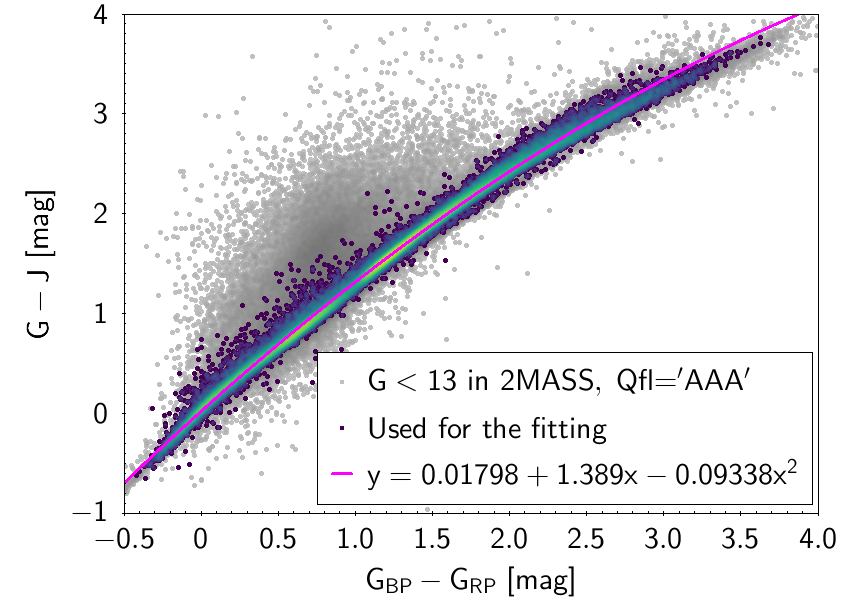
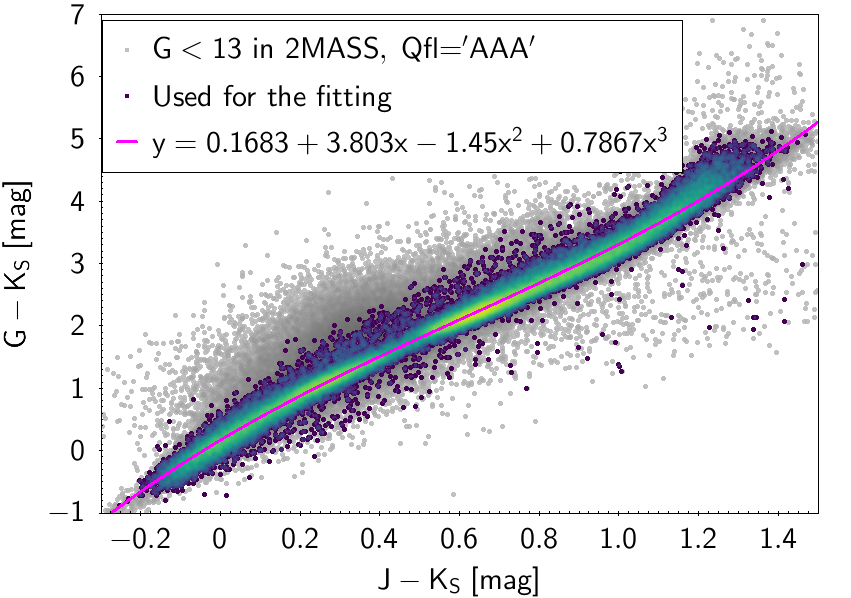
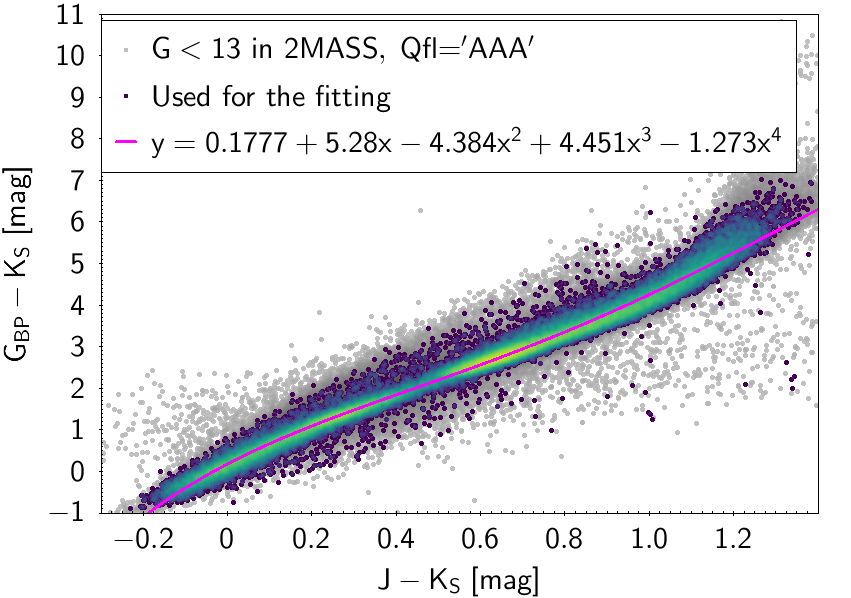
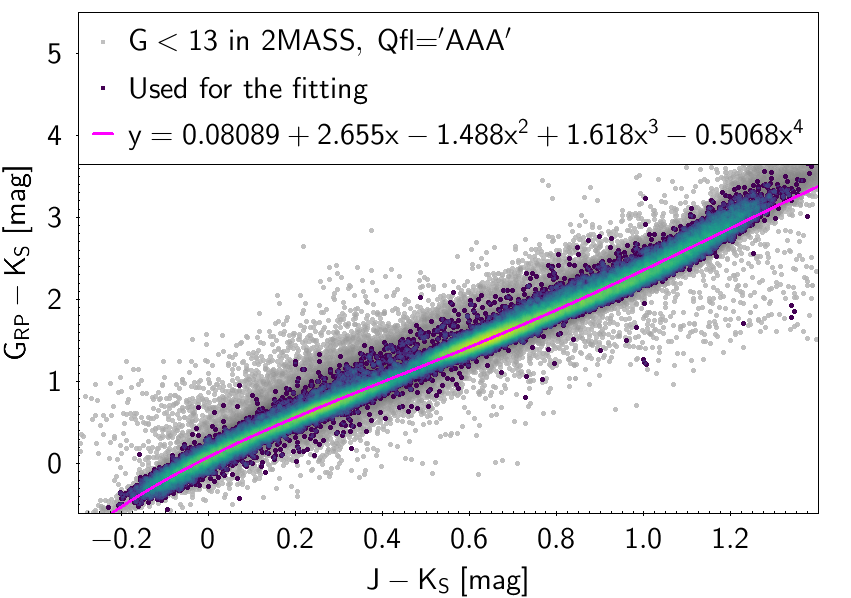
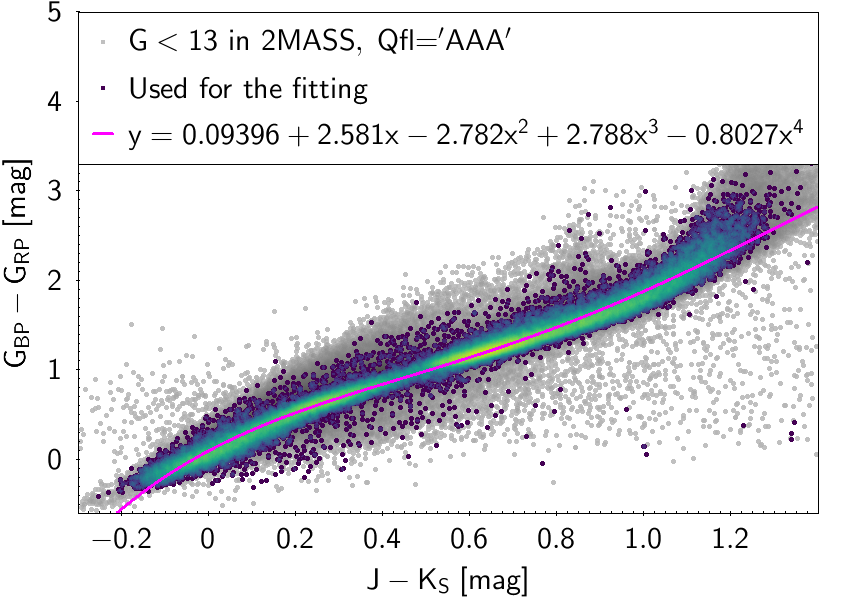
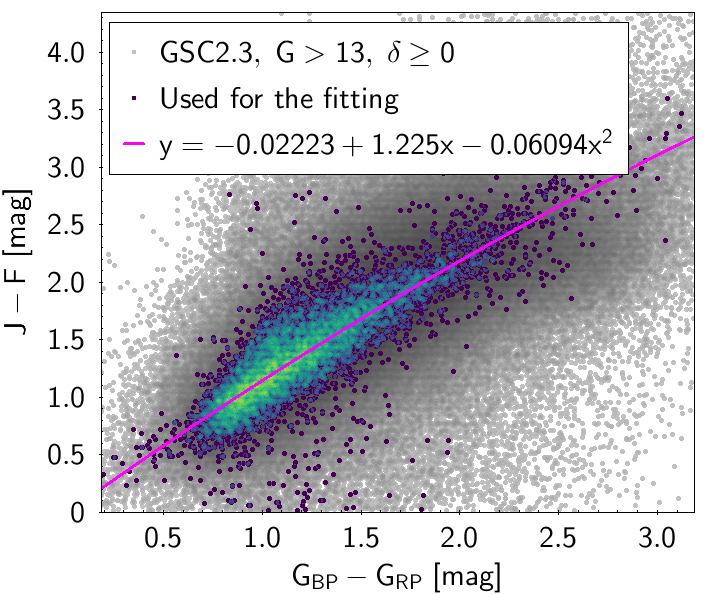
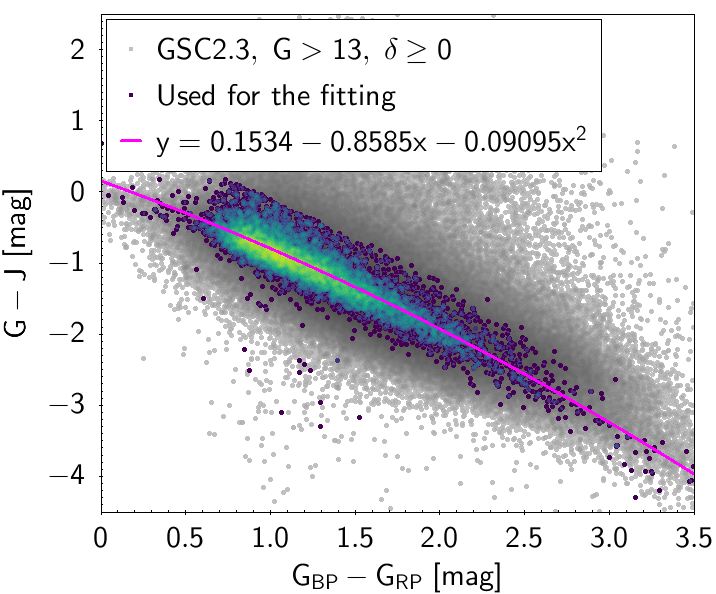
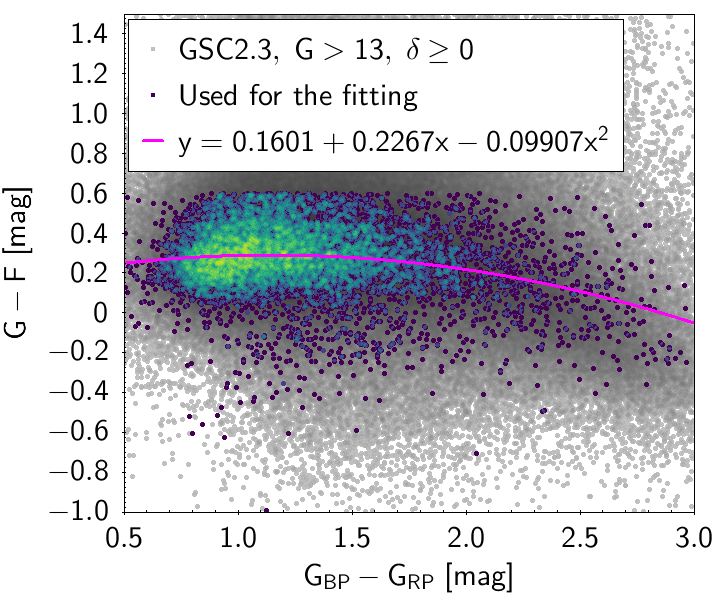
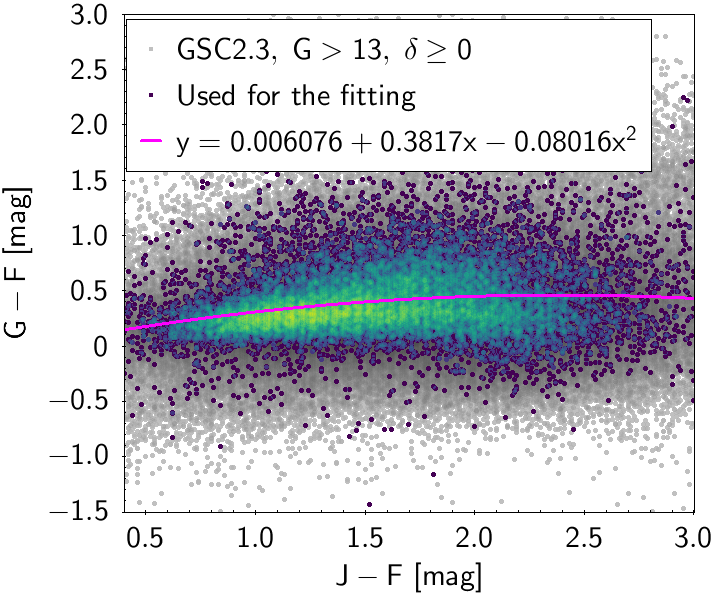
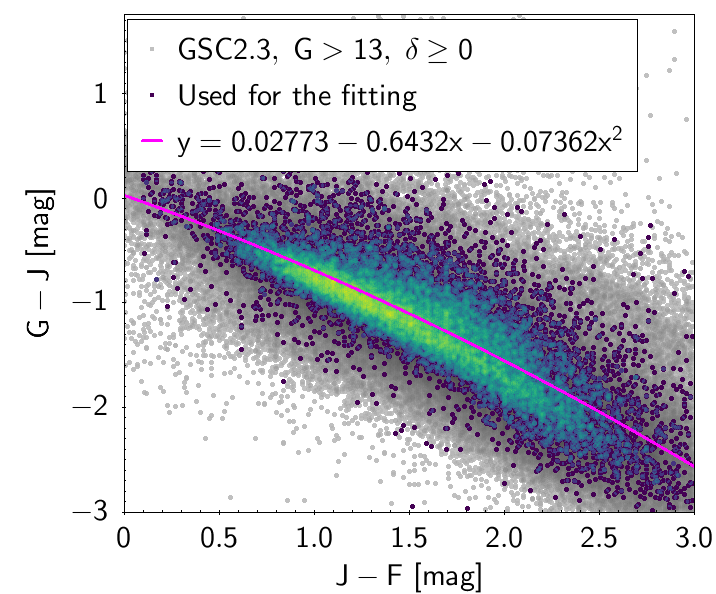
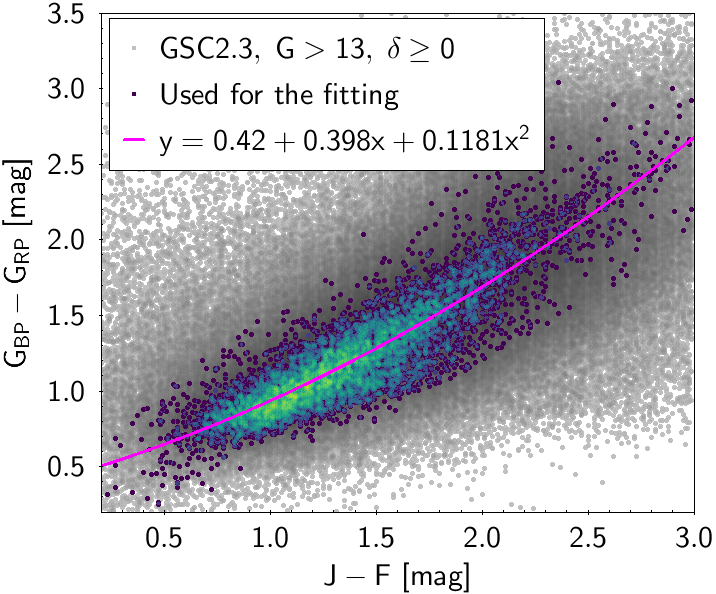
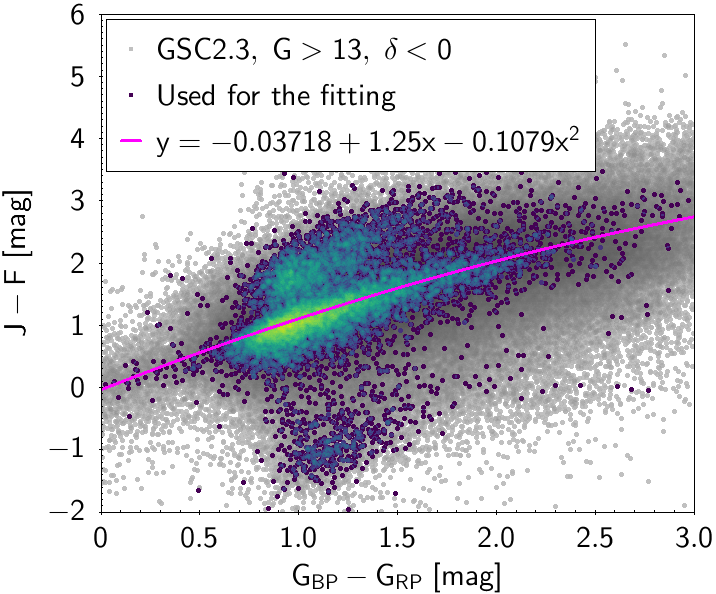
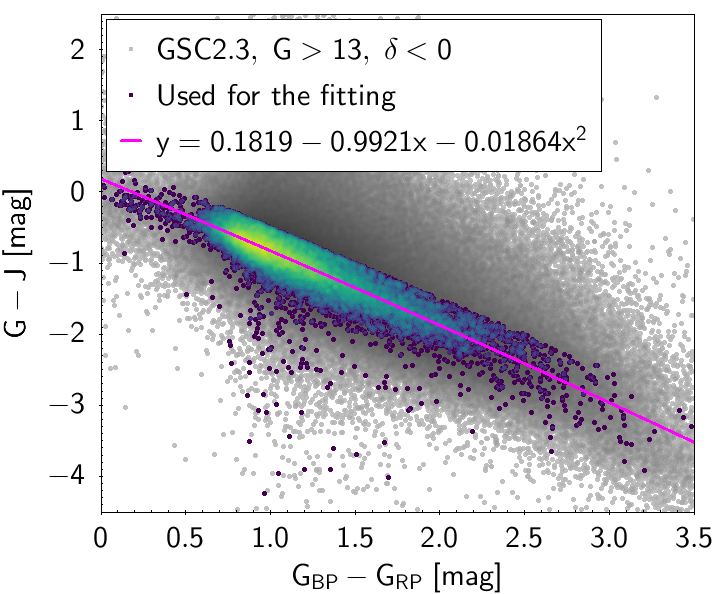
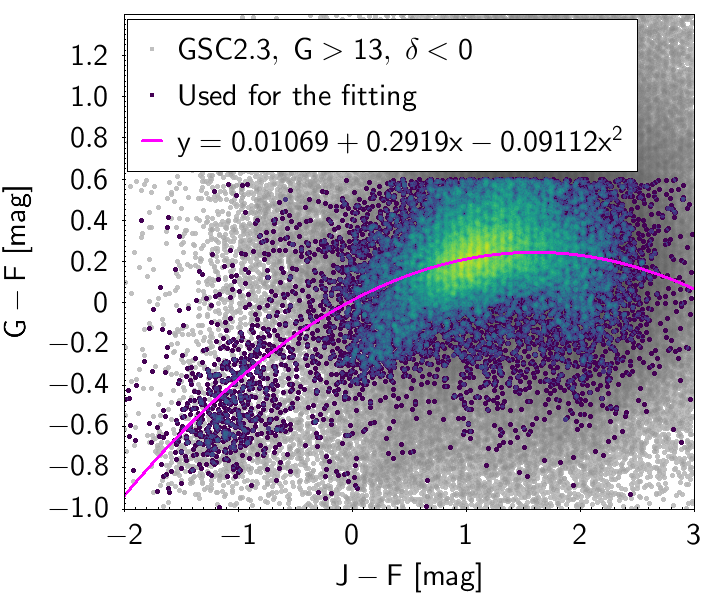
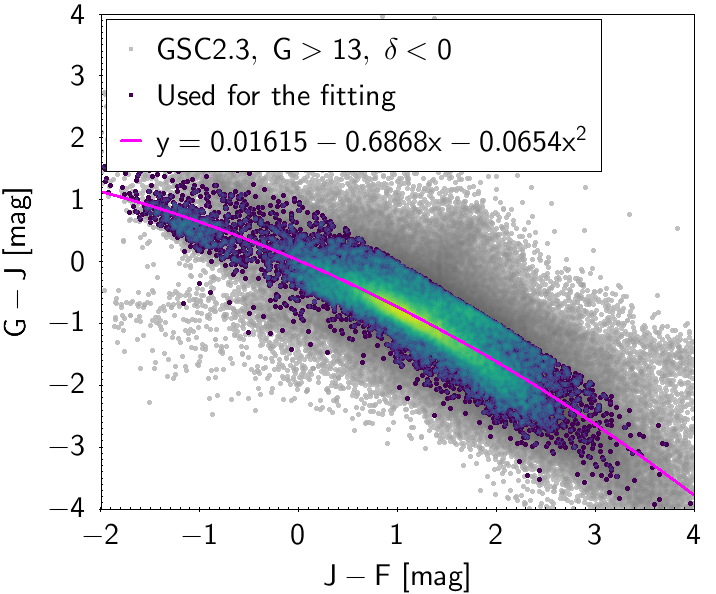
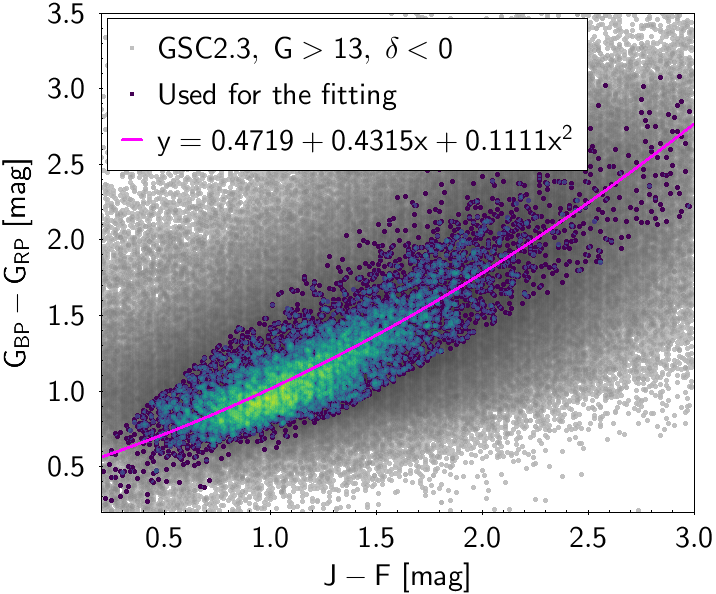
The polynomial coefficients obtained with the resulting sources are listed in Table 5.8 and Table 5.9. The validity of the relationships derived from these fittings is, of course, only applicable within the colour intervals used to perform the fittings (see Table 5.10). The photometric relationships derived between Gaia and Hipparcos, Tycho-2, SDSS12, Johnson-Cousins, 2MASS and GSC2.3 can be seen in Figures 5.34 to 5.43. The relationships presented here were obtained using preliminary data. Thus, some sources used here for the fitting might have been filtered out in the final production.
The purpose of these relationships is to provide a tool applicable to as wide as possible a population of stars, in order to obtain a raw estimation of their photometry when transforming from one system to another. There are cases in which different populations (particularly M type giants and dwarfs) show different behaviours in the colour-colour diagram. In these cases a single fitting was chosen, namely the one reproducing the most populated group for which the validity of the relationship holds over the widest colour range (M giants in this case). Thus, for many relationships shown here the extension to red colours is only valid for M giants and not for M dwarfs.
| Hipparcos filtering | ||
| , | ||
| , , , , | 89 460 sources | |
| , , , | 98 910 sources | |
| , , , | 97 800 sources | |
| , , , | 97 098 sources | |
| , , , | 97 534 sources | |
| , , , | 96 771 sources | |
| , | ||
| Tycho-2 filtering | ||
| , | ||
| , , | 374 697 sources | |
| , | ||
| , , , | 569 238 sources | |
| , , , | 393 188 sources | |
| , , | 375 086 sources | |
| , , | 371 974 sources | |
| , , , | 370 974 sources | |
| SDSS12 filtering | ||
| mag, , cl (stars), mag | ||
| , mag, | 213 563 sources | |
| 208 282 sources | ||
| , , mag, mag | ||
| , mag, , | 213 497 sources | |
| , mag | 212 293 sources | |
| , , mag | 209 682 sources | |
| , | ||
| , mag, mag, | 34 903 sources | |
| , mag, mag | 65 207 sources | |
| , mag, , mag | 35 111 sources | |
| , mag, | 38 041 sources | |
| mag, | ||
| mag, | 35 253 sources | |
| , mag | ||
| mag, , mag, | 43 112 sources | |
| mag, , mag, | 33 253 sources | |
| Johnson-Cousins filtering | ||
| No filter | 82 617 sources | |
| 42 503 sources | ||
| 85 869 sources | ||
| No filter | 82 617 sources | |
| No filter | 82 617 sources | |
| 85 875 sources | ||
| No filter | 82 617 sources | |
| 87 362 sources | ||
| No filter | 96 413 sources | |
| 43 384 sources | ||
| No filter | 83 483 sources | |
| 2MASS filtering | ||
| , , ”AAA” | ||
| , and , | 1 697 974 sources | |
| , | ||
| , and , | 1 110 501 sources | |
| , and | 599 005 sources | |
| and , , , | 258 902 sources | |
| , and , | 238 171 sources | |
| , and , | 103 388 sources | |
| , and , | 93 438 sources | |
| , and | 82 491 sources | |
| , and | 72 118 sources | |
| , and | 63 583 sources | |
| , , and | 55 884 sources | |
| GSC2.3 filtering | ||
| , | ||
| and , , , | 7049 sources | |
| and , , , | 13 174 sources | |
| , and , , , | 9537 sources | |
| , and , , , | 25 973 sources | |
| , and , , , | 7921 sources | |
| , and , , , | 11 911 sources | |
| , , , , | 18 453 sources | |
| , , , , | 24 423 sources | |
| , , , , | 18 378 sources | |
| , , , , | 28 208 sources | |
| and , , , , | 6851 sources | |
| and , , , , | 9798 sources | |
| Hipparcos relationships | |||||||
| -0.02392 | -0.4069 | 0.04569 | -0.0452 | 0.02417 | |||
| 0.01546 | -0.4308 | -0.01872 | - | 0.08191 | |||
| -0.02696 | 0.1086 | -0.009148 | 0.004715 | 0.06 | |||
| -0.006437 | -1.194 | 0.09962 | - | 0.1024 | |||
| -0.01612 | 1.274 | -0.08143 | - | 0.082 | |||
| -0.01008 | -0.2309 | -0.1300 | 0.01894 | 0.06066 | |||
| Tycho-2 relationships | |||||||
| -0.01072 | -0.2870 | 0.05807 | -0.06791 | 0.06084 | |||
| -0.01868 | 0.2682 | -0.1366 | 0.01272 | 0.04127 | |||
| -0.04424 | -1.197 | 0.4948 | -0.1757 | 0.09359 | |||
| 0.02621 | 1.458 | -0.6176 | 0.1817 | 0.06834 | |||
| -0.01077 | -0.0682 | -0.2387 | 0.02342 | - | - | 0.05350 | |
| -0.004288 | -0.8547 | 0.1244 | -0.9085 | 0.4843 | -0.06814 | 0.07063 | |
| SDSS12 relationships | |||||||
| -0.072 | 0.5872 | -0.1021 | 0.04795 | -0.007538 | 0.1069 | ||
| -0.1064 | -0.4964 | -0.09339 | 0.004444 | 0.0872 | |||
| 0.06213 | -0.2059 | -0.06478 | 0.007264 | 0.02944 | |||
| -0.3306 | -0.9847 | -0.02874 | 0.002112 | 0.04958 | |||
| 0.3971 | 0.777 | -0.04164 | 0.008237 | 0.03846 | |||
| -0.01664 | 0.2662 | -0.649 | 0.08227 | 0.123 | |||
| -0.01066 | 1.298 | -0.7595 | 0.1492 | 0.07112 | |||
| -0.0226 | 1.914 | -0.78284 | 0.14408 | 0.12349 | |||
| -0.09837 | 0.08592 | 0.1907 | -0.1701 | 0.02263 | 0.03776 | ||
| -0.293 | 0.6404 | -0.09609 | -0.002104 | 0.04092 | |||
| 0.2199 | -0.6365 | -0.1548 | 0.0064 | 0.0745 | |||
| -0.4619 | 0.8992 | -0.08271 | 0.005029 | 0.041161 | |||
| Johnson-Cousins relationships | |||||||
| -0.01597 | -0.02809 | -0.2483 | 0.03656 | -0.002939 | 0.0272 | ||
| -0.0143 | 0.3564 | -0.1332 | 0.01212 | 0.0371 | |||
| 0.01868 | -0.9028 | -0.005321 | -0.004186 | 0.03784 | |||
| -0.03298 | 1.259 | -0.1279 | 0.01631 | 0.04459 | |||
| -0.03088 | -0.04653 | -0.8794 | 0.1733 | 0.0352 | |||
| 0.06483 | 1.575 | -0.7815 | 0.5707 | -0.176 | 0.01916 | 0.0659 | |
| -0.04749 | -0.0124 | -0.2901 | 0.02008 | 0.04772 | |||
| 0.01448 | -0.6874 | -0.3604 | 0.06718 | -0.006061 | 0.0633 | ||
| -0.02275 | 0.3961 | -0.1243 | -0.01396 | 0.003775 | 0.03167 | ||
| -0.02704 | 0.01424 | -0.2156 | 0.01426 | 0.03017 | |||
| 0.01753 | 0.76 | -0.0991 | 0.03765 | ||||
| 2MASS relationships | |||||||
| 0.5594 | 11.09 | 3.040 | 0.3743 | ||||
| 0.5922 | 15.36 | 1.691 | 0.499 | ||||
| 0.1882 | 10.3 | -3.976 | 0.2956 | ||||
| 0.1836 | 8.456 | -3.781 | 0.2361 | ||||
| -0.0981 | 2.089 | -0.1579 | 0.08553 | ||||
| -0.1048 | 2.011 | -0.1758 | 0.07805 | ||||
| 0.01798 | 1.389 | -0.09338 | 0.04762 | ||||
| 0.1777 | 5.28 | -4.384 | 4.451 | -1.273 | 0.174 | ||
| 0.08089 | 2.655 | -1.488 | 1.618 | -0.5068 | 0.07997 | ||
| 0.09396 | 2.581 | -2.782 | 2.788 | -0.8027 | 0.09668 | ||
| 0.1683 | 3.803 | -1.45 | 0.7867 | 0.1309 | |||
| GSC2.3 relationships | |||||||
| () | -0.02223 | 1.225 | -0.06094 | 0.2791 | |||
| () | -0.03718 | 1.25 | -0.1079 | 0.6247 | |||
| () | 0.1535 | -0.8585 | -0.09095 | 0.2032 | |||
| () | 0.1819 | -0.9921 | -0.01864 | 0.1857 | |||
| () | 0.1601 | 0.2267 | -0.09907 | 0.1652 | |||
| () | 0.003457 | 0.3588 | -0.1429 | 0.2118 | |||
| () | 0.006076 | 0.3817 | -0.08016 | 0.292 | |||
| () | 0.01069 | 0.2919 | -0.09112 | 0.1999 | |||
| () | 0.02773 | -0.6432 | -0.07362 | 0.2858 | |||
| () | 0.01615 | -0.6868 | -0.0654 | 0.2697 | |||
| () | 0.42 | 0.398 | 0.1181 | 0.1658 | |||
| () | 0.4719 | 0.4315 | 0.1111 | 0.1775 | |||
| Hipparcos relationships | Tycho-2 relationships | ||
| SDSS12 relationships | Johnson-Cousins relationships | ||
| GSC2.3 relationships | 2MASS relationships | ||
| , | |||
| , | |||
| , | |||
| , | |||
| , | |||
| , | |||
| , | |||
| , | |||
| , | |||
| , | |||
| , | |||
| , | |||
| is only valid for M giants when | is only valid for M giants when . | ||
| is only valid for M giants when . | is only valid for M giants when . | ||
| is only valid for M giants when . | is only valid for M giants when . | ||
| is only valid for M giants when . | is only valid for M giants when . | ||
| is only valid for M giants when . | is only valid for M giants when . | ||
| is only valid for M giants when . | |||
