14.5.3 Astrophysical Parameters
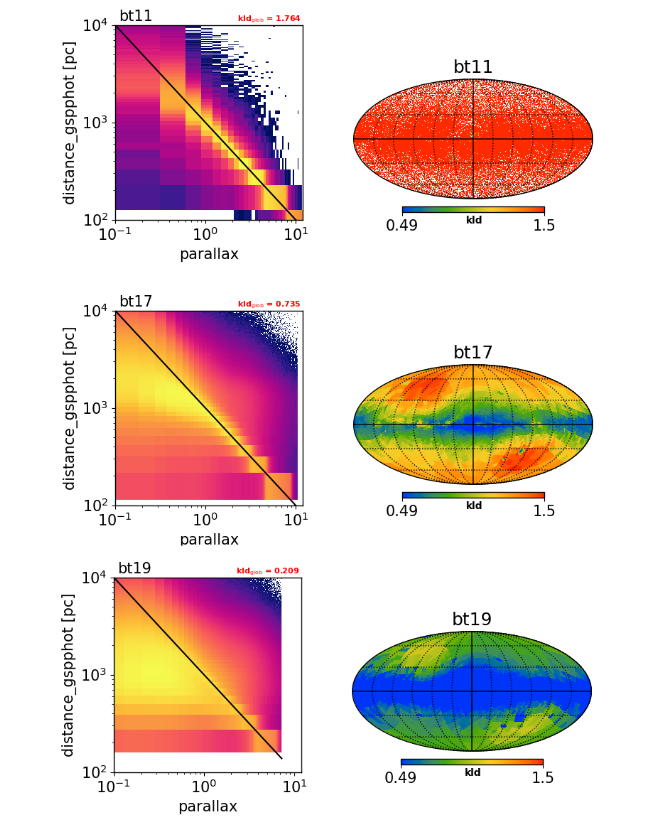
Distances: The global distribution of GSP-Phot distances against parallax is shown in Figure 14.66, where we consider three magnitude-limited subsets, namely, (bt11), (bt17), and (bt19). A large fraction of sources follow the inverse parallax curve (overplotted in black), particularly for the brightest (bt11) subset. We measure the clustering in this space using the Kullback-Leibler divergence. The KLD decreases from bt11 (1.76) to bt19 (0.21), which reflects the increased scatter in the distribution for the fainter subsets. Figure 14.66 also shows the sky distribution of the KLD for GSP-Phot distances against parallax.
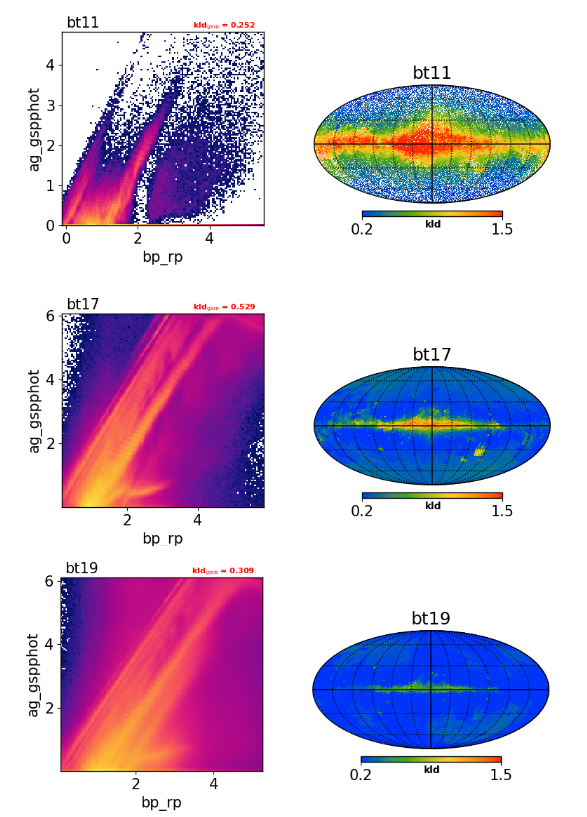
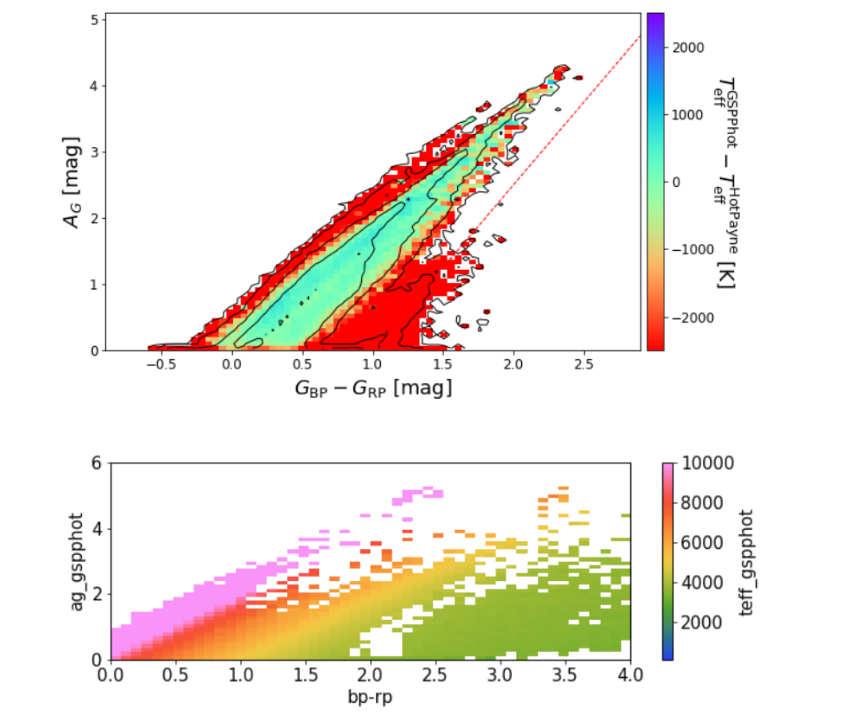
Extinction: In Figure 14.67, plotted is the absorption, ag_gspphot against colour for the three subsets (bt11, bt17, bt19) without spatial selection. Colour is expected to correlate with extinction, but we also see several parallel tracks offset with respect to each other in colour. Some of these extend out to very high extinction. This separation is seen most strongly in the brightest set, particularly starting at and . In Figure 14.68(lower panel), we plot the same but colour coded by from GSP-Phot. The two most prominent tracks seem to correspond to giants and hot stars. This could suggest that the pipeline is able to predict the extinction for different populations, and that the intrinsically bright stars are tracing out large distances. On the other hand, the temperature-extinction degeneracy, reported with subsets in Fabricius et al. (2021), is also contributing in the same region. So, there is a ratio of genuinely hot stars with genuinely high extinction, to those with spurious temperatures and extinction. As a check for this, Figure 14.68(upper panel), compares the temperatures for hot stars from the LAMOST-hot pipeline to those from GSP-Phot. In general, a large fraction of sources here have low residuals but there are still outliers present which are linked to spurious extinction.