14.3.4 magnitudes
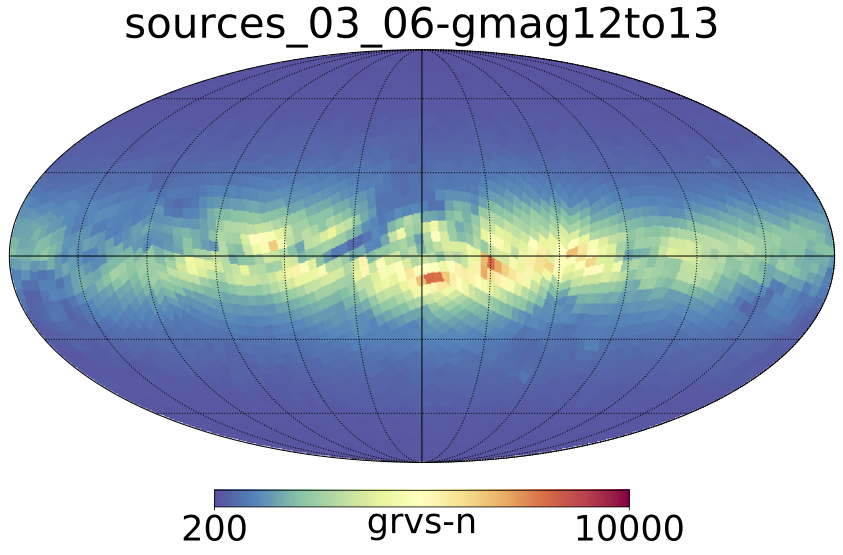
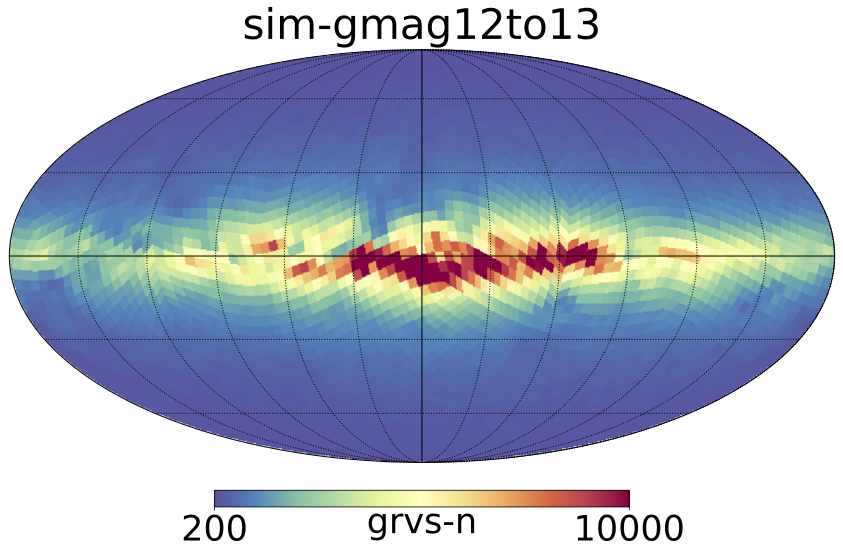
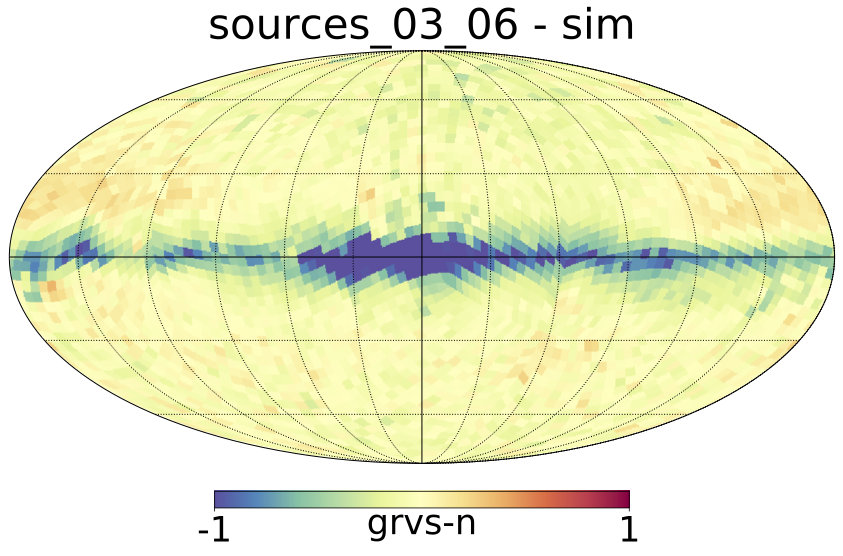
Figure 14.44 shows the number of stars having a determination in Galactic sky maps, in to 13 magnitude range, for DR3 (left), GOG20 (middle), and their relative difference (DR3-GOG20)/DR3 (right). The agreement is very good, except in the bulge and Galactic plane with a strong excess of simulated stars. It can be due either to extinction model used or to incompleteness in the data.
 |
 |
 |
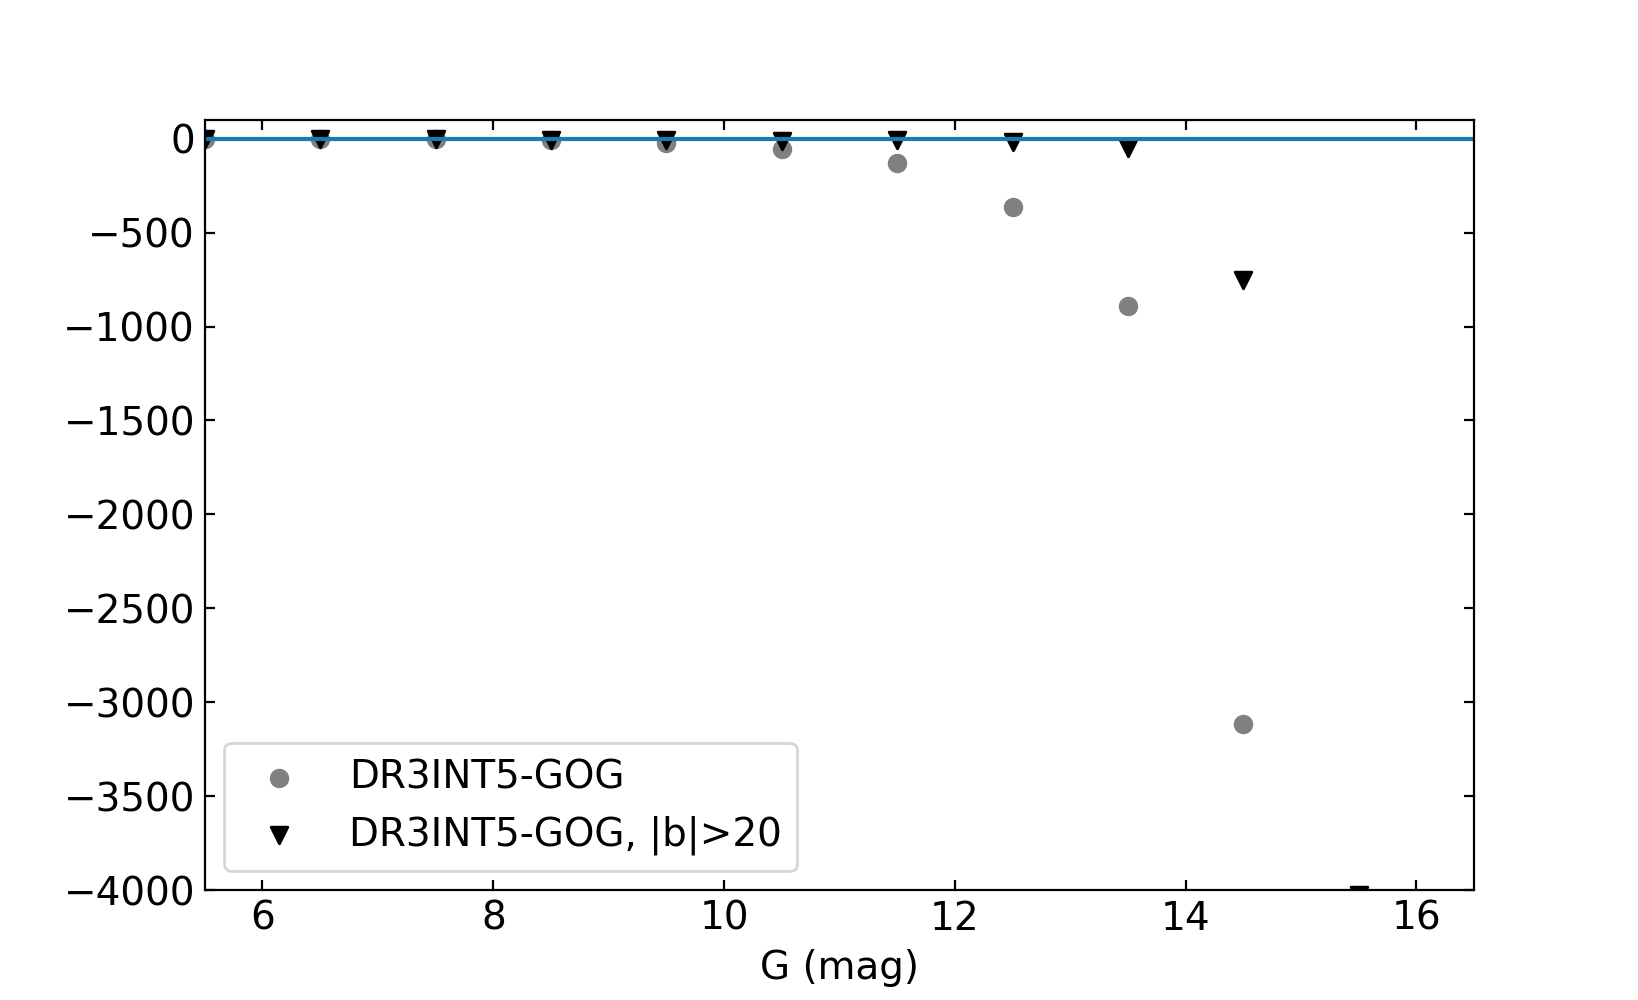
To check whether the discrepancy can be due to incompleteness in the data, we consider the counts as a function of magnitude, over the whole sky, including or excluding the Galactic plane. The difference DR3-GOG20 is shown in Figure 14.45, as a function of magnitude. It appears that the completeness for measurements is still high at outside of the Galactic plane (black triangles), and at fainter magnitudes the star counts start to drop from expected. However in the Galactic plane the data start to be incomplete already at , probably due to crowding. As seen in the sky maps, it is well probable that in the bulge region the completeness limit is even at lower magnitudes (and explain what we see in top row of Figure 14.44), as the crowding can be severe.
Summary of the results:
-
•
The completeness for measurements is still high at outside of the Galactic plane.
-
•
In the Galactic plane the data start to be incomplete at , probably due to crowding.