1.3.3 Spacecraft status
Author(s): Jos de Bruijne, Gonzalo Gracia-Abril, Asier Abreu, Neil Cheek, Cian Crowley, Claus Fabricius, Juanma Fleitas, Alex Hutton, Alcione Mora, Hassan Siddiqui
Major anomalies and special operations
For the time interval covering Gaia DR2, the spacecraft subsystem configuration is composed of the nominal units on the so-called A-chain, with the exception of the Micro-Propulsion Subsystem (MPS). The latter was switched to the redundant B-chain in a spacecraft-safe-mode recovery. This safe mode was triggered by a spurious performance change of MPS Thruster 3 on the A-chain on 17 July 2014 (before the start of the nominal mission). After testing of both MPS chains (which both performed nominally), the decision was made to permanently use the B-chain. See Gaia Collaboration et al. (2016) for more details.
The Gaia spacecraft suffered several ’normal’ anomalies:
-
•
The phased-array antenna (PAA) was switched off autonomously twice, on 16 December 2014 (OBMT 1653.9) and on 27 January 2015 (OBMT 1821.0), and was recovered successfully on both occasions. Both occurrences led to significant temperature excursions of the payload which affected the basic angle in particular.
-
•
The PDHU memory controller was switched off autonomously three times, on 5 April 2015 (OBMT 2094.0), on 29 April 2015 (OBMT 2192.3), and on 29 November 2015 (OBMT 3045.1), and was recovered successfully on all occasions. Some science data was lost on all occasions.
-
•
On 29 October 2015 (OBMT 2922.1), the attitude control system autonomously switched over from using Star Tracker 1 (STR-1) to using Star Tracker 2 (STR-2). Recovery took place on the same day.
Numerous Video Processing Unit (VPU) resets have been experienced during the early part of the mission. The thermal effect of having the associated row of CCDs automatically switched off was mitigated to a large extent with the introduction (on 18 September 2014) of an automatic recovery action on-board. Since the deployment of VPU application software (ASW) version 2.8 in the period 24–28 April 2015 on the seven VPUs, no further VPU resets have occurred.
During December 2014, the Mission Operations Centre (MOC; Section 1.1.5) introduced open-loop ground automation (i.e., periods during which Gaia transmits science data to the ground stations without any intervention from MOC staff) as well as extra ground-station bookings to allow for increased science-data down-link. The science-data return to ground was thereby increased along with the minimisation of data latency for the photometric and Solar-system science-alert projects.
A Lunar transit, with 0.4% of the Sun’s disk obscured, occurred on 11 November 2014 (OBMT 1515). The event was visible in multiple subsystems on the spacecraft (i.e., temperatures, MPS reaction to Solar radiation pressure, etc.). Similar, but larger events took place on 6 November 2015 (5.0% obscuration, OBMT 2954), 27 April 2016 (6.0% obscuration, OBMT 3646), and 1 May 2016 (5.5% obscuration, OBMT 3663).
On 1 July 2015 (OBMT 2440.6), a leap second was introduced in the various mission planning and control software products.
The maintenance of the desired orbit around the L2 Lagrange point requires dedicated spacecraft manoeuvres, commonly referred to as Station-Keeping Manoeuvres (SKMs). Table 1.5 lists the 13 manoeuvres that have been executed during the time interval covering Gaia DR2.
| Manoeuvre number | Date | OBMT |
| 9 | 25-07-2014 | 1078.1 |
| 10 | 21-08-2014 | 1185.2 |
| 11 | 09-09-2014 | 1261.4 |
| 12 | 09-10-2014 | 1380.8 |
| 13 | 07-11-2014 | 1498.0 |
| 14 | 04-12-2014 | 1606.5 |
| 15 | 14-01-2015 | 1770.0 |
| 16 | 06-04-2015 | 2099.2 |
| 17 | 13-05-2015 | 2246.6 |
| 18 | 15-07-2015 | 2499.5 |
| 19 | 16-09-2015 | 2751.3 |
| 20 | 20-01-2016 | 3254.1 |
| 21 | 01-04-2016 | 3542.1 |
Payload decontamination operations were performed on 23 September 2014 (OBMT 1317.3) and 3 June 2015 (OBMT 2330.8), both scheduled after ice build-up on the optics had progressed beyond acceptable levels. For more details, see Section 1.3.3 and Gaia Collaboration et al. (2016).
Following both decontaminations, small movements of the M2 mirrors were performed to improve the focus of the following field-of-view on 24 October 2014 (OBMT 1444.0) and the preceding field-of-view on 3 August 2015 (OBMT 2574.7). For more details, see Section 1.3.3 and Gaia Collaboration et al. (2016).
Table 1.6 summarises the decontamination and refocus operations that have been executed during the time interval covering Gaia DR2.
| Run | Date | OBMT | Event |
| 4 | 23-09-2014 | 1317.3 | Decontamination |
| 24-10-2014 | 1444.0 | Refocus following field-of-view | |
| 5 | 03-06-2015 | 2330.8 | Decontamination |
| 03-08-2015 | 2574.7 | Refocus preceding field-of-view |
Focal-plane assembly
During the time interval covering Gaia DR2, all elements of the focal plane have been operating correctly and as expected. There have been no major issues with the PEM-CCD couples and all 106 devices are functioning within, or close to, specification with only one device slightly exceeding the readout-noise specification.
Focal-plane temperature
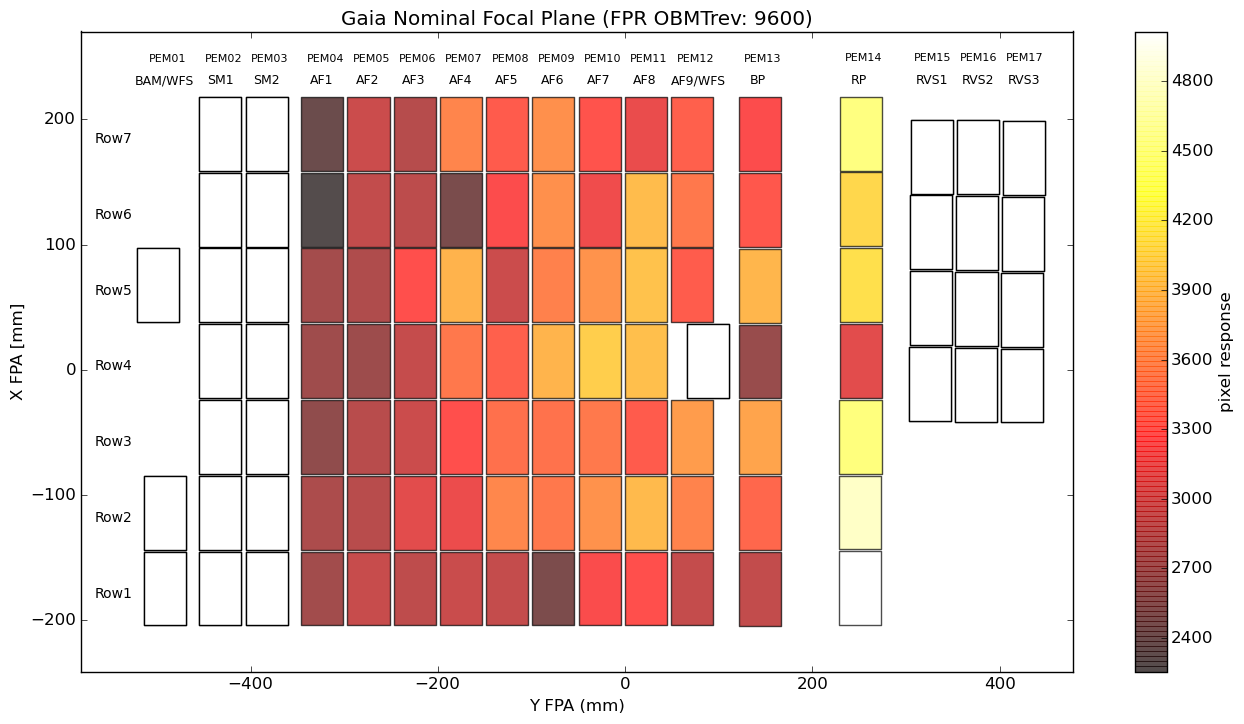
Amongst the many different temperature sensors on-board the satellite, three are placed close to the detector array. They are distributed across the focal plane with one placed near the SM1 CCD on row 1, one placed near the AF5 CCD on row 4, and one placed near the RVS3 CCD on row 5 (see Figure 1.2). Figure 1.7 shows the readings obtained from these three sensors after convolving the data with a one-hour, running-average smoothing kernel. One can immediately note two temperature increases. These correspond to controlled payload heating events which have been carried out in order to decontaminate the telescope mirrors (Section 1.3.3 and Table 1.6).
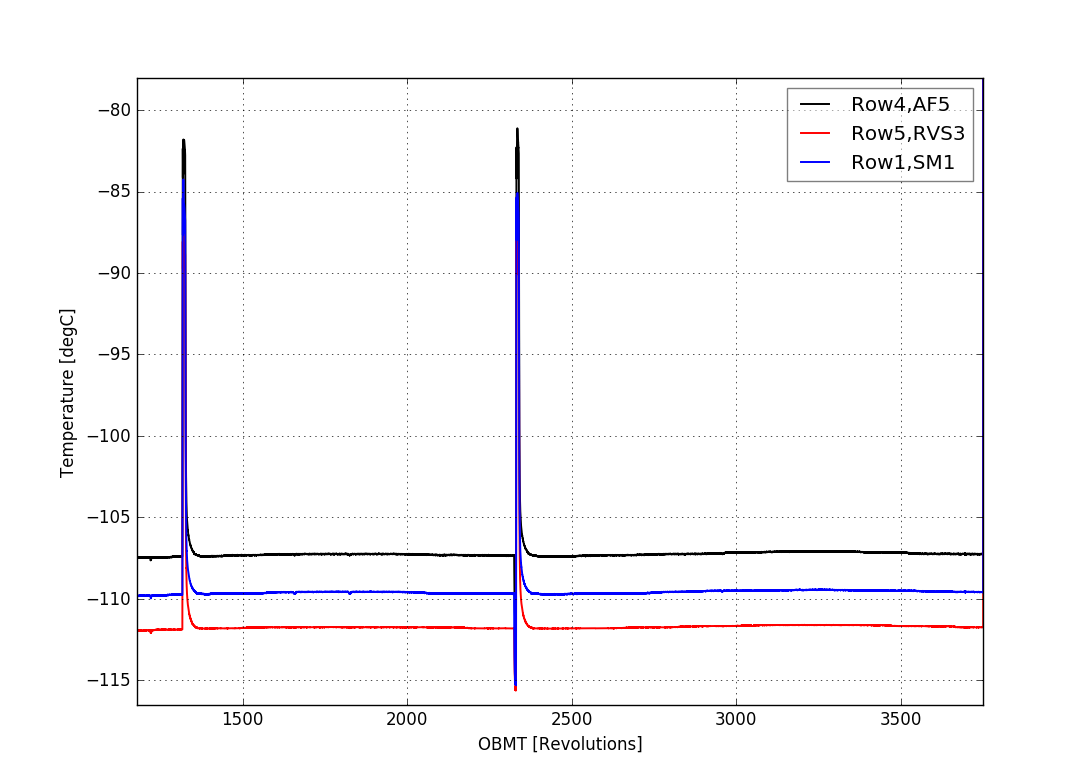
After thermal equilibrium is re-established following each heating event, the focal-plane temperature is extremely stable. Large temperature changes can dramatically affect detector characteristics (such as CTI or gain), so long-term stability is an important aspect of Gaia’s performance. There is a stable gradient of a few degrees from sensor-to-sensor over the focal plane and the operating temperatures of all devices are close to the target value of C. The slow, periodic, long-term evolution of the temperature readings is caused by the variable distance of the spacecraft to the Sun.
Parallel Charge-Transfer Inefficiency
The L2 environment offers many advantages for the operation of astronomical observatories, such as high thermal stability. Due to the large distance of L2 from Earth (1.5 million km), the effect of geomagnetically-trapped charged particles is not a concern. However, it follows that L2 lacks the shielding of the Earth’s magnetosphere and is thus vulnerable to impacts from ionised particles from other sources. Indeed, the L2 radiation environment is dominated by particles from the effectively isotropic cosmic rays and the more directional Solar eruptive events (mostly protons). The cosmic-ray component is expected and is also observed to be rather steady throughout the mission, with the number of impacts expected and observed to vary smoothly and, as expected, anti-correlated with the Solar cycle (see Section 1.3.3). In contrast, the impacts of particles from Earth- / L2-directed Solar events are sporadic with more events expected and observed around the time of Solar maximum.
The most worrying effects of radiation on the Gaia science performances are expected to be due to performance degradations of the detectors over time. The most important effects are due to two main sources: (1) ionising radiation damage, and (2) non-ionising radiation damage. The effects of ionising radiation on the detectors are cumulative and occur when charge builds up on, possibly resulting in threshold shifts, charge leakage, etc. A special calibration procedure is periodically run on-board to monitor the accumulation of charge in the oxide layers of the CCD detectors; this is further described in Section 1.3.3.
The non-ionising, lattice-displacement damage to the CCD silicon layers is the biggest radiation threat to the achievement of the Gaia science-performance goals. The generation of new energy levels between the valence and conduction bands in the silicon produces crystal defect sites that trap electrons from traversing charge packets, to be released from the trap at some later moment in time. This results in a smearing of the images that are readout from the CCD that cannot be calibrated in a simple manner (see Short et al. 2013). Indeed, Charge-Transfer Inefficiency (CTI) of the CCDs was identified as a potential threat to the mission at an early stage. CTI in the transfer through the serial (readout) register is discussed in Section 1.3.3; however, Gaia is most sensitive to CTI in the image area (in the along-scan direction).
The most important hardware mitigation for along-scan CTI effects is the periodic injection of charge into the devices. This is carried out every 2 seconds for AF1 and AF2–9 devices and every 5 seconds for BP and RP devices. This scheme sees four contiguous lines of charge injected into the CCD and clocked out through the TDI lines. This serves to periodically fill trapping sites with injected electrons, thus preventing the trapping of photo-electrons from astronomical sources. Indeed, for those traps with characteristic release time scales on the order of seconds, these traps will be kept filled over the period of the charge injection, thus keeping them nearly permanently filled and thus rendered effectively inactive. The regular presence of the injection features in the data stream also means that the CTI effects on the injections can be used to monitor the evolution of the trapping and release effects on the detector over time. One such diagnostic is what is known as the First-Pixel Response (FPR) and is measured by computing the number of electrons removed from the first injected pixel line through trapping (in practise, we also need to account for trapping from subsequent lines).
Shown in Figure 1.8 are the FPR results (displayed as fractional charge loss) averaged over all AF2–9 CCDs. The steady increase in CTI is apparent and is thought to be due to the low-energy tail of the Galactic cosmic-ray impacts. The two step increases are correlated with two, Earth-directed Solar-proton events.
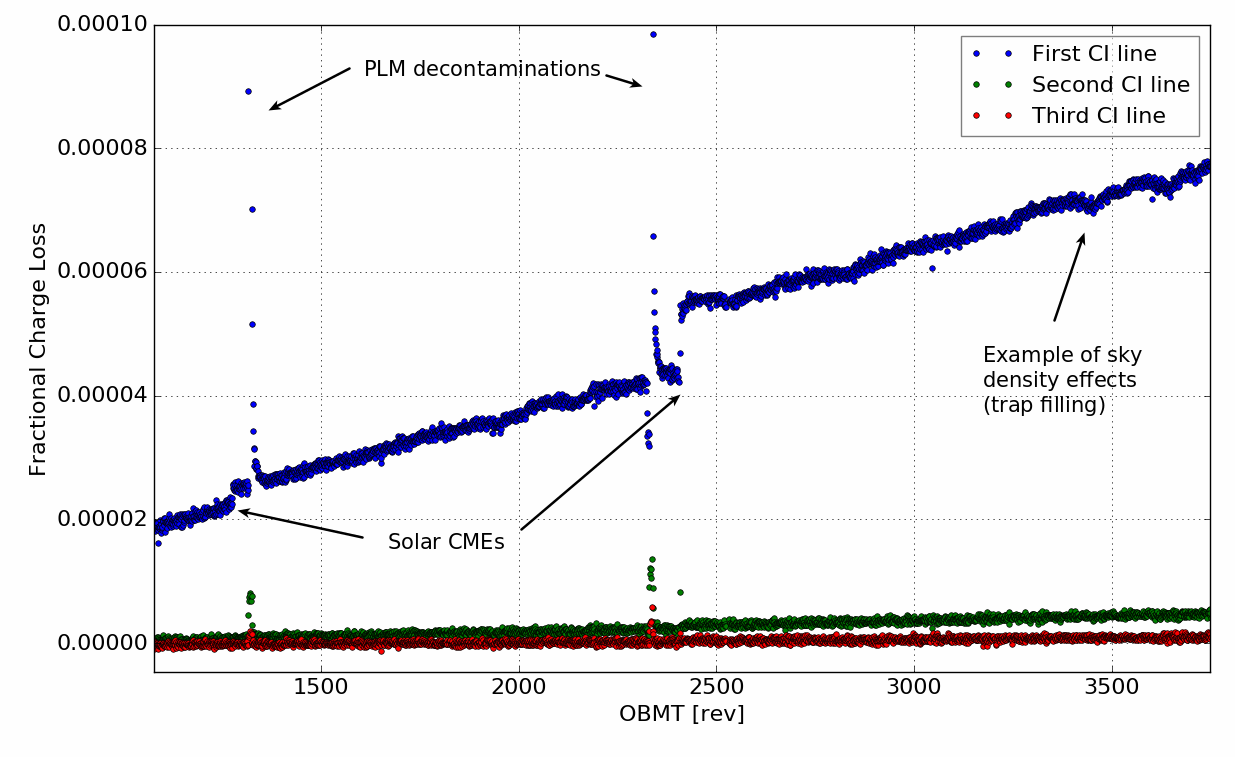
The almost linear degradation in the transfer efficiency is noticeable and rather similar for all devices. However, the effects of the Solar-proton events are heavily affected by the differential shielding across the focal plane. Therefore, the net CTI observed in each device is a convolution of the (low-level) initial pre-flight CTI due to traps generated during the manufacturing process, the effect of the cosmic-ray impacts, and the effects of the Solar protons. Shown in Figure 1.9 is the result of the extrapolation of in-flight FPR measurements to the nominal, end-of-mission time for Gaia. The higher CTI FPR values for the RP CCDs are apparent and caused by the higher inherent along-scan transfer inefficiencies for these devices that were already measured pre-launch. Also apparent in this figure is a pattern showing higher FPR values towards the centre of the focal plane, which is a result of the shielding. However, the most important result that can be derived from these data is that the now-predicted end-of-mission CTI values are approximately an order of magnitude less than was feared before launch.
Furthermore, offline studies of the image shapes as a function of the time since charge injection have confirmed that the effects of CTI in the along-scan direction are low. A full analysis of the effects of CTI on the science data will become possible with time as more calibrations are carried out in the iterative data processing. Note that no periodic charge injection occurs in the SM and RVS devices, however. The CTI in the along-scan direction in these (and the other) devices is monitored through special calibration activities that take place every three to four months. The results of this monitoring are consistent with those presented here for the AF, BP, and RP CCDs. See Crowley et al. (2016) for an in-depth discussion of the effects of the radiation environment on the Gaia detectors over the first two years of the mission.
Serial Charge-Transfer Inefficiency
A common technique for monitoring the CTI in the serial (readout) registers of CCDs (sometimes abbreviated to sCTI) is to generate charge in the image area and then monitor any trailing into the post-scan samples (Figure 1.3) after the charge is transferred through the serial register. Since the Gaia VPUs are not capable of generating nominal data packets containing post-scan samples, a special calibration is run periodically where five different levels of charge are injected into each science device (apart from SM devices, where the definition of the CCD operating mode precludes the acquisition of post-scan pixels). At the same time, ’Virtual Objects’ (VOs; Section 1.1.3) are placed over the end of the image area (in order to monitor the injected charge level) and are also used to acquire post-scan pixels. To circumvent the problem where post-scan samples cannot be stored in nominal packets, the VPU SIF functionality (Section 1.1.3) is used to gather the raw data, which is subsequently down-linked in a special data packet with high priority. Since radiation damage has been lower than expected (Section 1.3.3), it is currently sufficient to run this activity with a cadence of somewhere between three to four months.
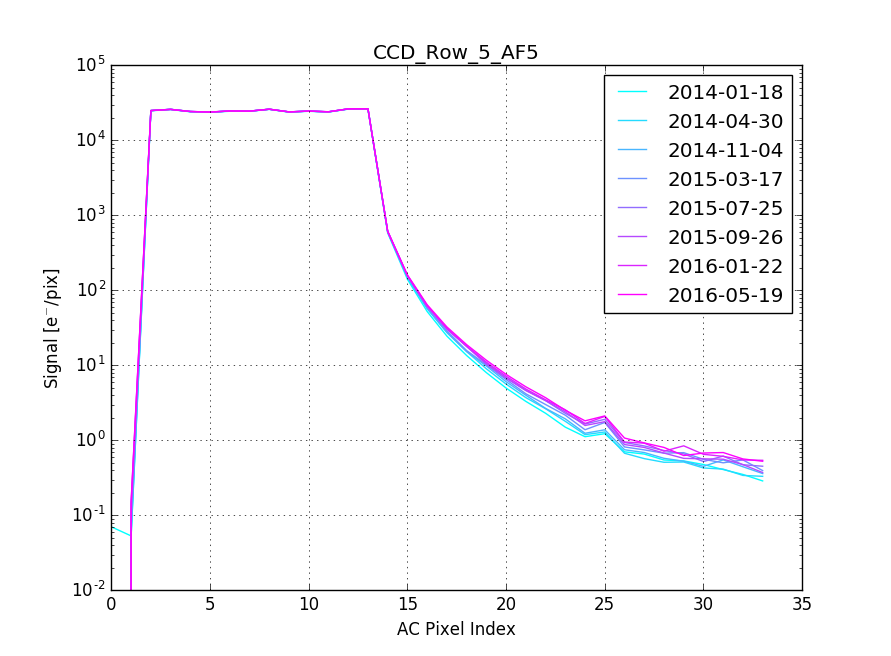
During the time interval of Gaia DR2, there have been six runs of the serial-CTI calibration in-flight (Table 1.7). These runs allow the tracking of the evolution of the CTI in the serial register. However, it is found that the CTI is still dominated by the traps that have been present since device manufacture. Shown in Figure 1.10 are data derived from each run of the activity so far for the AF5 device on CCD row 5, and for the highest injection level. The co-added, high signal-to-noise cuts in the across-scan direction show the two pre-scan samples, followed by image-area samples showing the injected charge, and then the trailing into the post-scan samples due to the release of the injected electrons from traps in the serial register. In Figure 1.11, the very slow evolution of the serial CTI curve from run-to-run is readily apparent.
| Run | Date | OBMT |
| 3 | 04-11-2014 | 1484.6 |
| 4 | 17-03-2015 | 2017.0 |
| 5 | 25-07-2015 | 2536.6 |
| 6 | 26-09-2015 | 2788.6 |
| 7 | 22-01-2016 | 3260.6 |
| 8 | 19-05-2016 | 3732.6 |
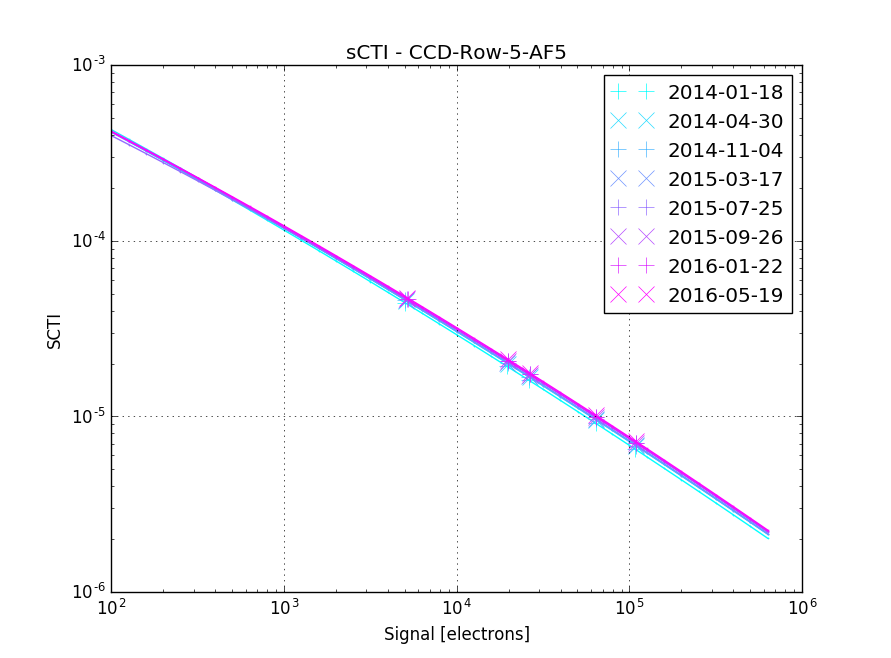
The slow evolution of the serial CTI, i.e. the continued domination by pre-flight, manufacturing traps, is apparent all across the focal plane. In summary, CTI in the serial register is still dominated by the traps inherent to the manufacturing process and the radiation-induced degradation in CTI, whilst clearly measurable, is of the order of a few percent of the pre-flight CTI (–% for SM/AF/BP devices and –% for the thicker, red devices used in RP/RVS (Section 1.1.3), which had much lower native CTI to begin with). So, similar to the situation for the CTI in the along-scan direction (Section 1.3.3), the CTI effects of radiation damage in the serial register are low.
Non-uniformity calibration
As discussed in detail in Section 2.3.5 and in Hambly et al. (2018), the electronic readout of the Gaia CCDs suffers from bias-level (offset) variations within a TDI line, also referred to as (bias) non-uniformity or (offset) instability, which have a non-trivial dependency on the exact readout scheme. Since most CCDs are operated in a windowing mode (Table 1.1), where the exact locations of the windows depend on the sky configuration as well as the continuously-changing superposition of both fields of view (Section 1.1.3), it follows that a continuous reconfiguration of the readout scheme is applied to most devices. There is a model of the offset variation as a function of various readout parameters (Hambly et al. 2018) that needs to be calibrated periodically throughout the mission in order to properly correct these offsets. Some details on the various effects are discussed in Section 2.3.5 and an extensive description of the model as well as its efficacy is given in Hambly et al. (2018); here, we discuss only the status of the special on-board calibration that is carried out to calibrate the model.
During the non-uniformity calibration activity, the VPUs are, one at a time, taken out of operational mode and artificial, ’Virtual Object’ (VO; Section 1.1.3) detections are placed into the VPU algorithms (see Section 1.1.3). These detections result in empty (sky) windows to be readout from each device as the VOs are propagated across the various science CCDs in the row controlled by that VPU. The VO patterns are designed to sample different readout configuration timings and are used to calibrate the offset non-uniformity model (see Hambly et al. 2018 for details). The nominal cadence of each calibration run has settled to be between three to four months and, in the Gaia DR2 time range, the activity has been performed on-board six times (Table 1.8).
| Date | OBMT | Comment |
| 22-10-2014 | 1432.6 | Not used for Gaia DR2 |
| 24-03-2015 | 2045.0 | Backdated to 25-07-2014 (OBMT 1078.4) |
| 26-05-2015 | 2296.6 | Not used for Gaia DR2 |
| 22-09-2015 | 2772.6 | Used from that OBMT onwards |
| 13-01-2016 | 3224.6 | Not used for Gaia DR2 |
| 10-05-2016 | 3696.6 | Used from that OBMT onwards |
CCD cosmetic defects
No CCDs can be manufactured without a (small) number of non-perfect, or defected, pixels. These can be manifest in a number of ways, but typically there will be a number of ’cold’ pixels which are under-responsive in comparison to the surrounding population, and a number of ’hot’ pixels that exhibit elevated signal levels, even in darkness. Due to the TDI operation of the Gaia CCDs (Section 1.1.3), such pixel defects will be smeared out in some form due to the fact that the signal is integrated over all CCD image-area pixels in the column before reaching the serial register (see Figure 1.2 and Figure 1.3 for the adopted CCD nomenclature). Of course, for TDI-gated observations, the effective integration distance is shortened, so it may be that a defect pixel far from the serial register produces an effect in the non-TDI-gated data but not in (all or some of) the TDI-gated data. In addition to these fabrication (native) cosmetics, radiation-induced defects are created which can evolve in-orbit.
For Gaia, apart from the standard need to characterise CCD defects for the processing of the science data, it is also important to take them into account in order to ensure correct operation of the on-board detection (the SM CCDs) and confirmation (the AF1 CCDs) chains (Section 1.1.3): defects and evolution in dark-signal non-uniformity (DSNU) need to be tracked and updated on-board as/if needed. The locations and characteristics of CCD defects have been diagnosed pre-flight and stored in the VPU memories for the on-board processing of the SM, AF1, and RP windows (the RP-window data is used on-board to provide a red magnitude for each object which is used as input when deciding whether an RVS window should be assigned to an object or not; see Section 1.1.3). So far, only one on-board change has been required (and implemented on 16 December 2014, OBMT 1653.0) in order to update the DSNU table for one SM2 CCD (on row 4) which contains a weak (15 ADU), radiation-induced hot column.
When analysing the whole focal plane using the analysis of defect pixel evolution as described in Section 2.3.4, it is found that the number of radiation-induced defects is low. The sensitivity of this analysis to weak defects will increase with time and more detailed statistics will become available with progressing mission duration (for further detail on defect pixel evolution, see Crowley et al. 2016).
Flat-band voltage shift
Radiation-induced generation of electron-hole pairs in the CCDs cause a gradual accumulation over time of positive charge on the CCD-gate oxide layers. The end result is an effective change in the potentials under the gates of each of the CCDs, which is termed a ’flat-band voltage shift’. The operating point of each device has been set to tolerate the maximum expected end-of-mission flat-band voltage shift of V, but the trend over time is being monitored to allow steps to be taken to avoid degradation in the performances of the devices. In principle, any shift can be compensated for by changing the operating voltages of the devices by an appropriate amount. A periodic run of a special calibration activity on-board is used to monitor the evolution.
During this activity, charge-injection data is acquired from every CCD and the potential under the injection drain () is successively increased from a low value of V in order to find the value at which charge stops being injected. This point, the turn-off voltage, corresponds to the point at which the equals the potential under the injection gate. The potential under the gate will evolve with increased charge accumulation in the oxide, but the potential under the drain should remain unaltered since it is connected directly to the silicon. Thus, the change in operating point over time diagnoses the flat-band voltage shift. This activity is being run throughout the mission with a cadence of 12 months; so far, it has been run on-board five times, including two dry-runs of the activity shortly after launch, during commissioning. The last two runs took place in October 2016 and August 2017, i.e., outside the time range applicable to Gaia DR2. Table 1.9 summarises the flat-band-voltage-shift-calibration operations that have been executed during the time interval covering Gaia DR2.
| Run | Date | OBMT |
| 3 | 13-06-2015 | 2368.6 |
The average and standard deviation for the on-ground-measured turn-off voltages for the 106 flight devices is V. A comparison with in-orbit data so far (including runs 4 and 5) shows no clear evidence for a measurable flat-band voltage shift beyond the measurement noise for any one device considered in isolation. However, the mean shift over all devices between the on-ground, pre-launch measurements and the June-2015 on-board measurements is V. Therefore, after extrapolation, it is currently expected that flat-band voltage shifts will not cause detector performance issues before the end of the nominal, five-year mission.
Prompt-particle events
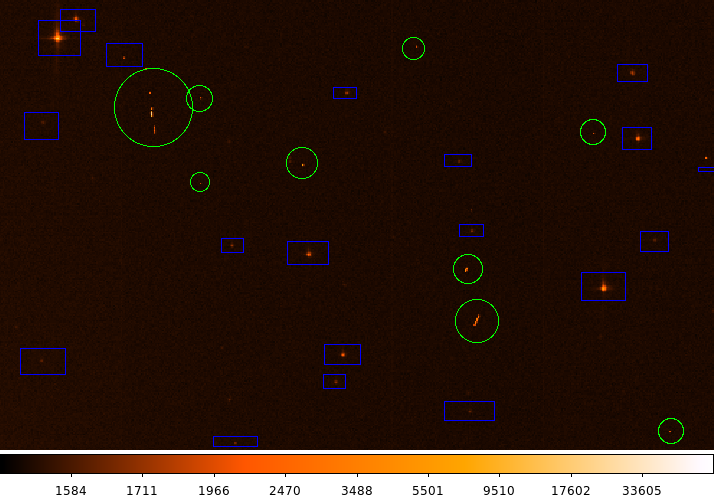
As explained in Section 1.1.3 and in detail in de Bruijne et al. (2015), the object-detection algorithms running on-board Gaia scan the images coming from each Sky-Mapper (SM) CCD in search for local flux maxima. For each local maximum, spatial-frequency filters are applied to the two one-dimensional flux distributions within a so-called working window centred on it. Objects failing to meet star-like PSF criteria (too sharp or too smooth / extended) are rejected. Typically, rejected objects are either bright-star PSF ripples or prompt-particle events (PPEs; i.e., Solar protons, Galactic cosmic rays, etc.). A few example prompt-particle events are shown in Figure 1.12.
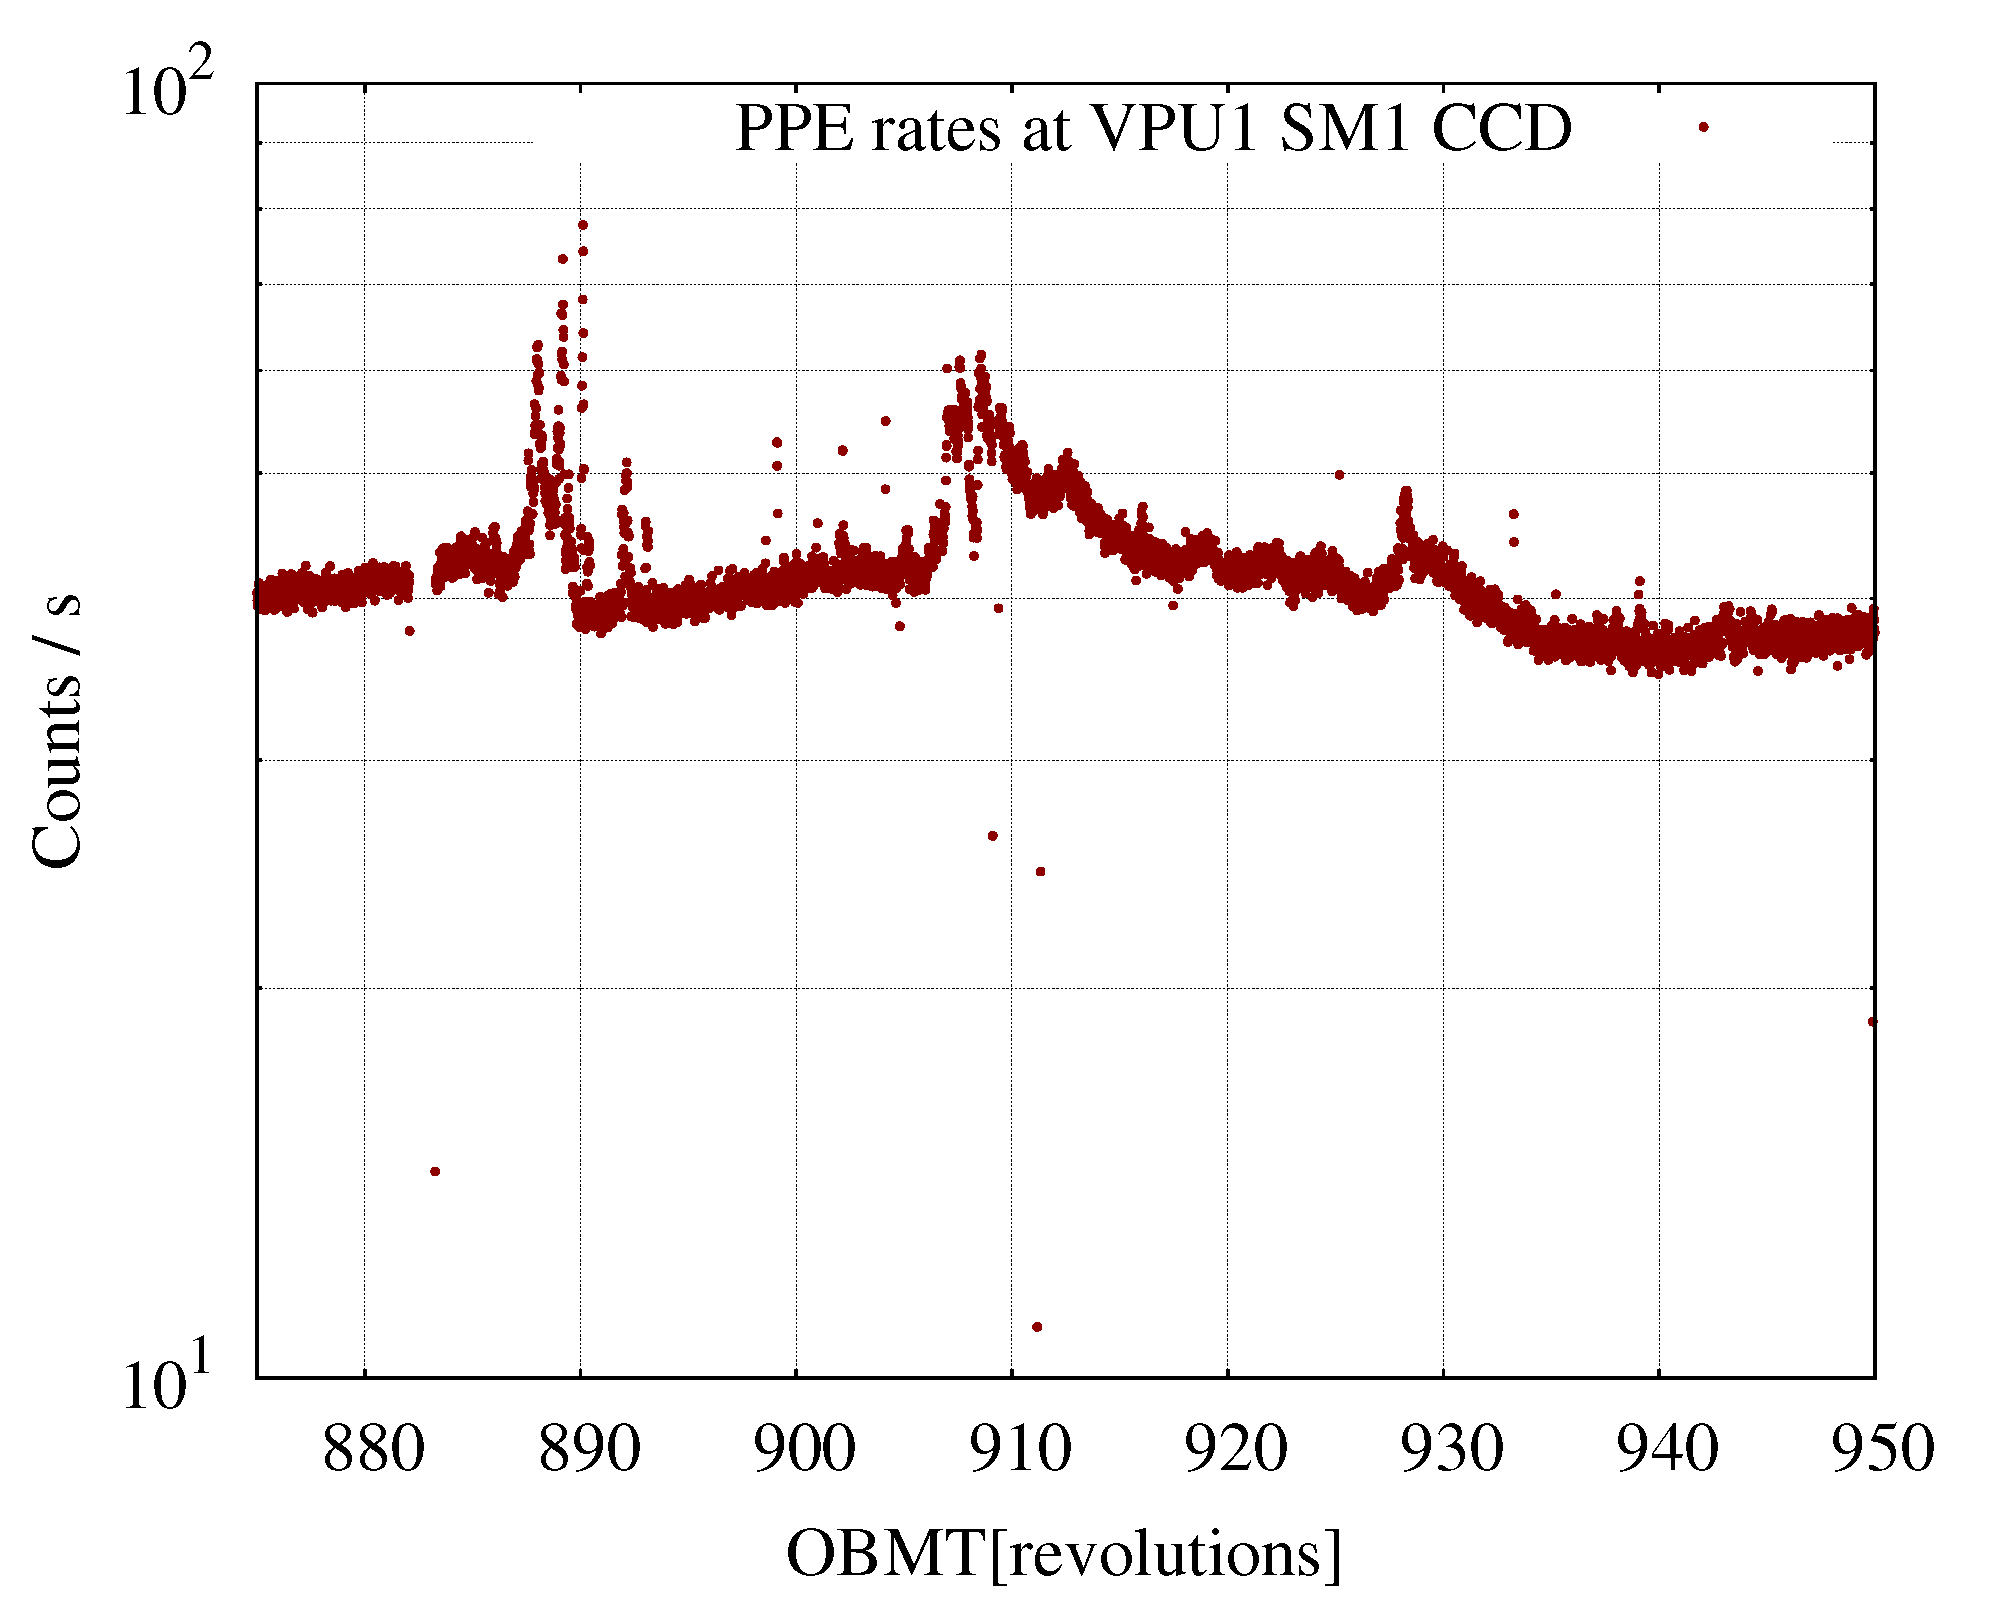
The filtering mechanism described above and taking place at the SM CCDs is followed by a confirmation stage in the AF1 CCDs. This stage removes those ’objects’ that, having been detected in SM, do not re-appear in AF1 at the ’right’ location with the ’right’ flux. Non-confirmed objects are typically cosmic rays or Solar protons. Detection-process statistics (e.g., the number of rejected prompt-particle events) are telemetered to ground in the form of auxiliary-science-data (ASD) packets of type 4 (see Section 2.2.2). These are only counters (in fact a ’by-product’ of the detection chain) and neither energy nor nature of the impacting radiation particles are provided. Figure 1.13 shows the typical prompt-particle-event rates extracted from the auxiliary science telemetry. The prompt-particle-event time lines contain two main features, namely (i) ’peaks’ of counts (expectedly) concentrated around times of increased radiation activity, and (ii) a ’background’ count rate (at 40 counts s) which is present at all times, on top of which the variable Solar activity (i.e., component (i)) shows up.
The predicted background rate measured at a CCD (either SM or AF) produced by an incident, isotropic flux of prompt-particle events is given by (see Sullivan 1971):
| (1.2) |
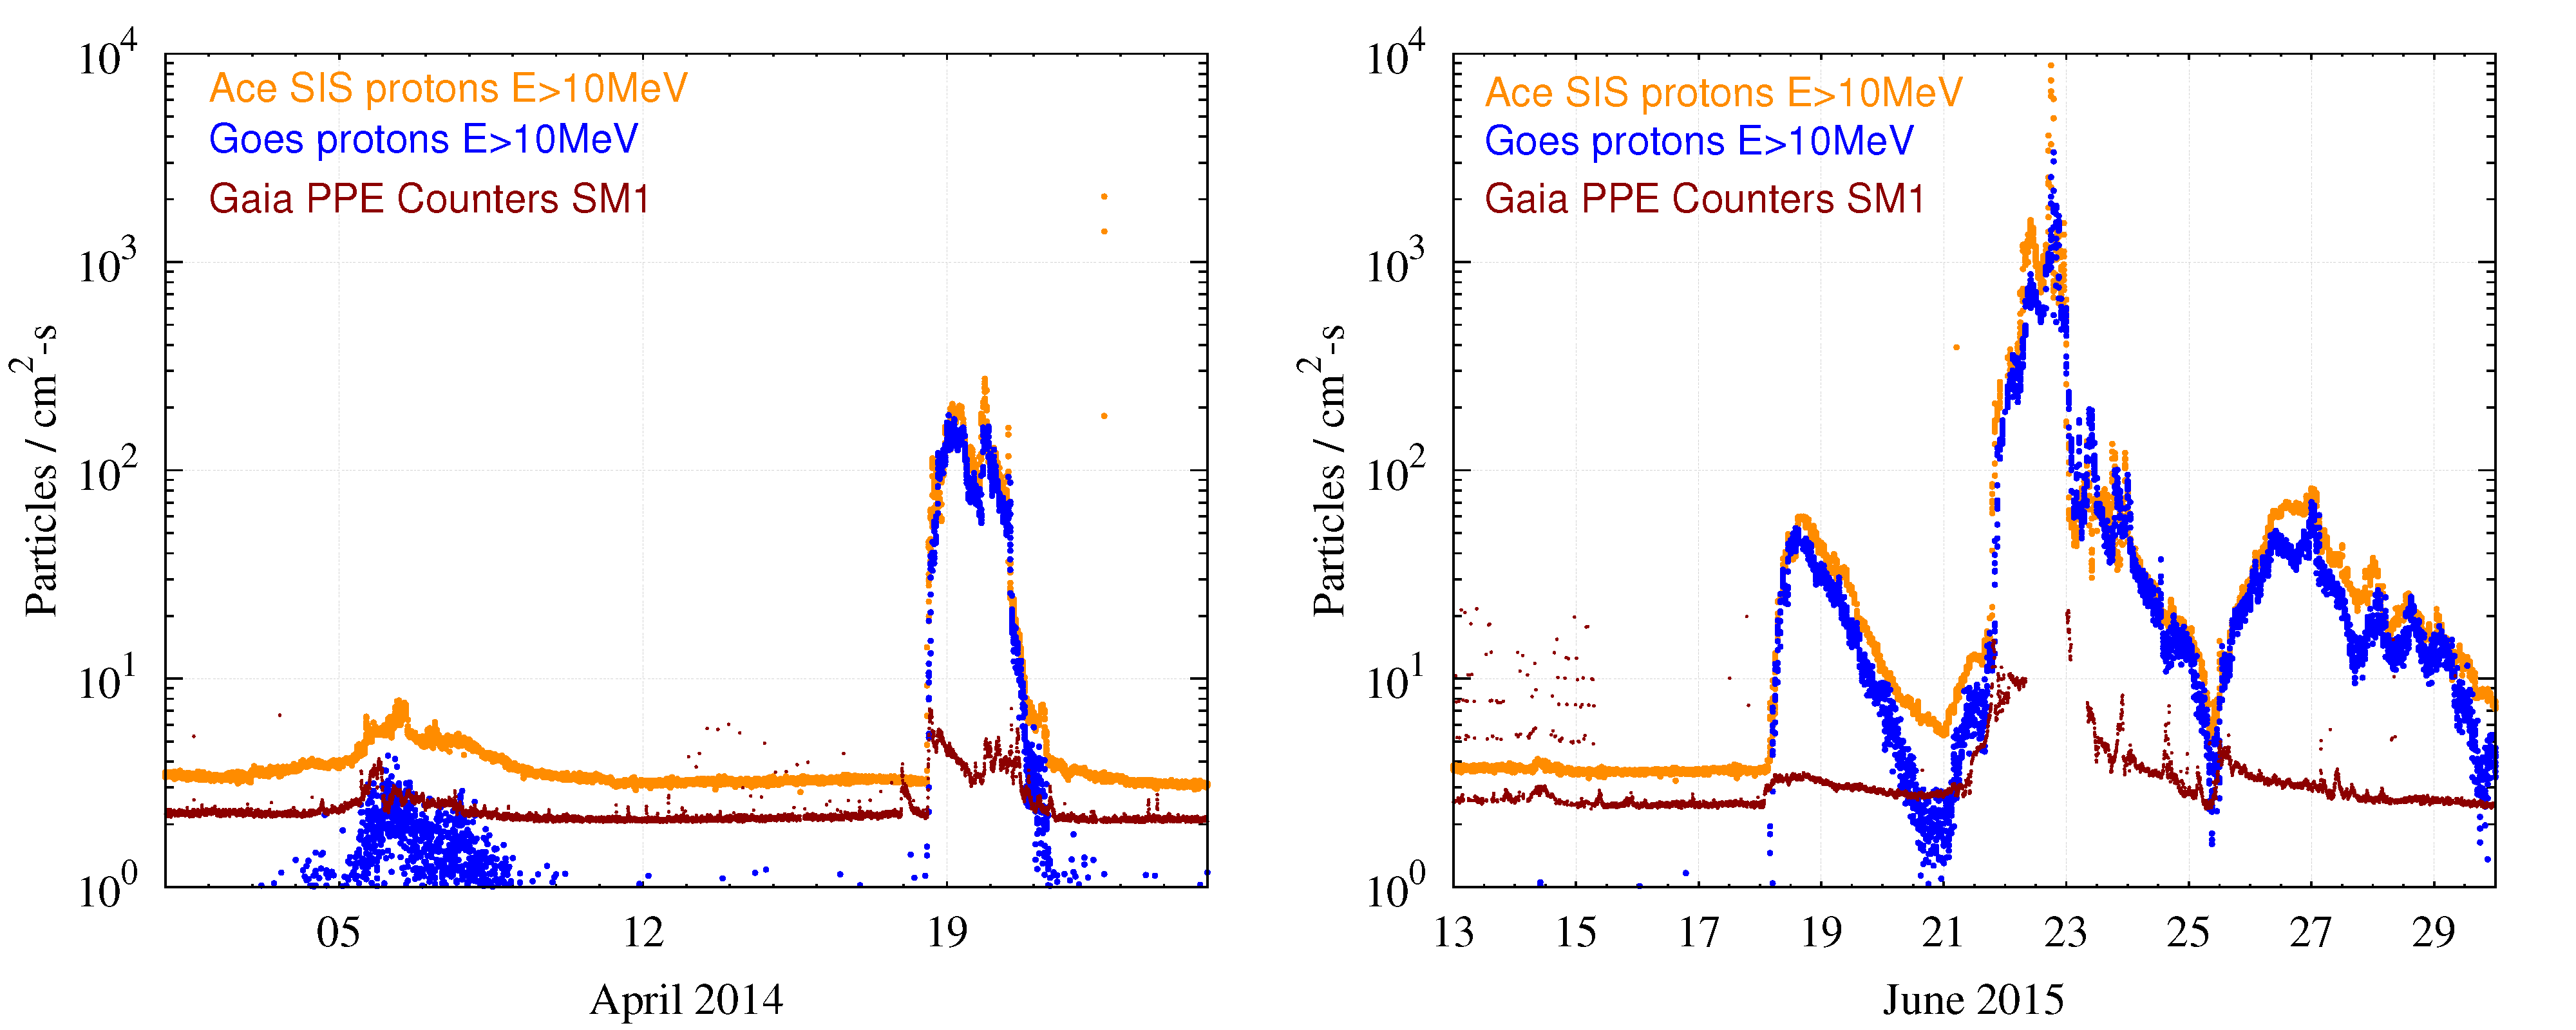
where is the effective surface area of the given detector in cm ( cm for SM CCDs, taking the permanently-active TDI gate into account) and is expressed in particles cm s. For a typical particle background rate at L2 of 5 protons cm s (Barth et al. 1999; Catalano et al. 2014), the expected prompt-particle-event rate measured by Gaia at L2 is counts s, which is in good agreement (10% difference) with the actually measured rates. The peaks in the prompt-particle-event counters are clearly correlated with increased Solar activity. Figure 1.14 shows a selected, qualitative comparison of Gaia prompt-particle-event counters with data from dedicated radiation-monitoring instruments on-board other spacecraft, in particular ACE (http://www.srl.caltech.edu/ACE/) and GOES (http://www.swpc.noaa.gov/products/goes-proton-flux). The agreement is satisfactory, taking into account that the Gaia focal plane is shielded by the thermal-tent structure, the focal plane itself, and the service-module of the spacecraft such that it should systematically measure reduced (low-energy) particle fluxes than the fully-exposed, dedicated radiation instruments on-board the other spacecraft.
Prompt-particle events impacting on a CCD can produce displacement radiation damage. The silicon-lattice defects (’traps’) created in this process impact the charge transfer of the photo-electrons during the readout in TDI mode as charge is trapped and released, with typical time scales depending on the device temperature and the trap species (Section 1.3.3). The resulting degradation in the charge-transfer efficiency – or charge-transfer inefficiency (CTI) effect, with – introduces a loss of signal (flux) measured in the window as well as a bias in the estimated centroid position of each star with a dependency not only on the radiation dose but also on the (recent) illumination history of the pixels in question (Prod’homme et al. 2011, 2012; Holl et al. 2012b). On-board measures have been taken to mitigate this effect, e.g., periodic activation of charge injections (CIs; Section 1.3.3) that help to keep existing (slow) traps filled. The flux loss and centroid bias, nonetheless, are significant, in particular when significant radiation levels have been experienced, and need to be corrected in the data processing (e.g. Short et al. 2013). Such calibrations have not yet been implemented for Gaia DR2.
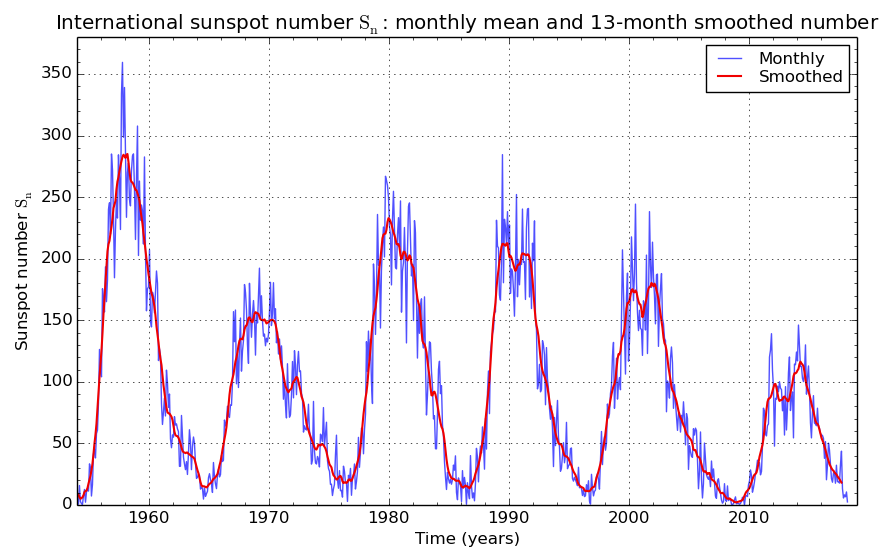
Gaia was launched in December 2013, just after the maximum of Solar cycle 24. Solar activity during the mission is therefore progressively decreasing towards Solar minimum (see Figure 1.15), resulting in a ’benign’ situation from a CCD-radiation-damage perspective.
The Gaia prompt-particle-event counters are used to monitor the instantaneous radiation environment experienced by Gaia at L2 and its possible implications for radiation damage. For a quantitative assessment, however, first-pixel-response analysis of charge injections (Section 1.3.3) is used to study the level of radiation damage accumulated by the Gaia CCDs.
Focus
Although the focus of both Gaia telescopes has been optimized during commissioning, the image quality shows significant time evolution. As recognition of the direct impact of the focus of the telescopes on the mission performance (astrometric precision and spectral resolution), the First Look pipeline (Section 2.5.2) provides a suite of diagnostics to monitor the image quality on a daily basis. The astrometric (centroiding) precision is the most sensitive parameter and can be quantified via the Cramér-Rao metric (or bound), as explained in Lindegren (1978, 2010):
| (1.3) |
where is the maximum precision (minimum uncertainty) of the estimate of the along-scan centroid for a given star observed in a window with along-scan samples, labelled on a given CCD transit (that is, the along-scan astrometric information contained in an individual image), is the total number of electrons for an ’infinite-size’ window, is the normalised point-spread function (PSF) multiplied by , that is the number of electrons collected from the star for each pixel , is the derivative of with respect to the along-scan pixel coordinate, is the root-mean-square (RMS) readout noise (in electrons), and is the sky background (in electrons), which is assumed to be spatially homogeneous. This equation can be used to estimate how close in performance any given point- or line-spread-function centroiding method is to the maximum, theoretical performance based on fundamental information technology.
Unfortunately, usage of Equation 1.3 to estimate the (absolute) Cramér-Rao bound requires the availability of a detailed characterisation of the payload and actually of each star, including having a library of oversampled point-spread functions with colour and across-scan dependence. This makes Equation 1.3 unsuitable for quick estimates and daily monitoring. However, relative Cramér-Rao measurements for bright stars are much simpler:
| (1.4) |
where is a normalised metric which is independent of the actual stellar flux for bright stars for which the Poisson noise dominates (). For these objects, can be approximated by using just the actual, ’raw’ sample values and their finite differences for . An average value can thus be provided and used for frequent payload health checks. The approximate method provides relative and not absolute measurements and is affected by additional effects such as stellar colour, across-scan position, and/or sub-pixel position. However, its simplicity provides a useful proxy to monitor the overall focus evolution of both telescopes and allows to decide whether and to predict when a refocus is needed.
Figure 1.16 shows the history of the relative astrometric image quality for each field of view averaged over all CCDs throughout the mission, estimated through Equation 1.4 using all unsaturated, non-TDI-gated, class-0 observations (i.e., mag; Table 1.1). Although the focus has never been completely stable, the relative Cramér-Rao bound values are always close to and mostly below unity, as expected for good-quality, near-diffraction-limited telescopes. Sharp discontinuities are introduced by payload decontaminations (Section 1.3.3 and Table 1.6) and these operations always recover (part of) the optical quality. However, fine adjustments (refocussing) have sometimes been applied following decontaminations (Section 1.3.3 and Table 1.6). Figure 1.16 shows that the degradation slope is becoming smaller with time, pointing to a payload becoming increasingly more and more stable.
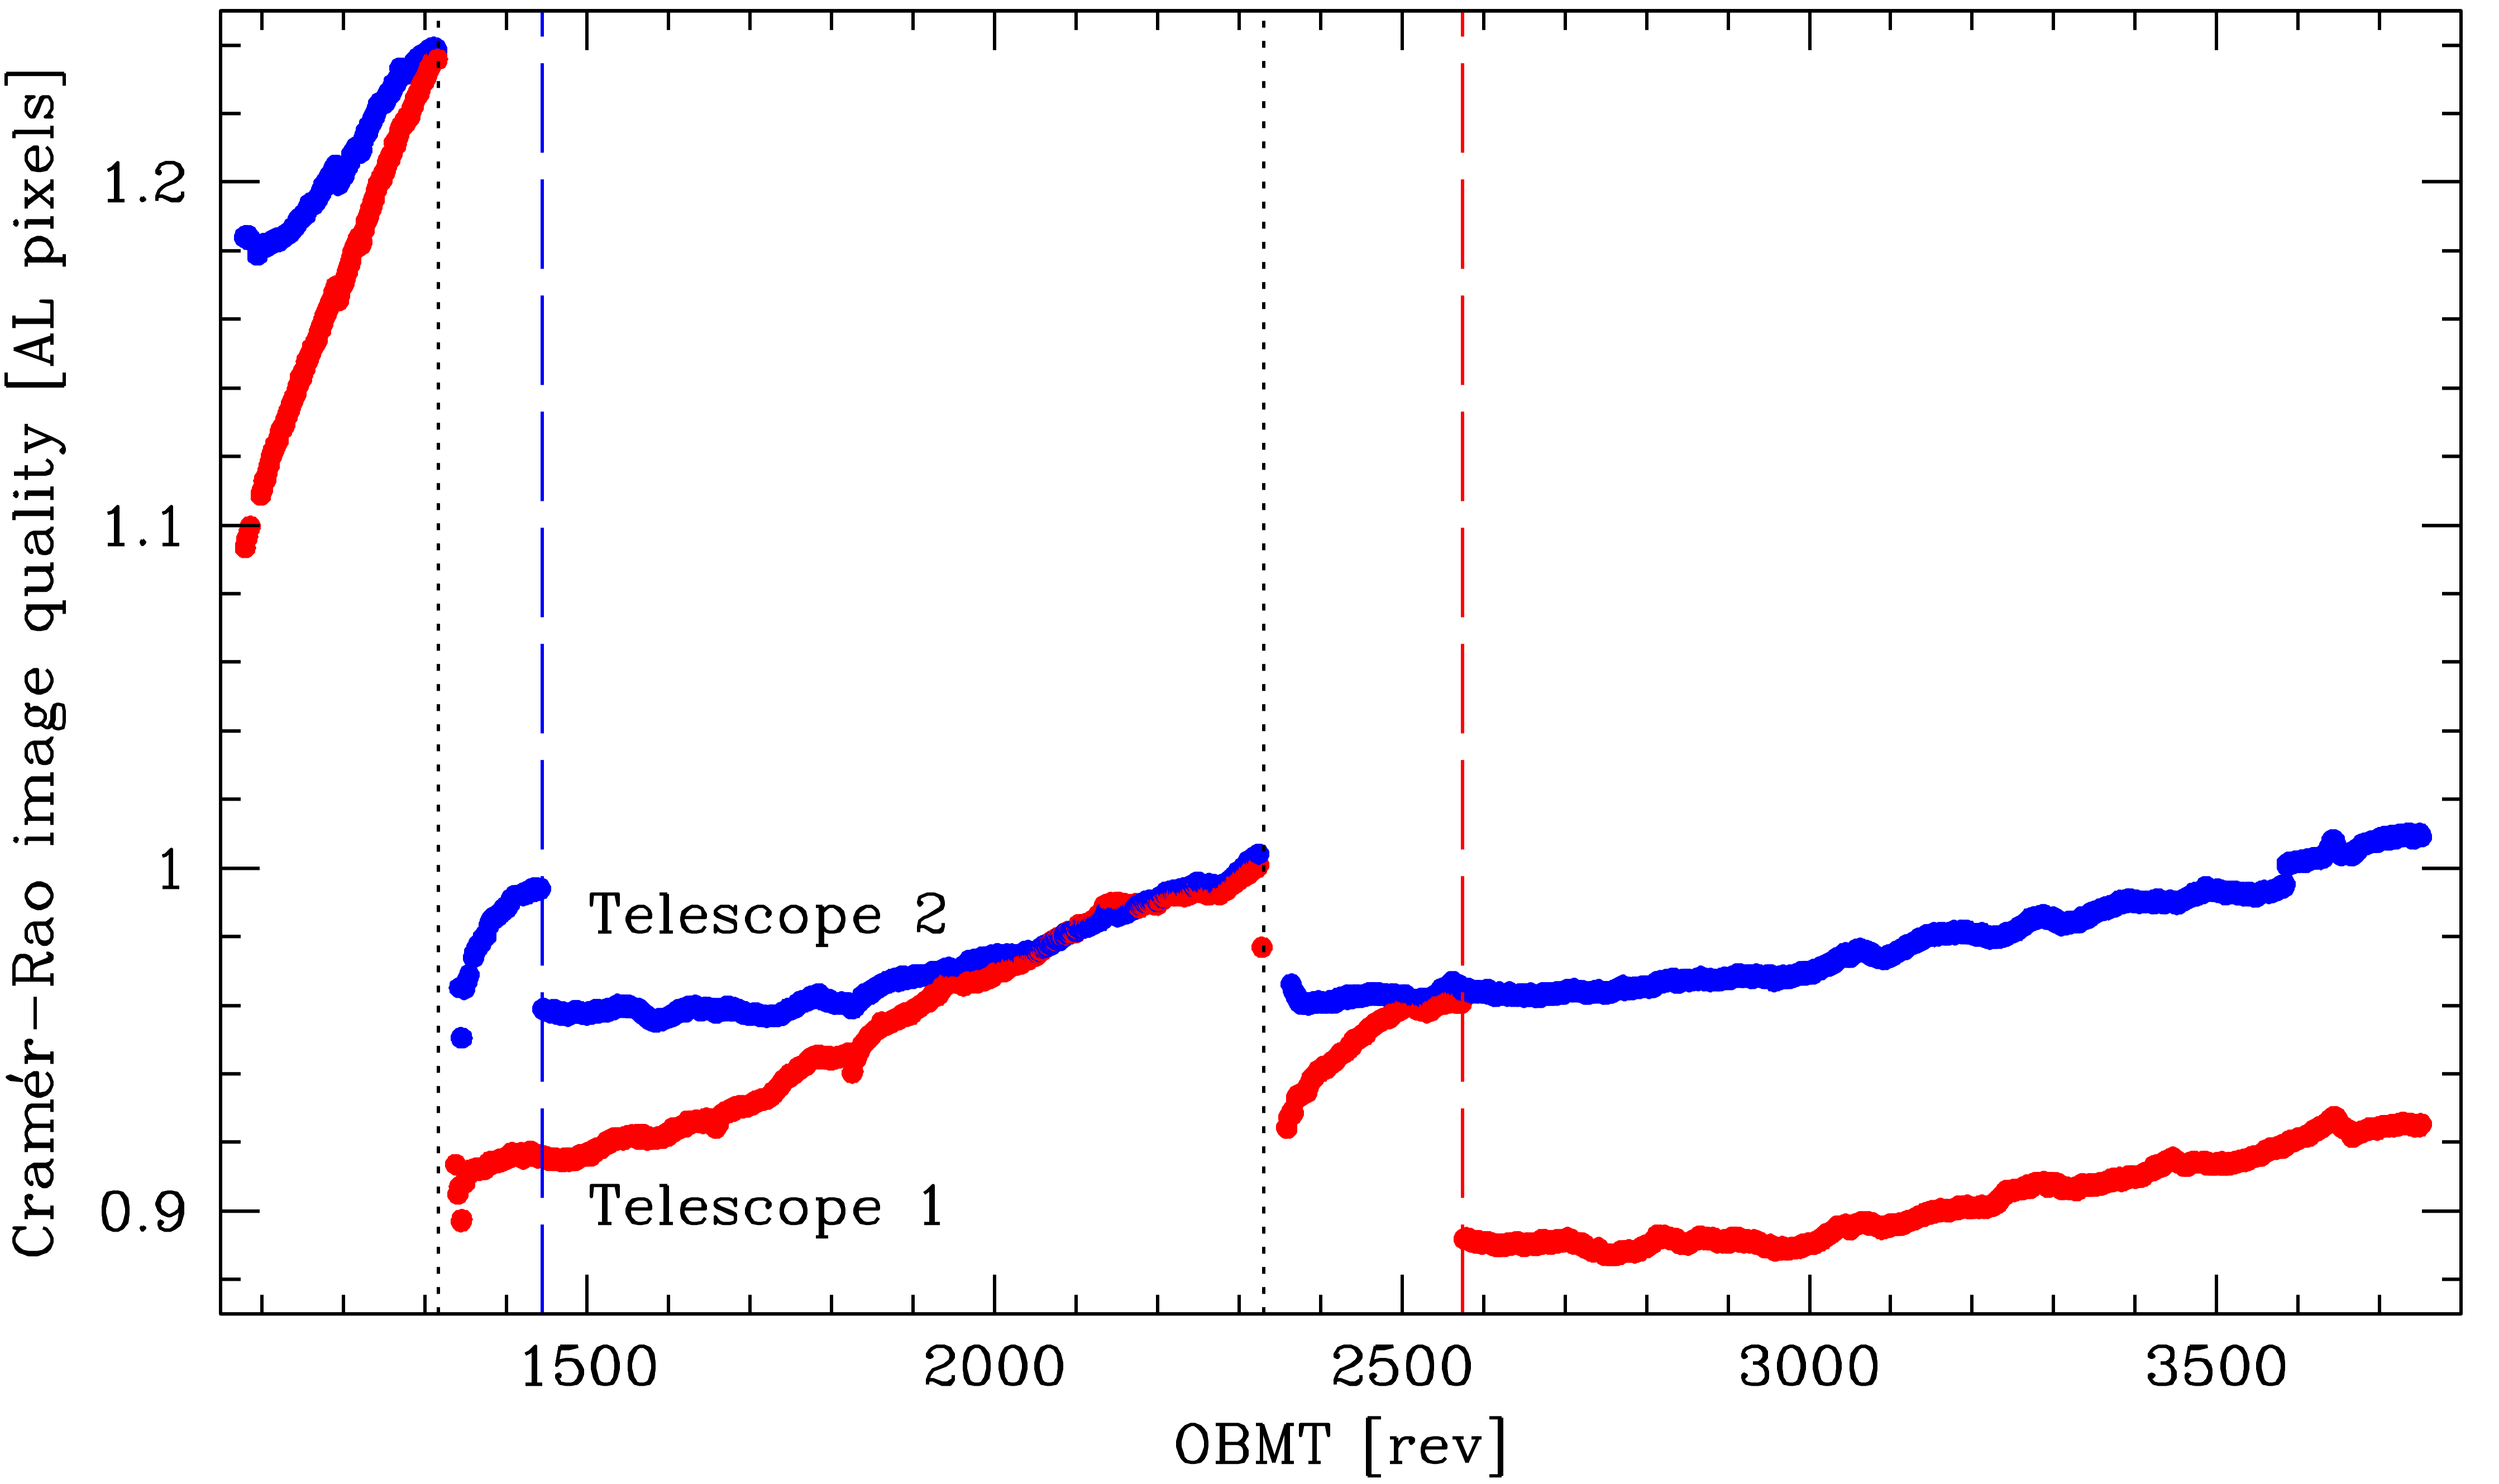
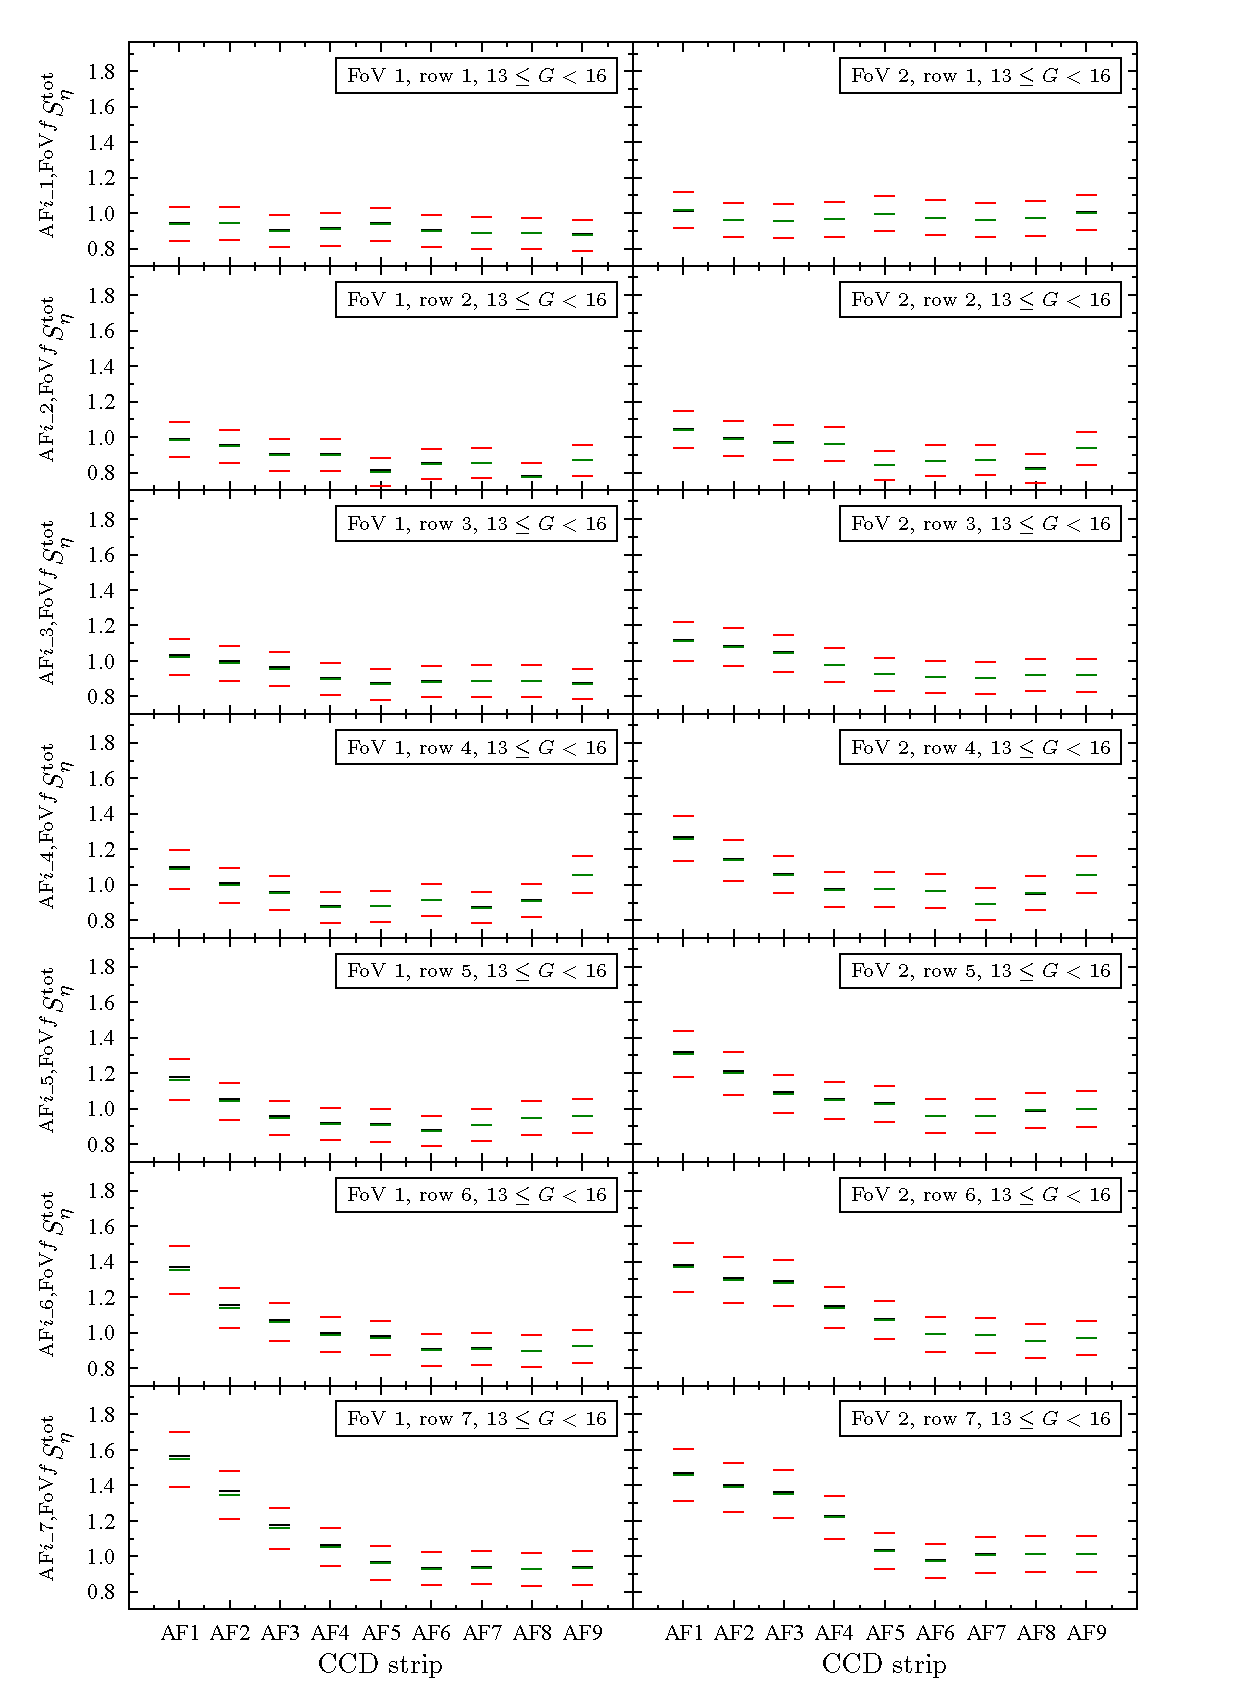
Figure 1.17 shows the relative astrometric image quality for each CCD and field of view, as estimated during a typical day. The field-of-view dependence of the astrometric quality is apparent, as are variations over the field-of-view for a given telescope. Such variations are expected for the large field-of-view covered by Gaia. Optimum image-quality values are typically achieved in CCD strips AF5–AF8.
Transmission
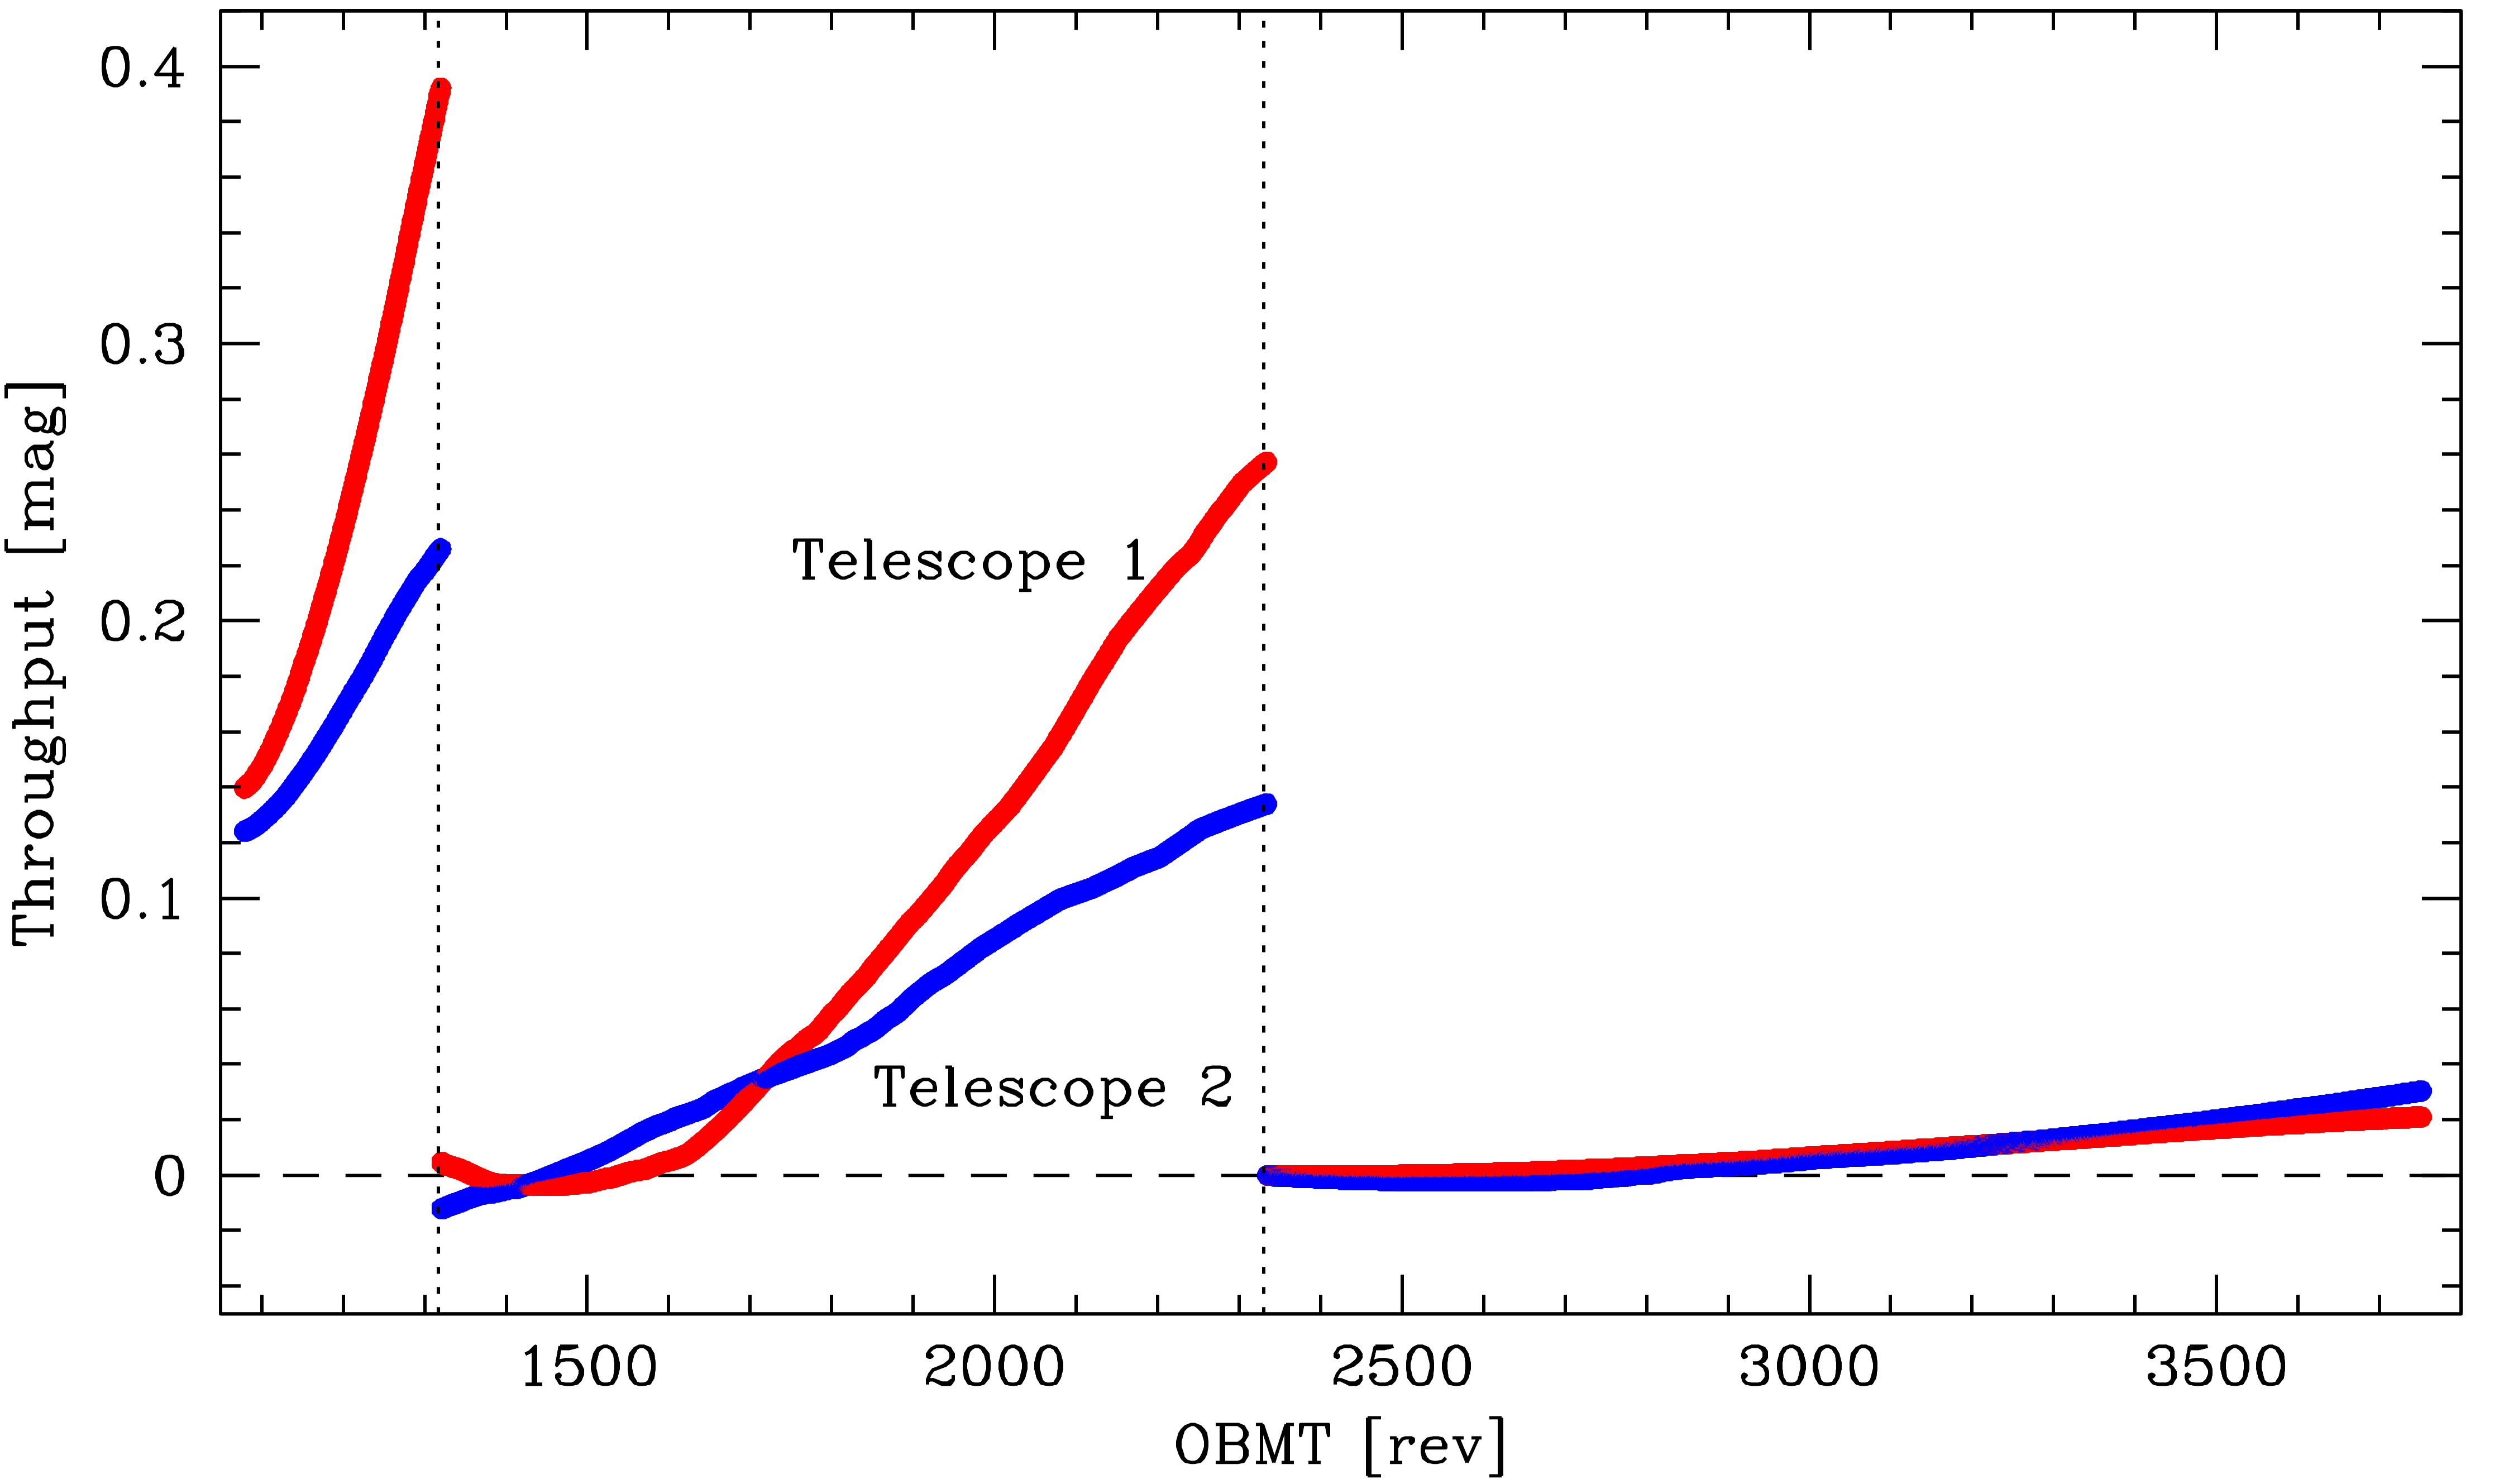
As explained in Gaia Collaboration et al. (2016), the early phases of the mission suffered from water-ice build-up on the reflective surfaces of the telescopes. The associated throughput degradation has been successfully mitigated by a number of payload decontaminations, i.e., controlled heatings of the mirrors and the focal plane. A total of six decontaminations have been carried out so far (Table 1.6), three of which during the commissioning phase, two during the Gaia DR2 time interval, and the latest at the time of writing (February 2018) on 22 August 2016. Figure 1.18 shows the temporal evolution of the transmission of both telescopes. As a result of the significant reduction of the ice-accumulation rate, a very small number of (if any) decontaminations will still be needed in the future.
As a consequence of the response variation with time, there has been a corresponding variation in the magnitude limit for the Gaia observations throughout the mission. This is unavoidable since the on-board, faint-star detection limit is defined as a certain, fixed flux level. As a result, when contamination builds up, the effective faint limit becomes temporarily (up to) a few tenths of a magnitude brighter than the nominal threshold at mag (Section 1.3.3).
Video-processing-unit configuration
The Video Processing Units (VPUs; Section 1.1.3) assign, among others, the window size, sampling class (Table 1.1), and observation priority to each object that is detected and confirmed for observation. The VPU algorithms (VPAs) running on each VPU are highly parametrised. The configuration of the VPU and VPA parameters, which is carefully tracked in the CDB (Section 1.2.3), determines which objects are observed. During the time interval covering Gaia DR2, the VPU application software (i.e., the VPAs) has been updated from version 2.7 to 2.8 in the period 24–28 April 2015. Version 2.8 allows enhanced flexibility in the areas of the RVS across-scan window size and RVS faint limit, the AF2–9 faint-star across-scan window size, the AF1 coarse-confirmation parametrisation, and the on-board suppression of double detections in the sky mapper.
Detection-chain-parameter settings
During the time interval covering Gaia DR2, several changes to the detection-parameter settings have been made. The Gaia DR2 interval started off with a faint SM detection threshold defined at mag. On 15 September 2014, this threshold was lowered to mag. On 27 October 2014, this threshold was changed to its final value mag. The AF1 confirmation parameters were changed on 15 September 2014, on 27 October 2014, and on 11 May 2015.
Other VPU parameter changes made during the Gaia DR2 interval include a dark-signal non-uniformity (DSNU) look-up-table update for an evolving bright column in the SM2 CCD in CCD row 4 on 16 December 2014 (Section 1.3.3), an update of the RVS across-scan centring bias and offset on 3 February 2015, a patch of the parameter defining the AF1 TDI gates on 20 May 2015, an update of the saturation as well as the faint detection thresholds for double detections on 4 July 2015, an update of the adaptive RVS magnitude thresholds on 1 September 2015, and an update of the across-scan position of the BAM window for the following telescope on 22 November 2015.
RVS window-size and RVS faint-threshold settings
VPU software version 2.8 contains four modifications aimed at partially recovering the RVS performance loss induced by the unexpectedly high levels of straylight measured in orbit (see Gaia Collaboration et al. 2016): (1) an increased along-scan RVS window size to allow a better background determination, (2) the option to have stair-like windows in RVS to accommodate the presence of small tilt angles of the spectra, (3) an adaptive across-scan RVS window size to optimize the signal-to-noise ratio of the data, in particular for faint stars, and (4) an adaptive faint RVS threshold to avoid wasting resources on faint-star spectra collected during times of high straylight levels:
-
1.
The along-scan size of the RVS window was increased from 1260 TDI1 to 1296 TDI1 lines (along-scan pixels). This modification is hard-coded in the software by increasing the RVS macro-sample size from 105 TDI1 to 108 TDI1 lines.
-
2.
A new VPU parameter allows windows to have stair-like shapes to allow for small across-scan tilts of the spectra. The default shape of the window is now derived from the rectangular shape by shifting each of the 12 macro-samples of the window towards positive across-scan coordinates by a user-defined offset. These offsets are a function of the RVS CCD strip, the field-of-view, and the across-scan position of the object in AF1. After testing and careful consideration, it has been decided to not use this functionality for science data collection.
-
3.
The adaptive faint threshold is defined by a new parameter which depends on the heliotropic phase of the spin during the six-hour revolution and on the across-scan position of the object in the CCD and focal plane. Prior to the RVS resource-allocation algorithm (Section 1.1.3), a new object filter based on the RVS magnitude has been added to preselect the candidate objects as function of the heliotropic phase of the spin (which is a good proxy for the instantaneous intensity of the straylight). During times of high straylight levels, the RVS faint limit is as bright as =15.5 mag, whereas at times of low straylight levels, it is lowered to values as faint as 16.2 mag.
-
4.
The adaptive across-scan window size in RVS is defined by a new pair of parameters which are a function of the heliotropic phase of the spin, the RVS magnitude, the field-of-view, the RVS CCD strip, the across-scan position of the object in AF1, and the across-scan smearing (i.e., the spin phase in the six-hour revolution). After testing and careful consideration, it has been decided to not use this functionality and operate with a constant across-scan size of 10 pixels.
Both the adaptive faint threshold and the adaptive across-scan window size in RVS use the heliotropic phase of the spin. The latter is derived on-board from a simple model which requires periodic (roughly monthly) calibration / parameter updates.
Payload-data-handling-unit configuration
The science data collected by the VPUs (i.e., the star packets and the auxiliary-science-data packets; Section 2.2.2) is temporarily stored in the payload data-handling unit (PDHU; Section 1.1.3) before being transmitted to ground (see also Gaia Collaboration et al. 2016). The PDHU contains (up to) 256 files, each labelled with a unique number (File_ID), to allow prioritising data. Down-link-priority and data-deletion settings are user defined and tracked in the CDB (Section 1.2.3). In general, bright stars have a higher priority for being telemetered to ground first and are protected on-board from being deleted (Table 1.10). During the time interval covered by Gaia DR2, a few changes to the priority settings have been made: the non-unity, so-called ’multiplexing ratios’ have been multiplied by a factor 10 on 28 October 2014, the faint-end granularity for SP2 packets was improved on 10 November 2014, and the position of the ASD4 and BAM File_IDs in the down-link priority table was swapped on 16 September 2015 so that the on-board control procedure that stops the down-link in case link problems are detected, affects BAM data rather than ASD4 data.
| Star | Bright mag- | Faint mag- | Deletion |
| packet | nitude limit | nitude limit | percentage |
| SP1 | 5.00 | 13.00 | 0 |
| SP1 | 13.00 | 16.00 | 0 |
| SP1 | 16.00 | 16.30 | 1 |
| SP1 | 16.30 | 17.00 | 1 |
| SP1 | 17.00 | 17.20 | 2 |
| SP1 | 17.20 | 18.00 | 2 |
| SP1 | 18.00 | 18.10 | 2 |
| SP1 | 18.10 | 19.00 | 2 |
| SP1 | 19.00 | 19.05 | 2 |
| SP1 | 19.05 | 19.95 | 7 |
| SP1 | 19.95 | 20.00 | 2 |
| SP1 | 20.00 | 20.30 | 13 |
| SP1 | 20.30 | 20.40 | 12 |
| SP1 | 20.40 | 20.50 | 13 |
| SP1 | 20.50 | 20.60 | 29 |
| SP1 | 20.60 | 20.70 | 28 |
| SP1 | 20.70 | 20.80 | 28 |
| SP1 | 20.80 | 20.90 | 29 |
| SP1 | 20.90 | 21.00 | 24 |
| SP2 | 5.00 | 10.50 | 0 |
| SP2 | 10.50 | 11.00 | 1 |
| SP2 | 11.00 | 11.30 | 1 |
| SP2 | 11.30 | 12.00 | 1 |
| SP2 | 12.00 | 12.20 | 1 |
| SP2 | 12.20 | 13.00 | 1 |
| SP2 | 13.00 | 13.10 | 1 |
| SP2 | 13.10 | 14.00 | 1 |
| SP2 | 14.00 | 14.05 | 2 |
| SP2 | 14.05 | 15.00 | 10 |
| SP2 | 15.00 | 15.05 | 2 |
| SP2 | 15.05 | 15.50 | 13 |
| SP2 | 15.50 | 15.80 | 7 |
| SP2 | 15.80 | 16.00 | 6 |
| SP2 | 16.00 | 21.00 | 5 |