10.3.4 Radial velocity distributions
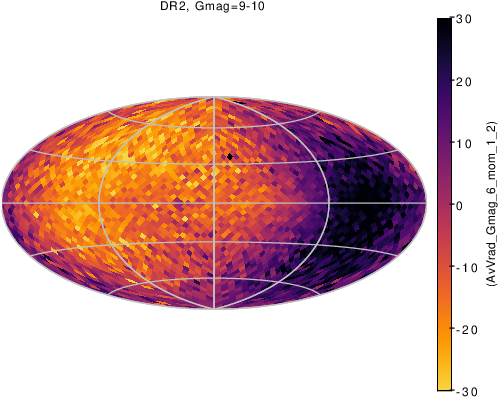
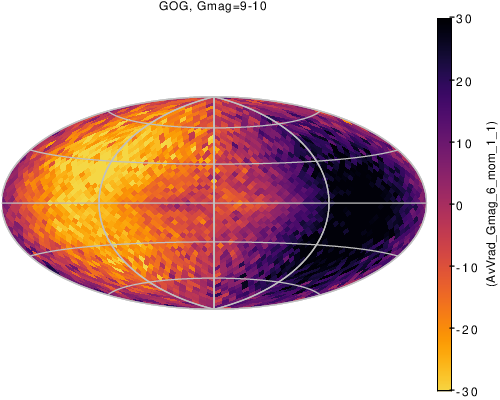
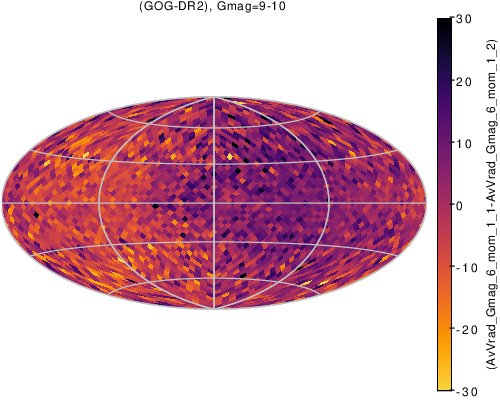
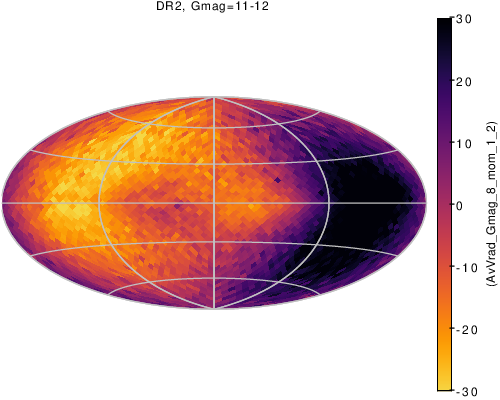
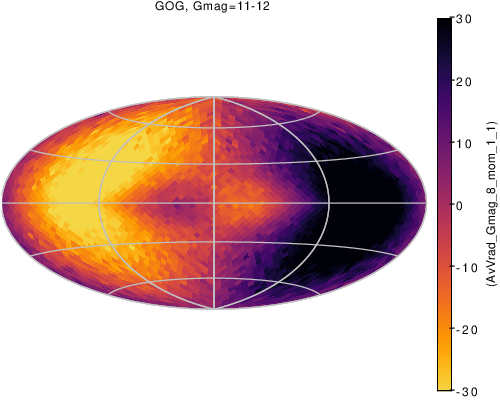
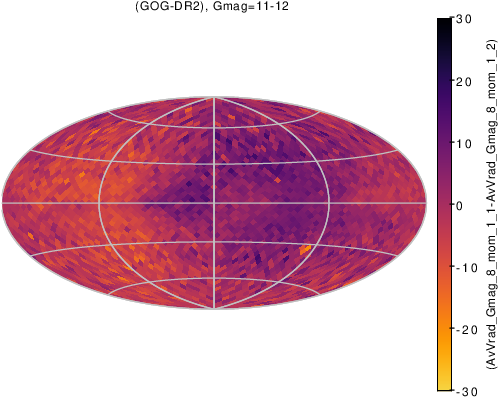
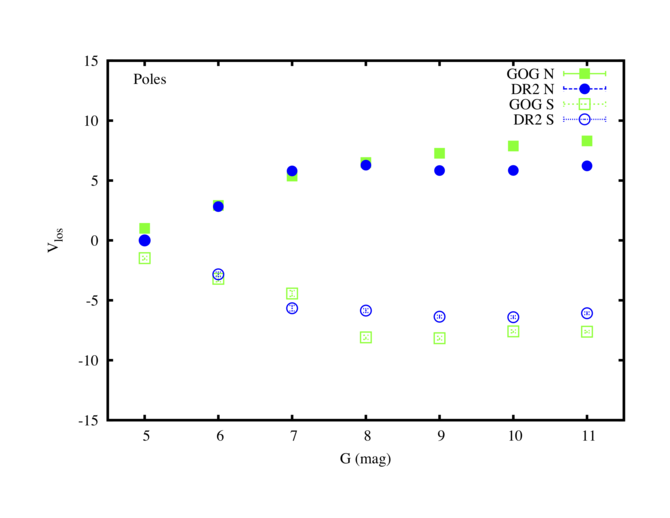
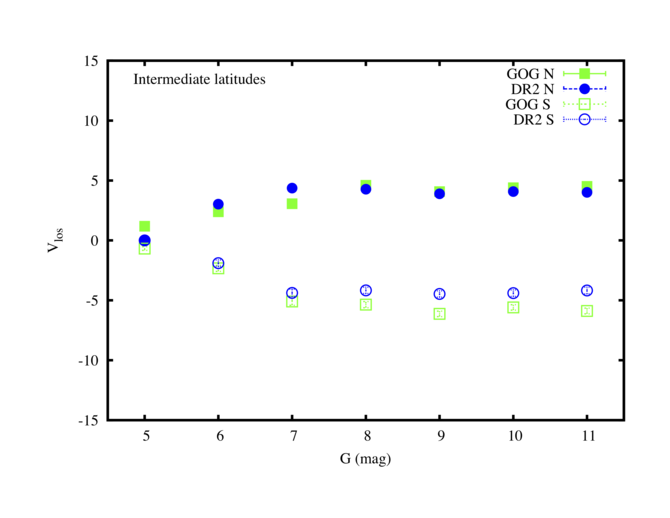
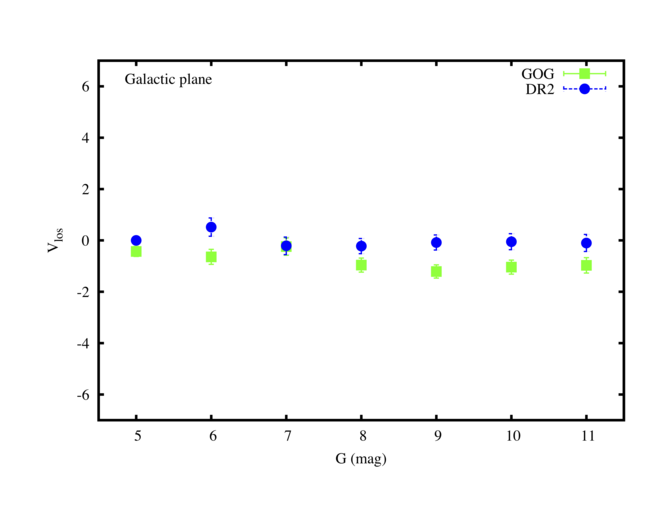
Radial velocity distributions are computed for data and simulations separately, then combined and inter-compared. Absolute difference between Gaia DR2 and GOG18 simulation of the mean and standard deviations of the radial velocities are computed. The maps are shown Figure 10.28 for 2 magnitude ranges. The mean radial velocity as a function of magnitude for Gaia DR2 data and for GOG simulations are given Figure 10.29. We see that there is no systematic significant difference between model and data, at least not that can be attributed to the data themselves. The data show clearly the Galactic rotation as expected.
 |
 |
 |