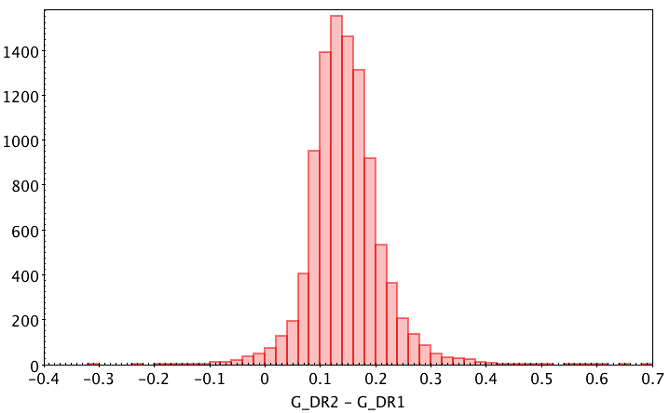
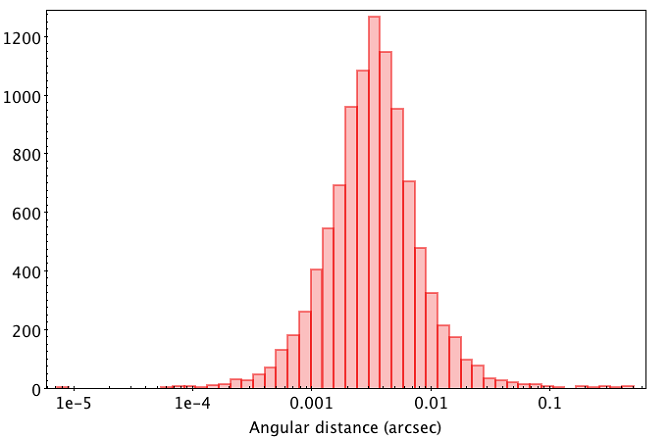
Even if no selection of best neighbours has been made, three diagnostics have been provided for each possible match: the band magnitude difference, angular distance and the empirical metrics “rank” defined below. They provide some first order information in case of multiple neighbours. Figure 11.1 and Figure 11.2 show histograms for the magnitude difference and angular distance for the first 10000 random neighbours in the table in linear and log scale, respectively. Two things are apparent. First, both distributions are reasonably compact and unimodal. Second, the average values and standard deviations for such subsample are:
Figure 11.1: Magnitude difference between DR2 and DR1 possible matches.Figure 11.2: Angular distance between DR2 and DR1 possible matches.
(11.1)
(11.2)
(11.3)
(11.4)
The average distance between sources in both releases is thus around 3.4 mas, consistent with the exquisite positions provided by Gaia and the very small reference epoch difference. Regarding the magnitude difference, the average value is non-zero. This can be puzzling at first sight, but can be easily explained by the evolution of the used transmission curve in each catalogue.
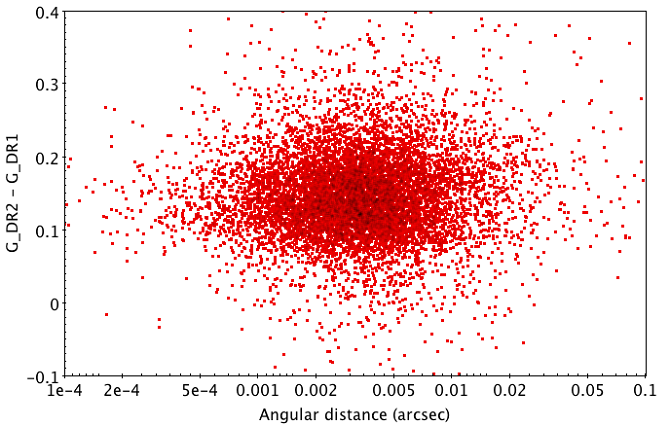
Figure 11.3 shows both vs . No evident correlation between both quantites can be appreciated. Therefore, the empirical metrics “rank” has been defined as follows:
Figure 11.3: Gaia DR2 to Gaia DR1 neighbour magnitude difference vs angular distance.
(11.5)
Figure 11.4 shows the distribution of values in log scale. Should the magnitude difference and log distance follow true independent Gaussian distributions, the rank could be interpreted in terms of match probability. Even when considering the more complex nature of the data, it still provides a single metrics combining both match criteria (flux and distance), larger numbers hinting at less probable matches. Note a small sample, and not the full catalogue, has been used to define the average values and dispersions in the rank definition. This is OK for qualitative studies, but is yet another reason to take a careful look at the data and avoid simplistic analyses when determining matches.
Figure 11.4: DR2 to DR1 neighbour possible match rank.