8.5.4 Comparison with subsets
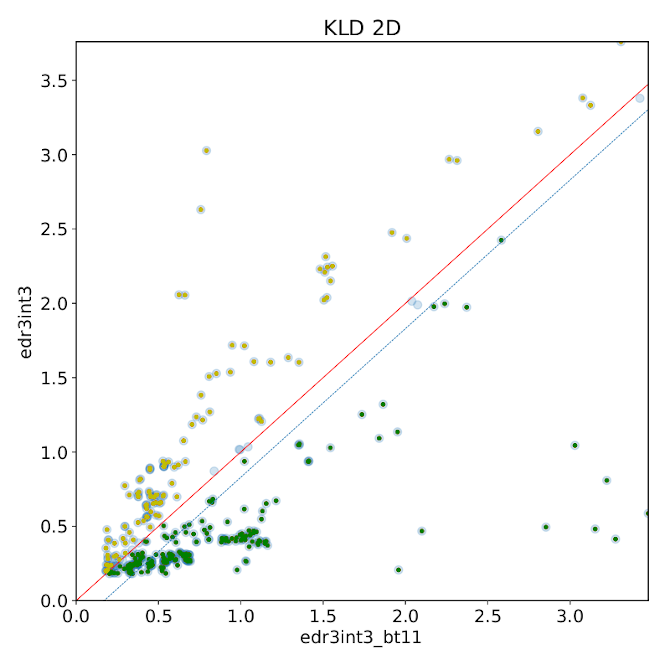
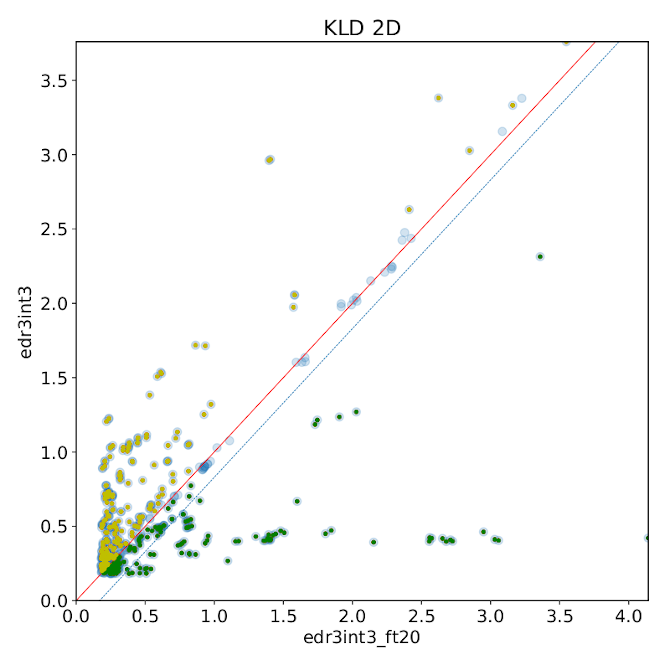
We also compared the 2D clustering in edr3int3 with its subsets. In particular, we consider the brightest (), and the faintest () subsets. Figure 8.25 shows that in general, compared to the all sky dataset, there is more clustering in the brightest subset, and less clustering in the faintest subset, except for quantiles in faint: the nearly horizontal distribution of points is due to the flux quantiles, which because of ‘noise’ on the measurements at the faint end becomes more uniform, and less on the 1-to-1 line.
While in the bright subset, where there is more clustering in the full dataset, this is because for the bright subset, most stars have really small errors and hence, all fall in one bin, making the KLD very low.
 |
 |